Full Terms & Conditions of access and use can be found at
http://www.tandfonline.com/action/journalInformation?journalCode=trsl20
Download by: [120.164.44.208] Date: 20 January 2016, At: 20:34
Remote Sensing Letters
ISSN: 2150-704X (Print) 2150-7058 (Online) Journal homepage: http://www.tandfonline.com/loi/trsl20
A simple method for developing near real-time
nationwide forest monitoring for Indonesia using
MODIS near- and shortwave infrared bands
Yudi Setiawan, Kustiyo Kustiyo & Arief Darmawan
To cite this article: Yudi Setiawan, Kustiyo Kustiyo & Arief Darmawan (2016) A simple method for developing near real-time nationwide forest monitoring for Indonesia using MODIS near- and shortwave infrared bands, Remote Sensing Letters, 7:4, 318-327, DOI: 10.1080/2150704X.2015.1137645
To link to this article: http://dx.doi.org/10.1080/2150704X.2015.1137645
Published online: 20 Jan 2016.
Submit your article to this journal
View related articles
A simple method for developing near real-time nationwide
forest monitoring for Indonesia using MODIS near- and
shortwave infrared bands
Yudi Setiawana, Kustiyo Kustiyoband Arief Darmawanc
aCenter for Environmental Research, Bogor Agricultural University, Bogor, Indonesia;bDeputy for Remote
Sensing Affair, Indonesian National Institute of Aeronautics and Space (LAPAN), Pekayon, Indonesia;
cREDD + Agency of Republic of Indonesia, Jakarta, Indonesia
ABSTRACT
Regarding to the deforestation and forest degradation issue in Indonesia, it is an urgent need to develop near real-time forest monitoring that can be seen by the public to make sure the trans-parency of forest resources management. Remote-sensing technol-ogy seems to be a powerful tool for monitoring and assessing the changes in forest cover immediately. We explored 250 m multi-temporal Moderate Resolution Imaging Spectroradiometer (MODIS) data sets to assign a change of temporal land surface dynamics based on two indices; normalized difference vegetation index (NDVI) and open area index (OAI). The data sets werefiltered by twofiltering approaches, median moving window and linear inter-polation, in order to reduce the overall noise so as not to lose useful information from the time-series data. Our results indicated that the use of MODIS data as a basic information in the near real-time system offers great promise to detect the forest cover change in Indonesia’s forestland, since about 90.07% of area assigned to be a change area had actually changed. Meanwhile, about 34.97% of the forest cover change was not assigned to be a change area by the system. This result showed the need to evaluate the threshold in detecting forest cover change. Although the threshold issue is quite problematic in forest cover change detection, the results show that the methodology proposed in this study provides sufficient and useful information in forest monitoring; this includes the location, time and trajectories of the changes. The results of the detection system developed in this article will be available for potential users.
ARTICLE HISTORY Received 10 July 2015 Accepted 19 December 2015
1. Introduction
Indonesia is the third largest emitter of carbon dioxide (CO2) and the world’s largest emitter from agriculture, forestry and other land use (Pan et al. 2011). Over the past 5 years, Indonesia’s annual deforestation rate has averaged around 1 × 10⁶ha, which contributes to an estimated 87% of Indonesia’s annual greenhouse gas (GHG) emissions. A target to reduce GHG emissions in the range of 26% under a business-as-usual
CONTACTYudi Setiawan [email protected]
Present affiliation for Arief Darmawan is Faculty of Agriculture, Lampung University, Lampung, Indonesia. REMOTE SENSING LETTERS, 2016
VOL. 7, NO. 4, 318–327
http://dx.doi.org/10.1080/2150704X.2015.1137645
© 2016 Taylor & Francis
scenario by 2020 is a challenging commitment for a country aiming to maintain its 7% annual growth rate (Ministry of Environment2010).
Extending the theme above, it is an urgent need to develop a near real-time deforestation detection system that provides accurate and up-to-date information of forest cover change that can be seen by the public to make sure the transparency of forest resources management. In this context, remote-sensing technology seems to be a powerful tool to monitor the forest cover change immediately.
Monitoring of vegetation dynamics has attracted attention as a means for better understanding land change, including changes in forest cover (Petus, Lewis, and White 2013). Characterization of vegetation dynamics in the forestlands has often been made by using vegetation index values (Knight et al.2006), and the temporal dynamics of those index values are useful for detecting the forest cover change and their distributions (Lunetta et al.2006; Setiawan, Yoshino, and Prasetyo2014).
The uses of high temporal satellite imagery are necessary to develop methodologies that utilize information on daily variations of lands to detect the changes in forest cover. The MODIS high temporal resolution data have been used operationally in the near real-time deforestation detection (DETER) to detect and monitor deforested areas in the Brazilian Amazon (Shimabukuro et al.2006), theSistema de Alerta de Desmatamento(SAD) to monitor deforestation in different types of forest reserves in the State of Mato Grosso (Souza, Hayashi, and Veríssimo2009), and most recently, a system called FORest Monitoring for Action (FORMA), which provides near real-time information on new forest clearing in the humid tropical forests of Asia, Africa and Latin America (Hammer, Kraft, and Wheeler2009). The main objective of this study is to develop a reliable method that can provide informa-tion of changes in forest cover immediately. The results will be a part of the Strategy and Implementation Plan for Monitoring, Reporting and Verification (MRV) of the Reducing Emission from Deforestation and Forest Degradation Plus (REDD+) programme in Indonesia.
2. Methods
2.1. Satellite image
For this study, nine MODIS tiles were selected covering the study area. Each tile represents approximately a 10° by 10° segment of the earth’s surface.
Normalized difference vegetation index (NDVI) is commonly used to measure reliable spatial and temporal inter-comparison of terrestrial photosynthetic activity, in other words, this permits a characterization of the main properties of vegetation (Huete et al.2002). The NDVI is defined by the equation:
NDVI¼ρNIR ρred
ρNIRþρred; (1)
where ρNIR and ρredare the remote-sensing reflectance in near-infrared (NIR) and red portion of the spectrum, respectively. The red reflectance (615–700 nm) is reduced by the chlorophyll absorption and the NIR reflectance (772–892 nm) reaches a maximum for fully developed healthy canopies due to high light scattering. From these two spectral ranges, the activity of vegetation is evidenced.
Moreover, an index of open area (OAI) is used to detect open area based on the compar-ison between shortwave infrared (SWIR) (1600 nm) and NIR spectral band, which are sensitive
to barren land as well as liquid water thickness (Boschetti et al2014). Consequently, the OAI is proposed to detect forest cover change in this study. The OAI is defined by the equation:
OAI¼ρSWIR ρNIR ρSWIRþρNIR
; (2)
whereρSWIRandρNIRare the remote-sensing reflectance in SWIR and NIR portion of the spectrum, respectively.
Both spectral indices above were then clipped to cover Indonesia’s total land area and sequentially stacked to produce the NDVI and OAI time-series data sets. Accordingly, each land surface pixel can be characterized by regular NDVI and OAI values for 12 images per year. In this study, Landsat imagery is used to validate the results of forest cover change detection. The spatial resolution of 30 m is adequate to examine within cover changes and the scene extent is large enough to cover the changes detected on MODIS image pixels.
2.2. Filtering image in temporal domain
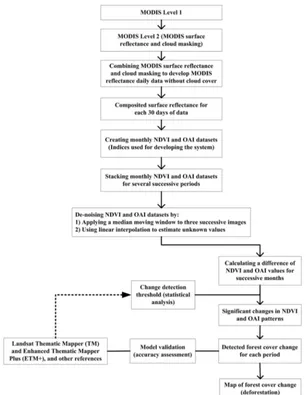
Thefirst step in data processing is dealing with the residual noises in the use of time-series MODIS data sets. We used the MODIS quality assurance data (cloud mask product) to remove the cloudy pixels of the MODIS surface reflectance and performed linear interpolation to estimate the unknown values caused by the cloud. Moreover, the MODIS surface reflectance is composited for 30 days in order to get a greater percentage of clear-sky data in the time-series MODIS data.Figure 1illustrates the process of MODIS data handling and analysis.
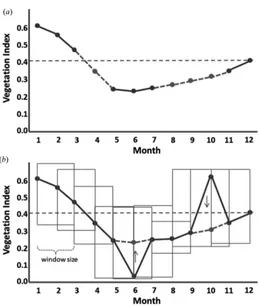
Twofiltering approaches were applied to two kinds of vegetation indices, NDVI and OAI by: (1) a linear interpolation to estimate unknown values caused by cloud. Linear interpola-tion is the simplest method for gapfilling of MODIS products (Borak and Jasinski2009) and (2) a median moving window over three images of the time series in order to smooth and reduce the discontinuities and sharp spikes in the time series of MODIS data (Soudani et al 2008). Both offiltering approach is illustrated byFigure 2. Once thesefiltering applied, the temporal vegetation pattern can be defined more clearly, and then applied as basic information of the near real-time detection system for forest cover change.
2.3. Pattern change detection
This study recognized the forest cover change using an image differencing method based on a pixel by pixel subtraction in MODIS image time-series. The technique detected a difference between two indices derived from reflectance values, NDVI and OAI. The difference of NDVI and OAI values is calculated from the data for successive months, by simple equations below:
for NDVI,
ΔNDVI¼NDVIi NDVIj (3)
and for OAI,
ΔOAI¼OAIi OAIj; (4)
wherei andjrepresent two successive months.
The difference of the NDVI and OAI values for the two successive months in the period was computed for all pixels. Change thresholds (TH) were selected corresponding to a range of the difference among NDVI and OAI values, which was used to define the probability level 320 Y. SETIAWAN ET AL.
of forest cover change. The change pattern threshold is determined through a comparison of accuracy for the three change thresholds; TH1 (OAI > 0.3 and NDVI <−0.1), TH2 (OAI > 0.3 and NDVI >−0.1) and TH3 (OAI < 0.3 and NDVI <−0.1). These value ranges above were selected as they produced appropriate estimates of monthly change values based on some selected sites, which are detected as a forest cover change by the approach used in the previous work (Setiawan, Yoshino, and Prasetyo2014).
In order to determine the threshold of forest cover change probability, some pixels of the change and no-change events were randomly selected corresponding to the range of three change thresholds. Determining the threshold as well as assessing the accuracy of the change detection approach was performed using the reference data set.
Figure 1.Data handling and data analysis of MODIS data sets.
2.4. Accuracy assessment
In this study, we performed an accuracy assessment by subpixel reference information in which the Landsat images were selected as the base data source.
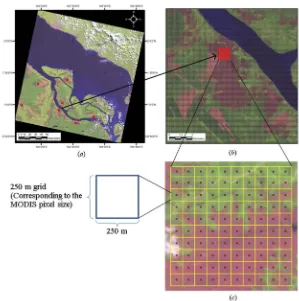
To capture the variability, the study area was stratified by landscape, and 25 locations were randomly selected corresponding to the range of three change thresholds. Each location was overlaid with a 250 m fishnet corresponding to the pixels of the MODIS data, then 10 by 10 cells were selected as our plot size (Figure 3). Each pixel was associated with a change or no-change event based on its location within the sets of the Landsat images. This procedure provided the percentage of each change or no-change event within the corresponding MODIS pixels; cells with over 70% of a single land use were taken to be homogeneous and used as a reference for accuracy assessment.
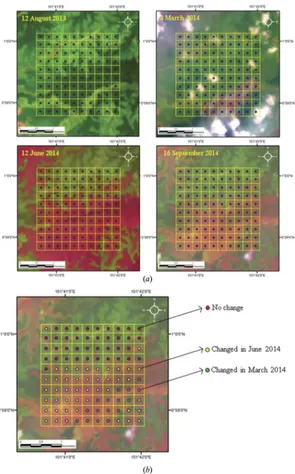
The final number of samples in the reference data was 1985 pixels. Each point has attributed with change and no-change information, and wherever possible, we provided more detail forest cover change information including time of the change, as illustrated inFigure 4.
Figure 2.Illustration offiltering procedure by: (a) a linear interpolation to estimate unknown values caused by cloud and (b) median moving window over time-series data sets.
322 Y. SETIAWAN ET AL.
3. Results and discussions
3.1. Probability of change pattern thresholds
The change pattern threshold is determined through a comparison of accuracy for the three change thresholds; TH1 (OAI > 0.3 and NDVI <−0.1), TH2 (OAI > 0.3 and NDVI >
−0.1) and TH3 (OAI < 0.3 and NDVI < −0.1). The change detection results by each threshold are shown in Table 1. Considering the results, the TH1 provided the best accuracy and then used as a threshold to detect the forest cover change in the near real-time deforestation detection system developed in this study.
3.2. Detection of forest cover change and accuracy assessment
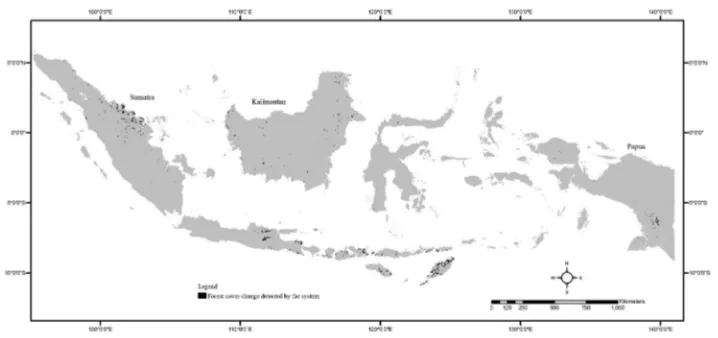
The results indicated forest cover change in 2014, which was detected by the near real-time detection system using TH1, is shown in Figure 5. Since the forest cover in Indonesia mostly exhibits no change, the user’s accuracy (measure of commission error) could be applicable to assess the accuracy of the approach.
The overall user’s accuracy was revealed to be approximately 90.07%, in other words, about 9.93% of the forest cover change was recognized incorrectly. The producer’s accuracy was revealed to be 65.03%, which means that 34.97% of the forest cover Figure 3.(a) Distribution of selected reference data sets in Riau, Indonesia, (b) a 250 m grid overlaid with Landsat imagery and (c) 100-point grid overlaid on Landsat imagery.
change area was not assigned to be a forest cover change by the system. This result showed the need to evaluate the threshold used to assign a change in forest cover.
Comparison of the accuracy in change detection among three forest types in Indonesia reveals a variation. Primary forest had the greatest overall accuracy (81.22%), followed by secondary forest (79.18%) and forest plantation (77.62%). The result Figure 4.(a) A 100-point grid overlaid on Landsat images from different dates and (b) the period of forest cover change identified from Landsat time-series images (different coloured dots indicate a different period of forest cover change).
324 Y. SETIAWAN ET AL.
indicates that the change in primary forest could be detected more accurately relative to secondary forest and forest plantation. In the primary forest, 12.44% of the errors are due to the omission errors, meaning that the change area in those classes was assigned incorrectly. Meanwhile, the greatest error of the approach was associated with forest plantation. Specifically, 22.18% of forest plantation was assigned to a change area; even when those areas had not actually changed. This is similar to Lunetta et al. (2006) that the land management practices (e.g., harvesting and tree planting) associated with the forest plantation represent the temporal complexity in the change detection method.
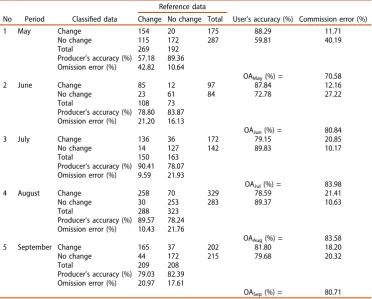
Additional analysis was conducted to better understand the forest cover change over term periods and its detection accuracies. Although the overall accuracies for long-term periods were consistently in the range of 70%–83%, the commission error of the change areas in each period reveals a difference (Table 2). The greatest errors were Table 1.Normalized error matrices for each threshold including significance probabilities.
Threshold Classified data
Reference data
Correct (%) Commission (%) Change (%) No change (%) Total (%)
TH1 Change (%) 23.60 5.90 29.50 80.00 20.00 No change (%) 11.11 59.39 70.50 90.90 9.10 Total (%) 34.71 65.29 100.00
Correct (%) 67.99 90.96 82.99a Omission (%) 32.01 9.04
TH2 Change (%) 22.93 6.90 29.83 76.87 23.13 No change (%) 12.57 57.60 70.17 90.90 9.10 Total (%) 35.50 64.50 100.00
Correct (%) 64.59 89.30 80.53 Omission (%) 35.41 10.70
TH3 Change (%) 18.50 10.82 29.32 63.10 36.90 No change (%) 11.20 59.48 70.68 90.90 9.10 Total (%) 29.70 70.30 100.00
Correct (%) 62.29 84.61 77.98 Omission (%) 37.71 15.39
a
Statistical significance compared to TH2 (p= 0.0227) and TH3 (p= 0.0025).
Figure 5.Distribution of forest cover change detected by the near real-time deforestation detection system using TH1. The areas in black are the areas of change.
associated with the change areas for the periods of July and August, which were 20.85% and 21.41%, respectively, and assigned incorrectly as a forest cover change.
4. Conclusion
Characterization of land surface in multiple periods leads to detect a forest cover change. This study attempted to detect the change of forest cover quickly, which can be reflected by the change in inter-monthly period of temporal land surface dynamics based on two spectral indices: NDVI and OAI.
Our results indicated that the use of MODIS data as a basic information in the near real-time system offers great promise to detect the forest cover change in Indonesia’s forest-land, with the overall user’s accuracy was revealed to be 90.07%. Considering the accuracy of the near real-time detection system, the methodology proposed in this study provides useful information for forest monitoring at national level of Indonesia, and it can be updated with new information in monthly basis. The results of the detection system developed in this article will be available publicly through the REDD+ situation room.
Acknowledgements
The authors would like to thank the Indonesian National Institute of Aeronautics and Space (LAPAN) for sharing MODIS data sets and Annisa Nurdiana (Center for Environmental Research/ Table 2.Performance of the change detection system by the TH1 in regard to its accuracy results in monthly basis.
No Period Classified data
Reference data
User’s accuracy (%) Commission error (%) Change No change Total
1 May Change 154 20 175 88.29 11.71
No change 115 172 287 59.81 40.19
Total 269 192
Producer’s accuracy (%) 57.18 89.36 Omission error (%) 42.82 10.64
OAMay(%) = 70.58
2 June Change 85 12 97 87.84 12.16
No change 23 61 84 72.78 27.22
Total 108 73
Producer’s accuracy (%) 78.80 83.87 Omission error (%) 21.20 16.13
OAJun(%) = 80.84
3 July Change 136 36 172 79.15 20.85
No change 14 127 142 89.83 10.17
Total 150 163
Producer’s accuracy (%) 90.41 78.07 Omission error (%) 9.59 21.93
OAJul(%) = 83.98
4 August Change 258 70 329 78.59 21.41
No change 30 253 283 89.37 10.63
Total 288 323
Producer’s accuracy (%) 89.57 78.24 Omission error (%) 10.43 21.76
OAAug(%) = 83.58
5 September Change 165 37 202 81.80 18.20
No change 44 172 215 79.68 20.32
Total 209 208
Producer’s accuracy (%) 79.03 82.39 Omission error (%) 20.97 17.61
OASep(%) = 80.71
OAiis an overall accuracy ofimonth. 326 Y. SETIAWAN ET AL.
PPLH IPB) in helping to gathering the secondary data in this research. Thanks to Irfansyah Lubis who caught misprint mistakes in the earlier manuscript. We would like to thank Yoshino Kunihiko (University of Tsukuba, Japan) for helpful comments on the manuscript.
Disclosure statement
No potential conflict of interest was reported by the authors.
Funding
This work was supported by the UNDP-REDD under Contract No. UNDP-REDD+/095/2014.
References
Borak, J. S., and M. F. Jasinski.2009.“Effective Interpolation of Incomplete Satellite-Derived Leaf-Area Index Time Series for the Continental United States.”Agricultural and Forest Meteorology
149: 320–332. doi:10.1016/j.agrformet.2008.08.017.
Boschetti, M., F. Nutini, G. Manfron, P. A. Brivio, and A. Nelson.2014.“Comparative Analysis of Normalised Difference Spectral Indices Derived from MODIS for Detecting Surface Water in Flooded Rice Cropping Systems.”PLoS ONE9: 1–21. doi:10.1371/journal.pone.0088741. Hammer, D., R. Kraft, and D. Wheeler, 2009, FORMA: Forest Monitoring for Action-Rapid
Identification of Pan-tropical Deforestation Using Moderate-Resolution Remotely Sensed Data. Center for Global Development Working Paper No. 192.
Huete, A. R., K. Didan, T. Miura, E. P. Rodriguez, X. Gao, and L. G. Ferreira.2002.“Overview of the Radiometric and Biophysical Performance of the MODIS Vegetation Indices.”Remote Sensing of
Environment83: 195–213. doi:10.1016/S0034-4257(02)00096-2.
Knight, J. F., R. S. Lunetta, J. Ediriwickrema, and S. Khorram. 2006.“Regional Scale Land Cover Characterization Using MODIS-NDVI 250 M Multi-Temporal Imagery: A Phenology-Based Approach.”GIScience & Remote Sensing43: 1–23. doi:10.2747/1548-1603.43.1.1.
Lunetta, R. S., J. F. Knight, J. Ediriwickrema, J. G. Lyon, and L. D. Worthy.2006.“Land-Cover Change Detection Using Multi-Temporal MODIS NDVI Data.”Remote Sensing of Environment105: 142– 154. doi:10.1016/j.rse.2006.06.018.
Ministry of Environment. 2010.Indonesia Second National Communication under the United Nations
Framework Convention on Climate Change. Republic of Indonesia: Deputy Minister for Nature
Conservation Enhancement and Environmental Degradation Control instead of Destruction, Ministry of Environment.
Pan, Y., R. A. Birdsey, J. Fang, R. Houghton, P. E. Kauppi, W. A. Kurz, O. L. Phillips, et al.2011.“A Large and Persistent Carbon Sink in the World’s Forests.”Science333: 988–993. doi:10.1126/science.1201609. Petus, C., M. Lewis, and D. White.2013.“Monitoring Temporal Dynamics of Great Artesian Basin Wetland Vegetation, Australia, Using MODIS NDVI.” Ecological Indicators 34: 41–52. doi:10.1016/j. ecolind.2013.04.009.
Setiawan, Y., K. Yoshino, and L. B. Prasetyo.2014.“Characterizing the Dynamics Change of Vegetation Cover on Tropical Forestlands Using 250 M Multi-Temporal MODIS EVI.”International Journal of
Applied Earth Observation and Geoinformation26: 132–144. doi:10.1016/j.jag.2013.06.008.
Shimabukuro, Y. E., V. Duarte, L. O. Anderson, D. M. Valeriano, E. Arai, R. M. De Freitas, B. F. T. Rudorff, and M. A. Moreira.2006.“Near Real Time Detection of Deforestation in the Brazilian Amazon Using MODIS Imagery.”Ambi-Agua1: 37–47. doi:10.4136/ambi-agua.4.
Soudani, K., G. le Maire, E. Dufrene, C. Francois, N. Delpierre, E. Ulrich, and S. Cecchini. 2008. “Evaluation of the Onset of Green-Up in Temperate Deciduous Broadleaf Forests Derived from Moderate Resolution Imaging Spectroradiometer (MODIS) Data.”Remote Sensing of Environment
112: 2643–2655. doi:10.1016/j.rse.2007.12.004.
Souza, C., S. Hayashi, and A. Veríssimo. 2009. Near Real-Time Deforestation Detection for
Enforcement of Forest Reserves in Mato Grosso. Brazil: Imazon.