Summary We investigated the extent of osmotic adjustment and changes in transpiration rate that occur in response to repeated cycles of water deficit stress in 6-year-old Thuja occidentalis L. (eastern white cedar) trees. Groups of trees were water-stress conditioned by repeated exposure to predeter-mined thresholds of nonlethal water stress by withholding water until the predawn water potential fell to −0.9 (mild conditioning) or −1.4 MPa (moderate conditioning).
Both the mild and moderate conditioning treatments re-sulted in a decrease in osmotic potential of 0.08 to 0.20 MPa and 0.11 to 0.28 MPa, respectively, relative to the well-watered controls. Mildly and moderately conditioned trees exhibited an approximately 35 and 50% reduction in cumulative transpira-tion, respectively, following at least two stress cycles. Transpi-ration rates of conditioned trees remained below those of the well-watered controls even when water potential integrals were similar. We conclude that the decrease in transpiration rate was more important than osmotic adjustment as a mecha-nism of response to repeated water stress.
Keywords: psychrometer, relative water content, transpiration, water potential integral.
Introduction
Thuja occidentalis L., commonly known as eastern white cedar, exhibits a broad tolerance to water availability. Natu-rally occurring stands of T. occidentalis are found in habitats ranging from dry, rocky upland sites to wet, swampy lowland sites. Early investigators (Habeck 1958, Musselman et al. 1975) attributed T. occidentalis’ broad range of tolerance to natural selection or ecotypic differentiation. However, Mat-thes-Sears and Larson (1990, 1991) could not detect any sig-nificant genotypic differences between T. occidentalis trees originating from wet and dry sites on the Niagara Escarpment, located in southern Ontario, and concluded that physiological (biotic variables) rather than genetic influences accounted for the species’ broad tolerance to water availability.
There is evidence that T. occidentalis exhibits osmotic ad-justment in response to water deficits (Collier and Boyer 1989). Osmotic adjustment (lowering of the osmotic potential caused by the net accumulation of solutes within the plant cells in response to water deficit) is a common response to water
deficits in some herbaceous and woody plant species (Hinck-ley et al. 1980, Turner and Jones 1980, Abrams 1988). How-ever, water stress can also be ameliorated by modification of stomatal functioning (Kramer 1983).
We have examined the extent of osmotic adjustment and changes in transpiration rate (inferring stomatal behavior) that occurred during exposure to repeated nonlethal water deficit stress by integrating continuous measurements of water poten-tial and transpiration, respectively (Myers 1988, Beeson 1992). Because preliminary work (Edwards 1993) indicated that changes in stomatal function may be induced by predawn water potentials slightly below −1.0 MPa, we chose to with-hold water from trees to predawn water potential threswith-holds of −0.9 and −1.4 MPa. Repeated nonlethal water deficit stress (also called conditioning) was the chosen method because it is representative of the drought pattern that occurs under field conditions (Parker and Pallardy 1988). Furthermore, condi-tioning improves plant tolerance to subsequent stress (Cle-mens and Jones 1978, Kramer 1983), although the physiological mechanisms involved are poorly understood (Buxton et al. 1985).
Materials and methods
In May 1992, 6-year-old Thuja occidentalis cv Emerald trees were obtained from Connon Nurseries, AVK Holdings, Rock-ton, Ontario. The trees had been clonally propagated by cut-tings taken from an array of stock plants also located at the nursery. Twenty trees were selected for uniformity and a basal stem diameter of ≥ 1 cm. The trees were potted in 6-l pots containing a 70/15/15 (v/v) mix of peat/perlite/vermiculite and placed in a controlled environment greenhouse compartment located at the Department of Horticultural Science, University of Guelph, Guelph, Ontario. The trees were arranged on two benches in a completely randomized design. Five trees were allocated to each of four treatment groups. Two groups were watered every 2 to 3 days and served as the well-watered controls, one group (mild conditioning treatment) was watered when the mean predawn water potential fell to −0.9 MPa, and one group (moderate conditioning treatment) was watered when the mean predawn water potential fell to −1.4 MPa. The two control groups were designated as a control for either the mild or moderate conditioning treatment. The control groups
Mechanisms of drought response in Thuja occidentalis L. I. Water
stress conditioning and osmotic adjustment
D. R. EDWARDS and M. A. DIXON
Department of Horticultural Science, University of Guelph, Guelph, Ontario, N1G 2W1, Canada
Received October 25, 1993
were treated identically except that they were sampled for leaf osmotic potential and relative water content at different times, corresponding to when the designated conditioning treatment was sampled.
The experiment began on August 7, 1993 (Day 220) when all trees were watered and fertilized and initial measurements of osmotic potential and relative water content taken. The trees in the conditioning treatments were not watered again until their mean predawn water potentials fell to their assigned threshold values (−0.90 or −1.4 MPa). Each time the water stress thresholds were reached, the stress cycle was ended by watering the treated trees and the corresponding control trees at 1800 h. This procedure was repeated five times for mildly conditioned trees (average duration of 6.4 days) and four times for moderately conditioned trees (average duration 9 days). Trees were fertilized after every other stress cycle. No nutri-tional or pest problems were detected.
To minimize evaporation of water from the rooting medium, the top of each pot was covered with two layers of white plastic film. The watering procedure entailed placing the potted trees in large shallow flats (0.25 × 0.50 × 0.065 m deep) filled with either deionized water or nutrient solution (250 ppm of 20-20-20 N,P,K). The liquid was replenished as required. After 2 h, 1 liter of water was added to each flat. This procedure insured a thorough rehydration of the potting medium. Finally, the trees were removed from the flats of water and allowed to drain for 30 min, and then weighed.
Total water potential
In situ stem psychrometers (PWS Instruments Inc., Guelph, Ontario) were installed on all trees to measure total stem water potential at 15-min intervals. Psychrometers were installed approximately 10 cm above the root--shoot junction and below all foliage (Dixon and Tyree 1984). Water potential integrals (WPI, MPa h) were calculated (WPI = water potential (MPa) × 0.25 (h)) and summed for a day (0 to 24 h) or stress cycle. Automated psychrometer measurements of predawn water po-tential (Ψpd) were periodically confirmed with a pressure
chamber (Soilmoisture Equipment Corporation, Santa Bar-bara, California). In most cases the psychrometer measure-ments were within 0.1 MPa of the pressure chamber measurements.
Osmotic potential and relative water content
At the end of each stress cycle, leaf samples were excised at 2000 h and again 40 h later for the determination of osmotic potential and relative water content. Leaf samples were an aggregate of previously and newly expanded tissue (scales).
Osmotic potential at full turgor was measured using the in situ stem psychrometers in calibration mode. Midway through the watering procedure, three samples of leaf tissue were excised per tree, weighed and rehydrated in distilled water for approximately 12 h at 8--10 °C. Twelve hours were determined to be sufficient time to rehydrate without over-saturating the tissue, based on the evaluation of a time--weight increase curve (data not shown). After rehydration, the samples were weighed, placed in aluminum foil envelopes and then plunged
into liquid nitrogen. The samples were stored in a freezer for later determination of osmotic potential. The samples in the foil envelopes were thawed for about 20 min and then squashed in a 5-ml syringe until a few drops of the sap could be placed on a filter paper disk (SS-033 sample discs, Wescor, Logan, Utah) and sealed in the calibration disk holder of a psychrome-ter. Osmotic potential was measured at 25 °C using a CR7X Datalogger (Campbell Scientific, Edmonton, Alberta) to oper-ate the psychrometers. Because we were only interested in differences among treatments, we accepted the systematic errors in the absolute values of osmotic potential at full turgor resulting from over-estimation due to dilution of symplastic water by apoplastic leaf water. We also ignored potential vari-ations in apoplastic water content among samples; however, the significance of this factor was minimized by the short duration of the experiments and the moderate extent of the water stress conditioning applied. Osmotic potential (OP) data were expressed as the difference in OP (OPD) between treated and control trees.
Relative water content (RWC) was measured on the same leaf tissue as osmotic potential and determined as:
RWC = (FW − DW)/(SW − DW).
The fresh weight (FW) of the tissue (1 mg) was determined shortly after it was excised from the tree. The saturated weight (SW) was determined after rehydration for 12 h and the dry weight (DW) of the tissue was determined after oven drying at 70 °C for at least 48 h.
Gravimetric determination of transpiration
Transpiration rates were determined by weighing the potted trees. Three trees from each group were placed on balances (Sartorius LC12000 P, Goettingen, Germany), which were interfaced with a computer equipped with multiple serial ports, and their weight loss was automatically recorded every 15 min for the entire experiment. The remaining two trees in each group were weighed once daily.
Transpiration was expressed as grams of water used per gram of leaf dry weight. Leaf dry weight was determined at the end of the study by excising all green leaves and determining oven dry weight after 48 h at 70 °C. Transpiration for a stress cycle was calculated by subtracting the weight at the end of a stress cycle (at 1800 h) from the free-drainage weight deter-mined at the beginning of that stress cycle. Daily transpiration was calculated by determining the amount of water transpired per hour and summing these values for a day.
Environmental conditions
Ont.) to extend the day length to 18 h or when the natural light fell below 300 µmol m−2 s−1.
Data analysis
Statistical analysis was carried out with SAS statistical soft-ware (Cary, North Carolina). Multiple mean comparison tests were used to test for significance when the sampling dates of treatment groups coincided. Protected LSD (least significant differences) tests was used for OPD, RWC, daily transpiration and WPI when sampling times of all groups coincided. Paired t-tests were used for OPD and RWC when sampling times of two groups coincided.
Results
Indicators of water stress conditioning
The mean water potentials exhibited by well-watered control trees and conditioned trees during a typical stress cycle are shown in Figures 1A and 1B. These data display the diurnal fluctuations in water stress conditioning, the overnight recov-ery from the previous stress cycle and the threshold predawn water potential (Ψpd) used to determine the termination of that
stress cycle. The average Ψpd thresholds for mildly and
moder-ately conditioned trees for all stress cycles were −0.95 ± 0.11 and −1.45 ± 0.13 MPa, respectively. The mean Ψpd of the two
control groups was typically −0.35 to −0.45 MPa.
The mean WPIs exhibited by the mildly and moderately conditioned trees were −127.0 ± 6.5 and −201.6 ± 8.2 MPa h per stress cycle, respectively. The average WPI values of the well-watered controls for the mild and moderate conditioning treatments were −80.5 ± 2.2 and −107.5 ± 3.6 MPa h per stress cycle, respectively.
Osmotic adjustment and leaf RWC
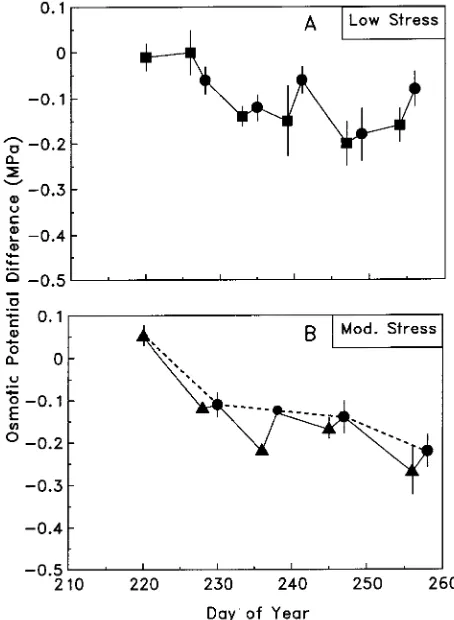
Before exposure to water stress conditioning, there were no differences in osmotic potential among the four groups of trees (OP was −1.10 to −1.36 MPa). Conditioned trees exhibited significant osmotic adjustment for most sampling dates (P < 0.05) (OP ranged from −1.25 to −1.63 MPa) (Figures 2A and 2B). The exceptions were mildly conditioned trees on Days 226 and 239 (Figure 2A). The OPD decreased after the first stress cycle in both conditioning treatments and then stabilized
Figure 1. Mean (n = 5) continuous water potentials of conditioned (solid) and control (dashed) trees during a typical stress cycle: (A) mild water stress and (B) moderate water stress. The arrow indicates the point at which the threshold predawn water potential was reached. Irrigation was applied at 1800 h on the day the threshold was reached.
between −0.15 and −0.2 MPa for the subsequent three or four stress cycles (Figures 2A and 2B). There was a slight rise in OP following rewatering at the end of each stress cycle (Fig-ures 2A and 2B). The correlation between OPD and WPI indicated that the moderate conditioning treatment did not cause a proportionally greater degree of osmotic adjustment than the mild conditioning treatment (data not shown).
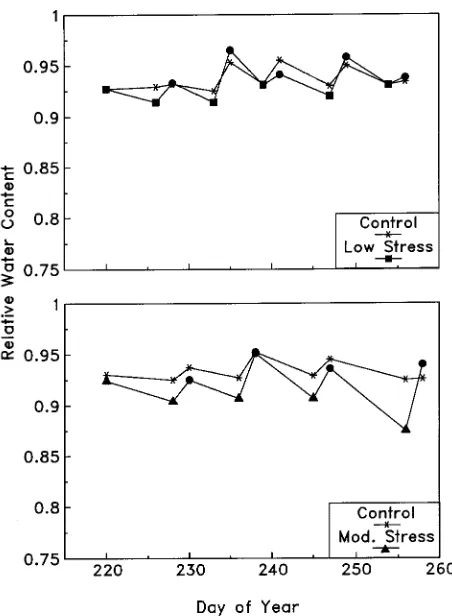
The largest changes in leaf RWC occurred in response to the first stress cycle (Figure 3A). There was a 1.41 and 2.16% drop for mildly and moderately conditioned trees, respectively. Thereafter, leaf RWC of trees in both conditioning treatments did not change appreciably. After 40 h of stress relief, leaf RWC of conditioned trees was similar to that of well-watered control trees (Figure 3B).
Transpiration
Transpiration was reduced by water stress conditioning. Mildly and moderately conditioned trees exhibited reductions in cumulative transpiration of approximately 35 and 50%, respectively, following at least two stress cycles. The average transpiration rates per stress cycle were 11.3 ± 2.3 and 16.5 ±
0.7 g g−1 cycle−1 for mildly conditioned trees and their control group, respectively. The corresponding rates for moderately conditioned trees and their control group were 11.7 ± 0.2 and 22.7 ± 1.3 g g−1 cycle−1, respectively.
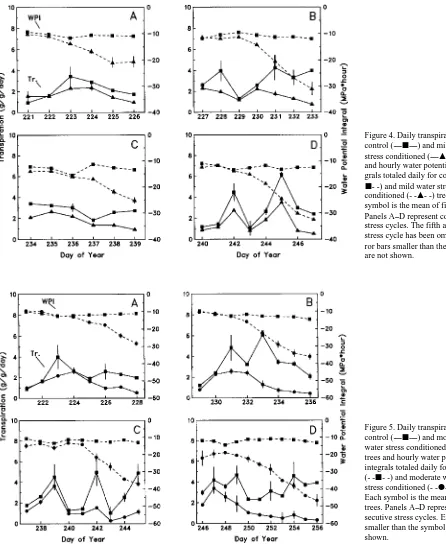
We examined the relationship between transpiration and water stress conditioning by comparing daily transpiration and daily WPI (cf. Figures 4 and 5). During the first stress cycle, daily transpiration rates of the conditioned trees gradually became less than those of their respective controls as water stress conditioning increased. The extent of the reduction in transpiration rates increased with successive cycles of water stress conditioning. For the second and subsequent stress cy-cles, transpiration rates of the conditioned trees were lower than those of the well-watered controls, even at the beginning of a stress cycle when WPIs were similar in the four groups of trees.
Discussion Osmotic adjustment
Thuja occidentalis exhibited a range of osmotic adjustment from −0.08 to −0.28 MPa. These responses were modest com-pared to the values of −0.25 to −0.67 MPa observed in mature T. occidentalis trees (Collier and Boyer 1989). The degree of osmotic adjustment was also less than that reported for other conifers (−0.45 MPa for Pinus taeda L., Seiler and Johnson 1985; −0.46 MPa for Picea glauca (Moench) Voss., Buxton et al. 1985).
After 40 h of stress relief, the osmotic potential of the conditioned trees was lower than that of the control trees, but there were often minimal or no differences in leaf RWC (Fig-ures 3A and 3B). According to Lecoeur et al. (1992), reduced osmotic potential in conjunction with recovered leaf RWC is evidence of a net increase in solutes rather than a passive concentration of solutes resulting from the reduction of sym-plastic water. Thus, we conclude that the changes we observed were attributable to active solute accumulation rather than passive concentration of solutes.
Water stress conditioning and osmotic adjustment
The finding that mildly and moderately conditioned trees gen-erally exhibited similar osmotic potentials does not support the contention that the extent of osmotic adjustment increases with increasing water stress conditioning (Turner and Jones 1980, Morgan 1984). Although this phenomenon has been observed in conifers such as Picea mariana (Mill.) BSP. in response to polyethylene-glycol-induced stress (Tan et al. 1992), Buxton et al. (1985) reported that the osmotic potentials of P. mariana, P. glauca and Pinus banksiana Lamb. were not significantly affected by exposure to PEG solutions lower than −0.4 MPa.
Parker and Pallardy (1988) recognized that the rate of soil drying in pots can be too fast for maximum osmotic adjustment to occur; therefore, they repeatedly exposed Quercus spp. trees to a number of cycles of water stress. They presumed that the additive effect of the stress cycles was caused by the solutes not completely dissipating immediately after watering (Mor-gan 1984). In T. occidentalis, most osmotic adjustment
curred in response to the first cycle of water stress conditioning and the additional stress cycles had little effect on osmotic adjustment (Figures 2A and 2B).
Water stress conditioning and transpiration rate
We observed that the transpiration rate decreased with succes-sive cycles of nonlethal water stress (Figures 4 and 5). Several investigators have reported modified stomatal behavior in con-ditioned plants (Rook 1973, Buxton et al. 1985, Seiler and
Johnson 1985, 1988, Eakes et al. 1991). Eakes et al. (1991) with Salvia splendens F. Sellow and Rook (1973) with Pinus radiata D. Don. concluded that conditioned plants only par-tially opened their stomata and therefore used less water and developed smaller water deficits than unconditioned plants. Bongarten and Teskey (1986) and Teskey et al. (1987) found that leaf conductance of conditioned P. taeda was significantly less than that of nonstressed controls when tested under well-watered conditions and suggested that conditioning modified
Figure 4. Daily transpiration for control (----j----) and mild water
stress conditioned (----m----) trees
and hourly water potential integrals totaled daily for control (
-j- -) and mild water stress
conditioned (- -m- -) trees. Each symbol is the mean of five trees. Panels A--D represent consecutive stress cycles. The fifth and final stress cycle has been omitted. Er-ror bars smaller than the symbol are not shown.
Figure 5. Daily transpiration for control (----j----) and moderate water stress conditioned (----d----) trees and hourly water potential integrals totaled daily for control (- -j- -) and moderate water stress conditioned (- -d- -) trees.
either the number of stomata or their function.
Transpiration was depressed in all of the conditioned trees, indicating that the stomata of T. occidentalis were sensitive to water stress conditioning and that closure or partial closure of the stomata occurred even in the mildly conditioned trees (Ψpd
= −0.9 MPa). Several studies have reported that stomatal functioning is disrupted by mild water deficits. For example, Ranney et al. (1991) found that mild water deficit stress (Ψpd
= −0.35 MPa) caused reductions in stomatal conductance in some Betula species. Buxton et al. (1985) found an approxi-mate halving of the transpiration rates of P. mariana and P. glauca in response to mild water deficit stress (PEG 8000, water potential = −0.4 MPa).
Our data indicate that T. occidentalis has a very sensitive stomatal mechanism; however, previous work does not support this contention. Matthes-Sears and Larson (1990) found that diurnal patterns of stomatal conductance (0 to 10 mmol m−2 s−1) were similar in hydrated (Ψpd = −0.2 MPa) and mildly
stressed (Ψpd = −0.9 MPa) trees growing in sites of limiting and
nonlimiting soil water in southern Ontario. Conflicting data on stomatal functioning within a species are not surprising be-cause stomatal closure is believed to be affected by plant age, stress history, rate of stress development, number of stress cycles and growth conditions (Beadle et al. 1978, Melzack et al. 1985).
Plant resistance to water flow
Transpiration was reduced by water-stress conditioning even when the stem water potentials of the conditioned and well-watered control trees were similar (e.g., during the first day or two of the stress cycles, Figures 4 and 5). Because the driving forces for water flow in the soil--plant--atmosphere continuum (i.e., water potential gradient and environmental conditions of humidity and temperature) were comparable among the treat-ments and controls during this period, variations in resistance must account for the differences in transpiration (Kramer 1983, Nobel 1992). These include (1) resistance between the root medium and the root surface, (2) plant hydraulic resis-tance, and (3) stomatal resistance. The first can be discounted because both conditioned and well-watered control trees had similar stem water potentials indicating that the amount of water entering the trees was similar. Variations in hydraulic resistance between conditioned and control trees could have been caused by cavitation (Tyree and Dixon 1986); however, this possibility seems unlikely because T. occidentalis can maintain over 95% of its initial conductance at water potentials down to −1.0 MPa and over 50% down to −4.0 MPa (Tyree and Dixon 1986). We conclude, therefore, that stomatal resistance is the variable that responds to nonlethal water stress condi-tioning.
Conclusions
Thuja occidentalis responded to repeated nonlethal water stress conditioning by exhibiting a small degree of osmotic adjustment. This helped maintain turgor and cell volume over a limited range of water status. When water stress conditioning
proceeded beyond this limited range, stomatal closure became the chief mechanism for conserving water. The effect of water stress on the mechanisms controlling stomatal aperture persist-ed during recovery from water stress conditioning. These find-ings confirm those of Munns (1988) who reported that species exhibiting reduced transpiration rates in response to drought show little capacity to adjust osmotically. The implication is that the plant makes full use of water when it is abundant, but forestalls significant drought injury by coupling a sensitive stomatal response to water stress with a high cuticular resis-tance to water loss. Although extended stomatal closure in response to water stress limits net carbon gain, the persistence on xeric sites of plants displaying this behavior testifies to the effectiveness of the strategy.
Acknowledgments
The authors gratefully acknowledge the technical assistance of Mr. Jamie Lawson and funding from the Natural Sciences and Engi-neering Research Council of Canada.
References
Abrams, M.D. 1988. Sources of variation in osmotic potentials with special reference to North American tree species. For. Sci. 34:1030--1046.
Beadle, C.L., N.C. Turner and P.G. Jarvis. 1978. Critical water poten-tial for stomatal closure in Sitka spruce. Physiol. Plant. 43:160--165. Beeson, R.C. 1992. Restricting overhead irrigation to dawn limits growth in container-grown woody ornamentals. HortScience 27:996--999.
Bongarten, B.C. and R.O. Teskey, 1986. Water relations of loblolly pine seedlings from diverse geographic origins. Tree Physiol. 1:265--276.
Buxton, G.F., D.R. Cyr, E.B. Dumbroff and D.P. Webb. 1985. Physi-ological responses of three northern conifers to rapid and slow induction of moisture stress. Can. J. Bot. 63:1171--1176.
Clemens, J. and P.G. Jones. 1978. Modification of drought resistance by water stress conditioning in Acacia and Eucalyptus. J. Exp. Bot. 29:895--904.
Collier, D.E. and M.G. Boyer. 1989. The water relations of Thuja
occidentalis L. from two sites of contrasting moisture availability.
Bot. Gaz. 150:445--448.
Dixon, M.A. and M.T. Tyree. 1984. A new stem hygrometer, corrected for temperature gradients and calibrated against the pressure bomb. Plant Cell Environ. 7:693--697.
Eakes, D.J., R.D. Wright and J.R. Seiler. 1991. Moisture stress condi-tioning effects of Salvia splendens ‘Bonfire’. J. Am. Soc. Hortic. Sci. 116:716--719.
Edwards, D.R. 1993. The water relations of Thuja occidentalis L. in response to repeated water stress conditioning. M.Sc. Thesis. Uni-versity of Guelph, Guelph, Ontario, Canada, 167 p.
Habeck, J.R. 1958. White cedar ecotypes in Wisconsin. Ecology 39:457--463.
Hinckley, T.M., F. Duhme, A.R. Hinckley and H. Richter. 1980. Water relations of drought hardy shrubs: osmotic potential and stomatal reactivity. Plant Cell Environ. 3:131--140.
Kramer, P.J. 1983. Water relations of plants. Academic Press Inc., New York, 489 p.
Lecoeur, J., J. Wery and O. Turc. 1992. Osmotic adjustment as a mechanism of dehydration postponement in chickpea (Cicer
Matthes-Sears, U. and D.W. Larson. 1990. Environmental controls of carbon uptake in two woody species with contrasting distributions at the edge of cliffs. Can. J. Bot. 68:2371--2380.
Matthes-Sears, U. and D.W. Larson. 1991. Growth and physiology of
Thuja occidentalis L. from cliffs and swamps: is variation habitat or
site specific? Bot. Gaz. 152:500--508.
Melzack, R.N., B. Bravdo and J. Riov. 1985. The effect of water stress on photosynthesis and related parameters in Pinus halepensis. Physiol. Plant. 64:295--300.
Morgan, J.M. 1984. Osmoregulation and water stress in higher plants. Annu. Rev. Plant Physiol. 35:299--319.
Munns, R. 1988. Why measure osmotic adjustment? Aust. J. Plant Physiol. 15:717--726.
Musselman, R.C., D.T. Lester and M.S. Abrams. 1975. Localized ecotypes of Thuja occidentalis L. in Wisconsin. Ecology 56: 647--655.
Myers, B.J. 1988. Water stress integral----a link between short-term stress and long-term growth. Tree Physiol. 4:315--323.
Nobel, P.S. 1992. Physicochemical and environmental plant physiol-ogy. Academic Press Inc., Toronto, 635 p.
Parker, W.C. and S.G. Pallardy. 1988. Leaf and root osmotic adjust-ment in drought-stressed Quercus alba, Q. macrocarpa and Q.
stel-lata seedlings. Can. J. For. Res. 18:1--5.
Ranney, T.G., R.E. Bir and W.A. Skroch. 1991. Comparative drought resistance among six species of birch (Betula): influence of mild water stress on water relations and leaf gas exchange. Tree Physiol. 8:351--60.
Rook, D.A. 1973. Conditioning Radiata pine seedlings to transplant-ing by restricted watertransplant-ing. N.Z. J. For. Sci. 3:54--69.
Seiler, J.R. and J.D. Johnson. 1985. Photosynthesis and transpiration of loblolly pine seedlings as influenced by moisture-stress condi-tioning. For. Sci. 31:742--749.
Seiler, J.R. and J.D. Johnson. 1988. Physiological and morphological responses of three half-sib families of loblolly pine to water-stress conditioning. For. Sci. 34:487--495.
Tan, W., T.J. Blake and T.J.B. Boyle. 1992. Drought tolerance in faster-and slower-growing black spruce (Picea mariana) progenies: II. Osmotic adjustment and changes of soluble carbohydrates and amino acids under osmotic stress. Physiol. Plant. 85:645--651. Teskey, R.O., B.C. Bongarten, B.M. Cregg, P.M. Dougherty and T.C.
Hennessey. 1987. Physiology and genetics of tree growth response to moisture and temperature stress: an examination of the charac-teristics of loblolly pine (Pinus taeda L.). Tree Physiol. 3:41--61. Turner, N.C. and M.M. Jones. 1980. Turgor maintenance by osmotic
adjustment: a review and evaluation. In Adaptation of Plants to Water and High Temperature Stress. Eds. N.C. Turner and P.J. Kramer. Wiley-Inter-Science, New York, pp 87--103.