Implications of an EU Eastern Enlargement
Under a New Common Agricultural Policy
Claudia A. Herok and Hermann Lotze,Department of
Agricultural Economics and Social Sciences, Humboldt University of Berlin
In preparing for an Eastern enlargement it is almost certain that the EU has to modify the Common Agricultural Policy (CAP). Four scenarios for an Eastern enlargement in 2005 under a simplified CAP are analyzed within a multiregion CGE model. Two possible development paths up to the date of enlargement are taken into consideration. Under a partial liberalization of the CAP, agricultural output and domestic welfare in CEEC rise after EU integration, but it is questionable whether the new members would still comply with their WTO bindings. Under a complete liberalization of the CAP, agricultural output in CEEC declines after EU integration. EU expenditures on agricultural policy are heavily reduced, which would provide room for more general structural aid for the new mem-bers. 2000 Society for Policy Modeling. Published by Elsevier Science Inc.
Key Words: EU eastern enlargement; Common agricultural policy; CGE model; Global trade analysis project (GTAP).
1. INTRODUCTION
The integration of several Central and East European countries (CEEC) will probably be one of the biggest challenges for the European Union (EU) in the near future. In contrast to earlier enlargement rounds, there are not only considerable differences between the EU-15 and potential new members in terms of eco-nomic development, but also with respect to the political environ-ment in the transition process. While 10 CEEC have formally applied for membership, the EU recently announced five of them as being the first candidates for integration, i.e., Estonia, Czech Republic, Hungary, Poland, and Slovenia.
Address correspondence to Dr. Hermann Lotze, Department of Agriculture Economics and Social Sciences, Humboldt University of Berlin, Luisenstr. 56, D-10099 Berlin, Germany.
Received August 1997; final draft accepted June 1999.
Journal of Policy Modeling22(6):661–690 (2000)
662 C. A. Herok and H. Lotze
For several reasons the agriculture and food sector could be-come a major stumbling block on the way towards an enlarged EU. The potential new members have a higher share of agriculture in GDP, a much higher proportion of agricultural labor force, and household expenditures on food that are considerably above EU levels (OECD, 1996; World Bank, 1996). Hence, protection mea-sures and transfers under the Common Agricultural Policy (CAP) will have an important impact on the new members during the process of enlargement.
There is almost no doubt that the CAP will have to change prior to the integration of any CEEC. The pressure for change is already indicated by the EU Commission in the “Agenda 2000” (European Commission, 1997a). As a consequence of the GATT Uruguay Round, the EU faces constraints on the level of agricul-tural border protection. Depending on the level of world market prices in the near future, upper limits for subsidized exports and the total amount of export subsidies could become binding and force the EU to cut down overall production in grains, sugar, beef, and dairy products (European Commission, 1997a, p. 29). So-called “blue box” measures under the WTO, for example, product-related compensation payments that were introduced in the 1992 CAP reform, will also be challenged in the upcoming WTO round (USDA, 1997a).
IMPLICATIONS OF AN EU EASTERN ENLARGEMENT 663
without major changes to the CAP, their WTO obligations would certainly be violated (Twesten, 1997).
Finally, the discussion about financing the CAP in general is another crucial issue. It can be assumed that the CEEC will be net recipients with respect to the EU budget, at least in the first years of membership. Hence, the financial impact of a potential enlargement will become a crucial issue during the upcoming negotiations. Already now the EU agricultural guideline sets a limit to the agricultural budget, as expenditures must not increase by more than 74 percent of the growth rate of GDP (Tangermann, 1997, p. 14). It is unlikely that the EU will raise this rate in the near future.
There is a broad discussion and a variety of proposals for further developing the CAP. In the “Agenda 2000” the EU Commission recently proposed intervention price cuts for grains, milk, and beef combined with per-animal compensation payments, an exten-sion of the milk quota until 2006, and set-aside rates fixed at zero percent. Uniform per-hectare payments for grains, oilseeds, and voluntary set-aside will be provided. Going much beyond this, several agricultural economists suggested further decoupling of agricultural income support from production including the intro-duction of direct factor subsidies (Kirschke et al., 1997, 1998; Wiss. Beirat, 1997). The debate over changes in EU agricultural policy makes the CAP a “moving target” for the new members and difficult to adjust their own policies towards the CAP in prepara-tion of joining the EU.
Several studies have been conducted analyzing a potential EU Eastern enlargement in a partial equilibrium framework (e.g., Tangermann, Josling, and Mu¨nch, 1994; Anderson and Tyers, 1995; European Commission, 1995; Mahe´ et al., 1995). While par-tial equilibrium models are usually quite detailed in the commodity disaggregation, they do not account for linkages to other sectors of the economy through factor markets and intermediate input use.1In the case of the CEEC, where agriculture has a significant share in GDP and trade, this becomes even more important. In this paper the EU enlargement is analyzed using a multiregional CGE model that was developed by the Global Trade Analysis
664 C. A. Herok and H. Lotze
Project (GTAP). The GTAP model and the database have been used for this purpose in other studies (Baldwin and Francois, 1996; Brockmeier, et al., 1996; Frandsen, Bach, and Stephensen, 1996; Hertel, Masters, and Gehlher, 1997; Swaminathan, 1997). This paper adds to these studies a different set of policy options under the CAP and an explicit modeling of the development path up the point of enlargement. Different scenarios for the integration of Central European countries into the EU are analyzed with a uniform payment on agricultural land as the major policy instru-ment under a modified CAP. In addition to various policy options, two possible growth scenarios up to the date of enlargement are taken into consideration.
In the next section the policy scenarios are described in detail followed by the model description and empirical implementation. Selected simulation results are provided in Section 4 covering growth in output and trade as well as changes in domestic prices and factor use after EU enlargement. Trade creation and trade diversion effects of the enlargement are discussed, and some bud-getary consequences are provided. The paper concludes with a summary and outlook regarding further modeling options.
2. POLICY SCENARIOS FOR EU ENLARGEMENT
In modeling a potential Eastern enlargement of the EU with a focus on agriculture and food, we have to answer the following questions: 1) Which of the CEE countries will be the first new members of the EU? 2) Will there be any changes to the CAP prior to enlargement, and will all policy measures be fully extended to the new members? 3) When will the enlargement actually occur and how will the model regions develop up to this point?
Although the EU recently announced the first five candidates for enlargement negotiations, in this paper we analyze a simultane-ous integration of a group of seven countries from Central Europe, i.e., Bulgaria, Czech Republic, Hungary, Poland, Romania, Slo-vakia, and Slovenia, which will be called “CEEC-7.” The reason for choosing this group is mainly technical, due to the regional disaggregation of the model database.
IMPLICATIONS OF AN EU EASTERN ENLARGEMENT 665
of the EU-15, and any new member country will have free access to agricultural markets and policies within the EU (Tangermann, 1997, p. 14). From the various proposals for further CAP reform (see Kirschke et al., 1997, for an overview) in this paper a uniform subsidy on agricultural land is chosen as the main policy instrument under a modified CAP. This was also considered as an important option in recent studies in the context of German agriculture (Kirschke et al., 1997, 1998; Wiss. Beirat, 1997). Land subsidies may not only be seen as a means of income compensation due to price liberalization, they also could be easily linked to achievement of certain environmental standards. In modeling the EU enlarge-ment we assume a complete and immediate transfer of all agricul-tural policy measures into the CEEC-7.2
Policy options covered in this paper comprise partial as well as complete liberalization of the CAP. Partial liberalization includes the abolishment of animal payments and compensation payments for crops as well as the compulsory set-aside program. Border protection for sugar, milk, and beef is reduced by 10 percent. Production quotas and other market regulations remain in place. With respect to changes in border protection, this scenario is similar to the “Agenda 2000,” as mentioned above. However, a uniform land subsidy is substituted for the variety of direct pay-ments for crops and livestock in the “Agenda.” It can be assumed, as a side effect, that this will also lead to lower administrative costs. The scenario of complete liberalization implies the abolishment of all border protection measures in agriculture and food, no quota restriction for milk and sugar, as well as the removal of all product-related compensation payments. In addition, the same uniform land subsidy is introduced.
With respect to the third question, the actual date of enlarge-ment, we assume that the integration of the CEEC-7 will occur at once in the year 2005. To come up with realistic reference scenarios for the actual enlargement we chose to update the model database prior to integration of the CEEC-7 into the EU-15. However, the general economic development until 2005 is difficult to forecast, especially in the Eastern European transition coun-tries. Slovenia or Poland lately achieved economic growth rates
666 C. A. Herok and H. Lotze
Table 1: Possible Scenarios for an EU Integration of the CEEC-7 in 2005
EU agricultural policy
Growth in CEEC-7 Partial liberalization Complete liberalization
Slow plib s lib s
Fast plib f lib f
at 4–7 percent p.a. (Ryan and Jones, 1997), but it is questionable whether they can sustain this development in the near future. Another question is whether other new members like Bulgaria and Romania will be able to catch up in the process of economic and political transition.
Taking these uncertainties into account, we construct four counterfactual reference situations for the actual enlargement in 2005 that differ with respect to economic growth in the CEEC-7 and further reform of the CAP in the EU-15. For the CEEC-7 we assume (1) a moderate growth rate of GDP close to projections for the EU-15, and (2) a faster growth rate more in line with experiences from the “tiger economies” in South East Asia. Ex-pected growth rates for other regions in the model are the same throughout the scenarios. Table 1 provides an overview of the enlargement scenarios covered in this paper.
3. IMPLEMENTATION OF THE SCENARIOS
3A. Model Structure and Aggregation
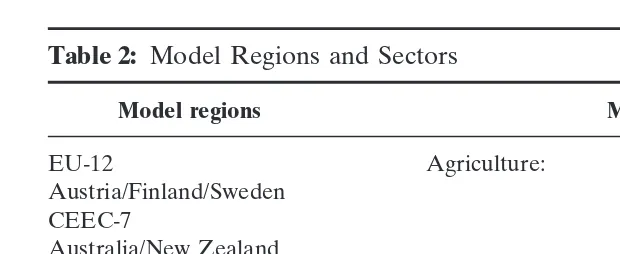
A multiregion CGE model seems appropriate for the analyses in this paper. It does not only cover the agriculture and food sector, but traces the links to other sectors of the economy includ-ing effects on international trade. The GTAP model provides a flexible structure for CGE analysis of problems in international trade. From the data base a maximum of 32 regions and 37 com-modities can be aggregated according to the problem at hand.3
IMPLICATIONS OF AN EU EASTERN ENLARGEMENT 667
Table 2: Model Regions and Sectors
Model regions Model sectors
EU-12 Agriculture: Wheat (wht)
Austria/Finland/Sweden Other grains (gro)
CEEC-7 Nongrain crops (ngc)
Australia/New Zealand Livestock products (olp)
Canada Food industry: Meat products (met)
USA Milk products (mil)
Japan Other food products (ofp)
Former Soviet Union (FSU) Other sectors: Primary products2(opp)
Asia Manufactures (mnfcs)
“Rest of the World”1 Services (svces)
1Mainly Latin America and Africa. 2Mainly forestry, fishery, mining and energy.
The model aggregation used here covers 10 regions with 10 sectors (see Table 2). Each sector only produces one output.
On the production side of all sectors the model has a so-called “nested structure.” Land, labor, and capital as the primary factors of production are combined to a primary aggregate input using a constant elasticity of substitution (CES) function. The same applies to domestic and imported intermediate inputs that are combined to an intermediate aggregate input. The two aggregates then contribute to final output via a Leontief function. In the standard model capital and labor are perfectly mobile between sectors, but the total endowment with these factors within a region is fixed.
Land is only used in primary agriculture and in the other primary products (opp) sector, while mobility of land between these sectors is limited by an elasticity of transformation. Private demand is modeled by a Constant Difference in Elasticities (CDE) function, which is more flexible than the CES function and allows for differ-ences in price and income responsiveness of demand in different regions depending on the level of development and consumption patterns (Hertel, 1997, p. 26).
668 C. A. Herok and H. Lotze
between two regions can always go in either direction at the same time and there is no net trade flow. The Armington assumption fits nicely with regularly observed discrepancies between “world market prices” for the same commodity at different locations. The change in world market prices in GTAP is calculated as a weighted average price index using bilateral trade flows as weights. How-ever, the Armington assumption has also been criticized by many authors, as it is not very flexible and does not endogenize aspects of imperfect competition and industrial organization into interna-tional trade. But it still seems to be a reasonable compromise, as detailed information on the competitive situation for various sectors is currently not available on a global basis (see Hertel, 1997, pp. 21–22). The macroeconomic closure of the model is accomplished by a “global bank,” which assures an equilibrium of savings and investments between the model regions. In the standard closure used here the regional share in global investment is fixed. This closure rule is basically neoclassical, but it allows for some adjustment in the mix of investment on a regional level (Hertel, 1997, pp. 28–30). The model is solved using the GEM-PACK software package (Harrison and Pearson, 1996).
The GTAP project has developed a comprehensive database using information from numerous international sources (McDou-gall, 1997). The base year for the data is 1992. However, for further development of the CAP the reference scenario should be the situation in 1996/97 when the changes of the 1992 reform were supposed to be fully implemented. To update the database for the simulations in this paper we implemented the 1992 policy changes within the EU-12, i.e., price decreases for grains, oilseeds, protein seeds, and meat products in connection with compulsory set-aside and direct compensation payments. Furthermore, by in-tegrating Austria, Finland, and Sweden the current EU-15 was created prior to the simulations of further enlargement to the East.
3B. Modeling the Development Period Up to 2005
IMPLICATIONS OF AN EU EASTERN ENLARGEMENT 669
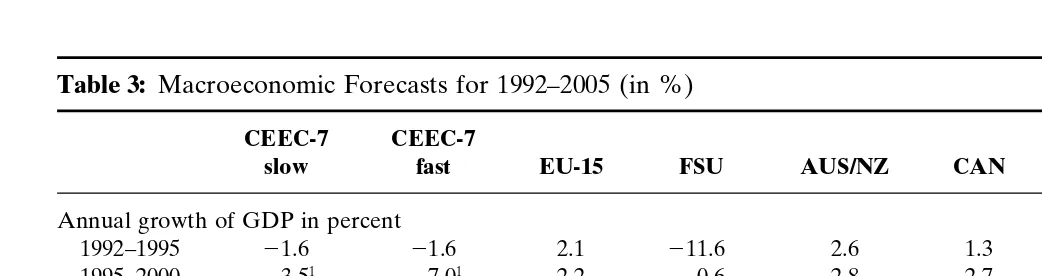
is not available, we have to derive rates of technical change endog-enously within the model by applying a methodology first pre-sented by Gehlhar, Hertel, and Martin (1994).4We use exogenous forecasts for several macroeconomic indicators (growth of GDP; growth of population and labor force; capital accumulation) as target values and solve the model by taking technical change parameters as endogenous variables. Thus, we derive TFP changes for every model region according to the exogenous assumptions about overall economic development up to 2005. Moreover, gen-eral economic growth is disaggregated into the equivalent sector specific development within the model regions.5Table 3 provides macroeconomic forecasts used for calculating the TFP changes in the development period up to 2005. For the region CEEC-7, we assumed two different options with respect to economic growth—a slow scenario with annual GDP growth at about 3 percent, and a fast scenario with 6–7 percent.6
3C. Reform of the CAP and Implementation of the Uruguay Round
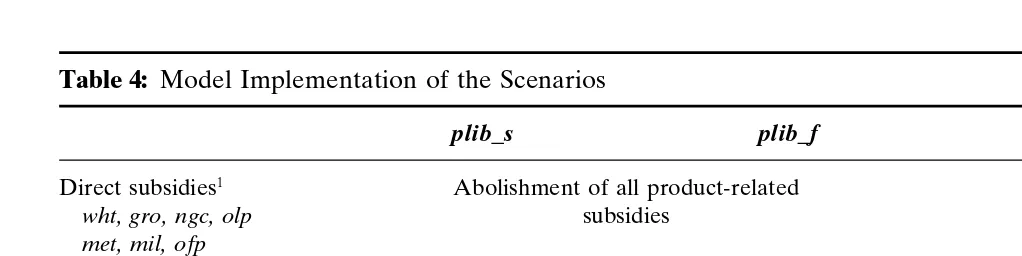
The policy options covering partial and complete liberalization of the CAP in connection with a uniform land subsidy in agricul-ture are implemented in the model as follows (see Table 4).
Under the partial liberalization scenarios all direct payments for grains, nongrain crops, and livestock that were introduced in the 1992 CAP reform are abolished. Border protection for non-grain crops, meat, and milk products is reduced by 10 percent.7 For wheat and other grains in the model we assume for simplicity that after completion of the 1992 reform in 1996 there is no more border protection, although actually export subsidies and some-times even export taxes were temporarily enforced.
4This method was also used by Frandsen et al. (1996) for modeling an EU enlargement in 2005.
5Here we just derived uniform rates of technical change throughout all sectors in one region. This could certainly be refined if more information was available on sector-specific rates of technical change. For example, Frandsen et al. (1996) assume higher rates of technical change in agriculture than in the rest of the economy. They set agricultural rates of technical change exogenously and let the other sectors adjust accordingly.
6A growth rate of 6–7 percent is certainly a strong assumption, especially as the CEEC group is very heterogeneous and growth might not be sustained over several years. This option should be seen as an upper bound for the transition countries.
670
C.
A.
Herok
and
H.
Lotze
Table 3: Macroeconomic Forecasts for 1992–2005 (in %)
CEEC-7 CEEC-7
slow fast EU-15 FSU AUS/NZ CAN USA JAP ASIA ROW
Annual growth of GDP in percent
1992–1995 21.6 21.6 2.1 211.6 2.6 1.3 1.8 1.9 7.3 2.4
1995–2000 3.51 7.01 2.2
20.6 2.8 2.7 2.5 2.1 7.0 3.6
2000–2005 3.01 6.01 2.3 3.2 2.3 2.9 2.5 2.1 6.6 4.0
Annual population growth2in percent
1992–1995 20.3 20.3 0.4 0.3 1.2 1.3 1.0 0.3 1.6 2.4
1995–2000 0.0 0.0 0.3 0.2 0.9 1.0 0.9 0.2 1.4 2.2
2000–2005 0.2 0.2 0.3 0.4 0.8 0.9 0.8 0.2 1.2 2.0
Annual capital accumulation in percent
1992–2005 3.01 3.01 3.0 2.0 3.21 3.4 3.4 4.8 7.2 2.9
Sources: USDA 1997b; Gehlhar et al. 1994;
1own assumptions;
IMPLICATIONS
OF
AN
EU
EASTERN
ENLARGEMENT
671
Table 4: Model Implementation of the Scenarios
plib s plib f lib s lib f
Direct subsidies1 Abolishment of all product-related Abolishment of all product-related
wht, gro, ngc, olp subsidies subsidies
met, mil, ofp Abolishment of all product-related
subsidies and taxes Border protection2
ngc, met, mil 210 percent 210 percent Abolishment of border protection
wht, gro, olp, ofp Abolishment of border protection
Land subsidy3
wht, gro, ngc, olp 75 percent 75 percent 75 percent 75 percent
Growth in CEEC-7 slow fast slow fast
1Compensation payments, set-aside payments, and animal payments from the 1992 CAP reform.
2Measured as the ratio domestic price/world market price; a reduction of border protection by 10 percent is equivalent to a reduction of the
ratio by 10 percent.
3Direct factor payments, in percent of the relevant factor price.
672 C. A. Herok and H. Lotze
As a substitute for current output subsidies a uniform payment on agricultural land is introduced that is not related to any specific product. Because the GTAP model works in percentage changes, any policy measure has to be translated into relative terms. The level of the land subsidy is determined by taking the amount of all current compensation payments and direct subsidies in the EU-15 (i.e., 18.7 billion ECU in 1996), reducing it by 10 percent and dividing it by the total value of agricultural land as shown in the GTAP data base for the EU-15.8Thus, we derive a subsidy level at about 75 percent of the factor price for land, which is equivalent to a payment of about 130 ECU per hectare of agricul-tural land. Technically, the ratio between the market price for land and the perceived factor price for producers is reduced such that factor costs per unit, net of the subsidy, are 25 percent of the actual market price.
When the land subsidy is transferred to the CEEC-7 the ques-tion arises whether the same absolute amount per hectare should be paid or some adjustment to local price ratios should be made. An additional problem in the process of modeling a land subsidy causes the fact that information on land prices or land rents is hardly available in Central and Eastern Europe, because land markets are still not fully developed. In this paper we introduce a land subsidy in CEEC-7, which is equal to the EU-15 in relative terms, i.e., 75 percent of the local land rent, based on the value of land endowment in the GTAP database.9This seems to be a reasonable compromise in terms of a harmonized policy regime, because it would provide a uniform policy measure throughout the enlarged EU with some specific adjustment to regional conditions. With respect to policy changes in nonagricultural sectors in the EU-15 and all sectors in the other model regions, it is assumed that the obligations from the GATT Uruguay Round are completely fulfilled until 2005. This part of the analysis was possible because the GTAP 3 database contains global protection data at pre- and post-Uruguay-Round rates (Ingco, 1997).
8Current expenditures on direct payments were arbitrarily reduced by 10 percent, because we assume that some degree of budget reduction will be likely in any further CAP reform.
IMPLICATIONS OF AN EU EASTERN ENLARGEMENT 673
3D. Modeling of CEEC-7 Integration
EU integration of the CEEC-7 is simulated in the model as a creation of a customs union. First, all barriers to trade within the CEEC-7 region and between CEEC-7 and EU-15 are removed. Second, with respect to trade with third countries border protec-tion levels of EU-15 are applied to CEEC-7. And finally, internal regulations under the CAP are transferred to the CEEC-7. The milk quota, which is still in operation under partial liberalization, is applied in the new member countries by fixing output quantities at the level of 2005 prior to integration. New payments on land are applied at the same relative level as in the EU-15.
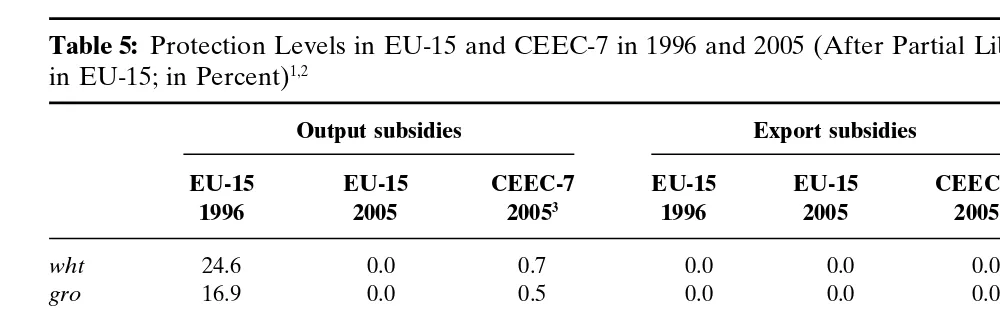
Table 5 gives an impression of the levels of agricultural support in the EU-15 and the CEEC-7 prior to enlargement. It shows protection levels in percent for the status quo in 1996 and the scenarios in 2005 after partial liberalization in the EU-15. Values for CEEC-7 in 1996 are not given because they are assumed to remain basically the same until 2005. There are only marginal effects due to Uruguay Round obligations. Also, the values for EU-15 in 2005 after complete liberalization are omitted because in the agriculture and food sectors they are all equal to zero.
The effects of a partial liberalization in the EU-15 after 1996 (abolishment of output subsidies in agriculture, reduction of bor-der measures) as well as the need for adjustment for CEEC-7 during the integration process become clear. This is especially relevant for export subsidies that are mostly zero in the transition countries prior to integration. As far as import tariffs are con-cerned, there is serious upward pressure in nongrain crops and milk, whereas tariffs on meat are similar to EU-15. In feed grains, livestock, and other food products protection levels in CEEC-7 are slightly higher than in EU-15.
4. SIMULATION RESULTS
4A. Development Period Up to 2005
First, we will briefly discuss the simulation results for the devel-opment period up to 2005 and then look at the EU enlargement effects in more detail.
674
C.
A.
Herok
and
H.
Lotze
Table 5: Protection Levels in EU-15 and CEEC-7 in 1996 and 2005 (After Partial Liberalization of the CAP
in EU-15; in Percent)1,2
Output subsidies Export subsidies Import tariff equivalents
EU-15 EU-15 CEEC-7 EU-15 EU-15 CEEC-7 EU-15 EU-15 CEEC-7
1996 2005 20053 1996 2005 2005 1996 2005 2005
wht 24.6 0.0 0.7 0.0 0.0 0.0 0.0 0.0 27.5
gro 16.9 0.0 0.5 0.0 0.0 0.0 0.0 0.0 11.8
ngc 71.0 0.0 0.4 30.4 17.4 0.0 50.0 35.0 11.2
olp 9.2 0.0 0.6 0.0 0.0 0.0 1.5 1.5 4.4
met 24.1 24.1 6.8 71.2 54.0 0.0 50.5 35.5 35.4
mil 20.2 20.2 0.2 91.3 72.2 0.0 126.6 105.7 22.1
ofp 210.8 210.8 1.2 0.6 0.6 0.0 12.7 12.7 18.9
mnfcs 20.8 20.8 20.2 20.1 20.1 21.4 8.5 4.2 8.1
svces 22.1 22.1 20.2 0.0 20.1 0.0 0.0 0.0 0.0
opp 212.8 212.8 23.5 0.4 0.2 0.0 0.6 0.6 1.5
1Complete liberalization is omitted because all values are zero. 2Protection levels are given by the ratio [(domestic price
2world price)/world price]. 3Values for CEEC-7 in 1996 are omitted because they only marginally differ from 2005.
IMPLICATIONS OF AN EU EASTERN ENLARGEMENT 675
Table 6: Forecasts for Output Growth Between 1995 and 2005 (in Percent)
wht gro ngc olp met mil ofp mnfcs svces opp
EU-15
plib_s 17.5 17.4 219.5 17.1 17.2 14.5 20.8 31.6 37.3 34.2
plib_f 17.4 16.7 219.9 16.6 16.8 14.3 20.7 31.5 37.3 34.1
lib_s 18.6 18.6 234.2 16.1 15.0 2.3 31.5 32.3 37.2 35.1
lib_f 18.5 17.8 234.6 15.6 14.6 1.9 31.5 32.2 37.3 35.0
CEEC
plib_s 26.8 26.4 38.9 29.9 28.0 30.4 27.2 40.4 44.5 34.4
plib_f 88.1 88.4 110.1 87.3 79.3 81.8 89.0 141.1 124.1 137.8
lib_s 29.0 26.7 44.0 35.8 37.7 62.9 23.4 38.7 44.3 32.9
lib_f 91.8 89.4 118.8 96.4 94.1 130.8 83.9 138.4 123.8 135.3
Source: Own calculations.
in agricultural policies (see Table 6). Different growth rates in CEEC-7 have only marginal effects for the EU-15.
With the exception of nongrain crops, all sectors are growing due to overall expansion of the economy. Nongrain crops (includ-ing sugar and oilseeds) suffer most from the abolishment of high output subsidies and border protection. Other food products (ofp) gain more from complete liberalization because there is a certain level of taxation effective in the original GTAP database that is also taken away in this scenario.
With respect to milk products, we have to explain the fact that output is rising by about 14 percent under the partial liberalization scenarios, despite the fact that the quota system is assumed to be still in operation. This is a rather synthetic result, due to the assumptions made in forecasting the development until 2005. GDP and population are growing at certain rates (see Table 3) that causes a growth in private and intermediate demand. Instead of fixing domestic output we rather allow the production quota to adjust in line with domestic demand.10 The resulting growth in output is sensitive to the assumed growth rates of population and total factor productivity. The model result of 14 percent is certainly too high compared to EU forecasts that predict stagnating milk consumption for the period 1995–2005 (EU Commission, 1997b). But our predictions are based on different assumptions, for ex-ample, we cannot account for changes in consumer preferences over time.
676 C. A. Herok and H. Lotze
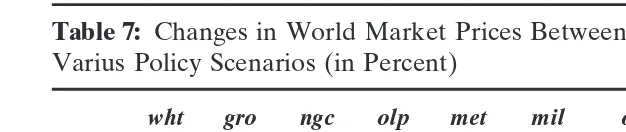
Table 7: Changes in World Market Prices Between 1995 and 2005 Under Varius Policy Scenarios (in Percent)
wht gro ngc olp met mil ofp mnfcs svces opp
plib_s 6.6 2.4 16.3 6.2 5.6 11.3 22.1 23.6 21.8 27.6
plib_f 6.1 2.0 15.8 5.8 5.2 11.0 22.3 23.6 21.8 27.7
lib_s 6.8 2.9 18.4 5.4 18.0 29.0 26.0 23.5 21.8 27.5
lib_f 6.3 2.5 17.9 4.9 17.6 28.5 26.1 23.6 21.8 27.6
Source: own calculations.
Manufacturing and service sectors are growing on average faster than agriculture and food industries. The limited endowment of land is not a constraint here. Moreover, these sectors are relatively capital intensive and the fact that capital accumulation is assumed to be faster than the growth in labor force also accelerates output growth in these sectors.
The dominant effect on output in CEEC-7 is the overall growth rate in this region, which is assumed to be 37 percent in the slow scenarios and 93 percent in the fast scenarios. In addition to domestic growth effects, agricultural liberalization in the EU-15 especially affects nongrain crops, livestock, meat, and milk prod-ucts in the CEEC-7. Here, output growth is significantly higher in the scenarios with complete liberalization of the CAP. Similar to the EU-15, output growth is strongest in manufacturing, primary products and services. Some of the output changes in the fast scenarios seem to be very high. As mentioned earlier, they corre-spond to an overall growth assumption of 6–7 percent p.a., which is certainly an upper bound.11
Changes in world market prices up to the date of enlargement are mainly caused by further CAP reform.12 Table 7 shows the price effects simulated for the development period up to the year 2005. Different growth rates in CEEC-7 hardly affect these results because they are a small region in the global market.
Growth of GDP and population in other regions and implemen-tation of the Uruguay Round also contribute to the price increase
11However, in the South East Asian economies output in some commodities doubled over the last 10 years (see Faostat), so some of the results in Table 6 might not be too unrealistic. As another example, production of oilseeds in the EU also heavily increased over the last decade (Uhlmann, 1996, p. 28).
IMPLICATIONS OF AN EU EASTERN ENLARGEMENT 677
Figure 1. Changes in trade balance in EU-15 until 2005 prior to enlargement (in Mill. 1992 ECU).
in agriculture and food products. In the nonagricultural sectors, world market prices are falling. Here, the change in productivity seems to be stronger than the increase in global demand.
Figure 1 shows changes in the trade balance for the EU-15 until 2005 in the slow scenarios. Because the Armington specification in the model causes changes in exports as well as imports in each sector, the trade balance summarizes net effects on international trade. The trade balance for nongrain crops deteriorates heavily, between 35 and 58 billion 1992 ECU. Although not presented here, the quantity changes for most agricultural exports indicate that even under a partial liberalization as presented here the EU-15 might be able to fulfill its Uruguay Round obligations with respect to export quantities. This is, with the exception of meat products, where export quantities are only reduced by about 11 percent, while WTO commitments are about 30 percent (IATRC, 1994). A further reduction in the level of border protection for meat products would be required, like, for example, a 30-percent price reduction as it is proposed by the EU Commission in the “Agenda 2000.”
678 C. A. Herok and H. Lotze
the EU able to improve the trade balance considerably. The total trade balance deteriorates, which is in accordance with the as-sumed capital accumulation and the macroeconomic closure of the model.
4B. Eastern Enlargement in 2005
Production effects in the EU-15 as a consequence of an Eastern enlargement are relatively small. According to the GTAP data-base, the share of CEEC-7 in overall trade of EU-15 is about 4 percent, and GDP in CEEC-7 is about 3 percent of the EU-15. Hence in this section, model results are primarily discussed with respect to the new members. However, trade effects are also important for the EU-15 and responsible for the resulting welfare changes.
IMPLICATIONS OF AN EU EASTERN ENLARGEMENT 679
Figure 2. Changes in trade balance in CEEC-7 after EU integration in 2005 under the slow growth scenarios (in Mill. 1992 ECU).
improves the net trade position in manufactures, while the total trade balance hardly changes at all.
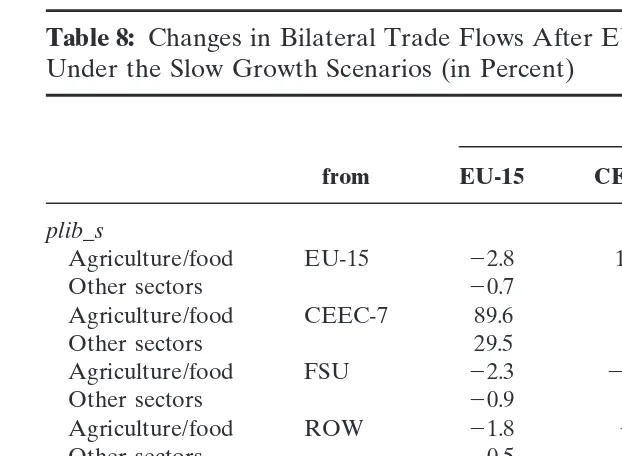
By looking at changes in bilateral trade flows (Table 8) we are able to analyze trade creation and trade diversion effects that can be expected from EU enlargement, for example, a shift in trade from the East (i.e., Former Soviet Union) to the West (i.e., EU-15). Considerable trade creation occurs within the new EU-22 in all sectors, especially in scenarioplib_s imports in food products from EU-15 to CEEC-7 increase heavily (114%). Furthermore, imports in nonagricultural sectors into CEEC-7 are increased from all regions. On the other hand, agriculture and food imports from third countries into CEEC-7 are reduced (e.g.,217% from FSU).
The latter is clearly a trade diversion effect.
Under a completely liberalized CAP (lib_s) trade creation ef-fects can be observed as more agriculture and food products are imported by the CEEC-7 from all model regions. Imports in other sectors also increase, but at smaller rates.
680 C. A. Herok and H. Lotze
Table 8: Changes in Bilateral Trade Flows After EU Enlargement in 2005 Under the Slow Growth Scenarios (in Percent)
to
from EU-15 CEEC-7 FSU ROW
plib_s
Agriculture/food EU-15 22.8 113.6 0.2 20.1
Other sectors 20.7 18.5 0.5 20.2
Agriculture/food CEEC-7 89.6 65.4 20.6 7.8
Other sectors 29.5 3.1 25.4 25.1
Agriculture/food FSU 22.3 217.1 22.5 20.3
Other sectors 20.9 8.1 0.8 20.9
Agriculture/food ROW 21.8 27.7 0.4 1.0
Other sectors 20.5 6.0 0.8 0.0
lib_s
Agriculture/food EU-15 0.1 47.6 0.3 20.2
Other sectors 20.8 16.8 0.3 20.2
Agriculture/food CEEC-7 21.0 47.4 2.1 0.1
Other sectors 35.0 7.1 21.1 21.2
Agriculture/food FSU 20.5 14.5 20.2 20.7
Other sectors 21.0 7.4 0.5 20.9
Agriculture/food ROW 0.2 16.7 0.1 20.6
Other sectors 20.6 4.5 0.6 0.1
Source: own calculations.
Under partial liberalization output strongly increases in non-grain crops and meat products due to higher protection levels. Milk production does not change because the quota level was fixed at the preenlargement quantity. Production of other food products falls because border protection is reduced and more is imported from the old EU-15. Integration under partial liberaliza-tion of the CAP increases GDP in CEEC-7 by about 3.5 percent.
Table 9: Changes in Output in CEEC-7 After EU Integration in 2005 (in Percent)
wht gro ngc olp met mil ofp mnfcs svces opp
plib_s 22.3 25.6 15.6 2.2 11.4 0.0 214.9 1.7 20.7 27.0
plib_f 22.1 24.9 17.5 2.7 13.0 0.0 213.8 1.2 20.8 26.5
lib_s 21.7 23.0 21.9 22.1 25.9 0.8 27.4 4.3 20.6 23.9
lib_f 21.8 22.7 21.5 22.0 26.0 0.6 26.8 3.7 20.7 23.5
IMPLICATIONS OF AN EU EASTERN ENLARGEMENT 681
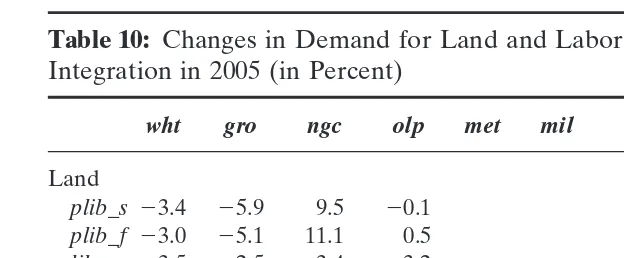
Table 10: Changes in Demand for Land and Labor in CEEC-7 After EU Integration in 2005 (in Percent)
wht gro ngc olp met mil ofp mnfcs svces opp
Land
plib_s23.4 25.9 9.5 20.1 251.5
plib_f 23.0 25.1 11.1 0.5 251.0
lib_s 3.5 2.5 3.4 3.2 244.4
lib_f 4.2 3.5 4.4 4.0 243.7
Labor
plib_s21.7 25.5 19.5 3.6 10.9 20.4 215.2 1.3 21.1 23.1
plib_f 21.6 24.9 21.4 3.8 12.5 20.4 214.1 0.9 21.2 22.5
lib_s 4.7 26.1 24.9 25.1 25.8 0.9 27.3 4.4 20.5 20.1
lib_f 25.0 26.0 24.7 25.2 25.9 0.7 26.7 3.7 20.6 0.1
Source: own calculations.
Complete liberalization implies broader reduction of govern-ment support in CEEC-7 and lower output in agriculture and food. Production factors are moving into other sectors that were already less protected before the enlargement (e.g.,mnfcs) where they induce additional output growth. Under a completely liberal-ized agricultural policy there are no additional growth effects in CEEC-7 due to EU integration.
Output changes in the model are essentially related to factor movements between sectors (see Table 10). Under partial liberal-ization, land shifts from grains and livestock production into non-grain crops. Labor moves into agriculture and food production. When we aggregate the numbers in Table 10, overall labor force in agriculture and food is increased by 3.5 percent in scenario
plib_s, whereas it is reduced by 0.5 in the rest of the economy. In the case of complete liberalization, labor moves primarily into manufactures.
682 C. A. Herok and H. Lotze
Table 11: Changes in Domestic Output Prices and Factor Prices in CEEC-7 After EU Integration in 2005 (in Percent)
plib_s plib_f lib_s lib_f
Land (market price) 337.8 333.4 240.1 232.4
Land (producer price) 14.1 14.3 212.2 213.4
Labor 3.0 3.1 1.9 2.1
Capital 2.2 2.4 2.1 2.3
wht 4.0 4.0 21.8 21.7
gro 3.0 3.1 22.3 22.1
ngc 7.5 7.5 22.4 22.3
olp 5.5 5.6 22.1 21.8
met 17.3 17.4 5.6 5.9
mil 62.9 64.6 20.7 20.5
ofp 19.1 19.4 0.9 1.2
mnfcs 1.1 1.3 0.1 0.4
svces 2.2 2.4 1.1 1.3
opp 4.9 5.1 3.4 3.6
Source: own calculations.
price for land increases heavily in all scenarios. Because of a rising value marginal product for land, and despite the land subsidy, the producer price for land also rises by about 14 percent under a partially liberalized CAP. Under complete liberalization the pro-ducer price for land falls. Heavily increasing land prices indicate that a significant share of the subsidy is transferred to land owners. Because land is not yet fully privatized in most transition countries, it is not clear who would ultimately benefit from this policy.
In theplibscenarios, output prices for processed food increase significantly. The strong price increase for milk products of more than 60 percent is caused by the introduction of a quota restriction together with increased border protection. Although producers clearly benefit from these changes, consumer welfare is negatively effected. This could be especially important in transition countries where the food share in household expenditure is currently still high. However, after significant economic growth in the preen-largement period expenditure shares might have adjusted down-ward to EU-15 levels. Under complete liberalization prices for most agricultural and food products, except for meat products, fall in CEEC-7.
IMPLICATIONS OF AN EU EASTERN ENLARGEMENT 683
Table 12: Welfare Changes Due to an EU Enlargement in 2005 Under Various Policy Scenarios (Equivalent Variation in Million 1992 ECU)
plib_s plib_f lib_s lib_f
EU-15 840 673 1,189 1,446
CEEC-7 654 1,215 67 236
Australia/New Zealand 270 288 12 17
Canada 28 28 29 212
USA 2148 2190 2142 2202
Japan 2204 2275 2321 2469
Former Soviet Union 195 286 185 260
Asia 2621 2815 2676 2941
Rest of the World 2395 2535 2157 2243
World Total 243 263 147 91
Source: own calculations.
in Table 12 measured as the equivalent variation in million 1992 ECU.13 The EU-15 benefits more from the enlargement after complete liberalization of the CAP, whereas the CEEC-7 gain most after partial liberalization and fast growth. The other regions in the model, except the Former Soviet Union, lose in all scenarios, which is mainly due to trade diversion effects of the EU integra-tion. While EU-15 and CEEC-7 abolish their internal trade barri-ers,14all other regions leave existing protection unchanged. Hence, they participate less from rising output and trade in CEEC-7. The overall global welfare increase is negligible. However, we have to keep in mind that the numbers in Table 12 are pure effects of the EU enlargement. If welfare increases from the development period up to 2005 are taken into account, the world as a whole is better off under a complete liberalization of the CAP.15In this case, EU enlargement occurs at a higher welfare level; therefore, the additional welfare gain from the integration itself is smaller.
13The equivalent variation is derived from the regional per-capita utility function in the GTAP model (see Hertel, 1997, p. 35).
14Under a complete liberalization, of course, all external barriers in agriculture and food are also reduced.
684 C. A. Herok and H. Lotze
Nevertheless, the welfare gains calculated here are only part of the story. There is more to be expected than simply the static gains from trade. It can be concluded from other studies on regional integration (e.g., Baldwin and Venables, 1995; Baldwin and Fran-cois, 1996) that the new EU members will experience gains from economies of scale and increased competition as well as increased capital accumulation in the long run due to increased political stability. Baldwin and Francois (1996) conclude for an EU integra-tion of the CEEC-7 that the static trade effects are overwhelmed by the more dynamic effects in the longer run.
To provide a statement on the budgetary effects of EU enlarge-ment we have to do some side calculations because the standard version of the GTAP model does not single out budget expendi-tures and revenues. Besides, the absolute values of all subsidy equivalents in the GTAP database do not necessarily correspond to EU budget statistics, as the GTAP protection data also include “dirty protection measures” such as quantitative restrictions and non-tariff barriers.16Hence, we take the official data on the EU budget in 1996 as a base and apply only the relative changes in the value of protection from the model calculations. The amount paid for land subsidies is calculated as 75 percent of the value of agricultural land for the EU-15 in 1996 and for CEEC-7 in 2005. The results are shown in Table 13.
The sum of direct payments, export subsidies, import tariffs, and factor subsidies for the EU-15 is reduced by about 18 percent after partial CAP liberalization and by 34 percent after complete liberalization. With respect to changes in other expenditures, for example, guidance funds and accompanying measures, we have to make some additional assumptions, especially in the case of complete liberalization. Even in these scenarios it seems unrealis-tic that expenditures on structural funds will be completely re-moved. The assumptions are partly taken from Kirschke et al. (1997). When we look at the total budget, the savings under the various policy scenarios are even more pronounced.
In CEEC-7, the introduction of a land subsidy together with changes in border protection after EU integration adds up to
IMPLICATIONS OF AN EU EASTERN ENLARGEMENT 685
Table 13: Budget Effects of an EU Enlargement in 2005 Under Various Policy Scenarios (in Mill. 1992 ECU)
1996 plib_s plib_f lib_s lib_f
EU-15
Direct payments1 18,677
Export subsidies 7,060 5,385 5,299
Import tariffs 2864 21,401 21,362
Land subsidies 16,511 16,511 16,511 16,511
Subtotal 24,873 20,495 20,448 16,511 16,511
Other expenditures2 19,174 17,257 17,257 8,3004 8,3004 Other revenues3
21,287 2644 2644
Total 42,760 37,108 37,061 24,811 24,811
CEEC-7
Output subsidies 104
Export subsidies 853 1,180
Import tariffs 2768 2591 2660
Land subsidies 5,837 6,884 5,837 6,884
Subtotal 2665 6,098 7,404 5,837 6,884
Other expenditures2 n.a. n.a. n.a. n.a. n.a.
Other revenues3 n.a. n.a. n.a. n.a. n.a.
Total 2665 6,098 7,404 5,837 6,884
Contribution to EU budget5 1,454 2,038 1,407 1,979
Net transfer from EU-15 4,645 5,366 4,430 4,906
1Compensation, set-aside, and animal payments from the 1992 CAP reform. 2Market intervention, guidance funds, food aid refunds, accompanying measures; not available for CEEC-7.
3Sugar levies; not available for CEEC-7.
4Under complete liberalization “other expenditures” are defined as guidance funds and minimum intervention stocks.
5Calculated as 0.65 percent of regional GDP.
Source: Kirschke et al., 1997; EU Commission 1997c; own calculations.
budget expenditures between 5.8 and 7.4 billion 1992 ECU. In the model, all subsidy payments within a region have to be paid by the regional household itself, with negative consequences for regional welfare. However, it is most likely that the new members from CEEC-7 will be net recipients in a new EU-22 for some time. Most of the support payments under the CAP will be paid out of the EU budget. The budget contribution of the new mem-bers can be calculated as 0.65 percent of GDP.17The bottom line
686 C. A. Herok and H. Lotze
in Table 13 provides the calculated transfer from the EU budget to CEEC-7 net of their own contribution. We must consider, though, that these budget expenditures do not represent the “total cost of enlargement” from the EU perspective, because they only include direct protection measures. Structural aid and general support for CEEC-7, which are already proposed in the “Agenda 2000” (EU Commission, 1997a), will significantly increase EU budget expenditures during the enlargement process. If we add up the welfare increase from Table 12 and the direct budget transfers from EU-15, the total gain in CEEC-7 from the enlarge-ment in 2005 is between 1.7 percent (lib_f) and 2.4 percent of GDP (plib_s).
5. SUMMARY AND OUTLOOK
In this paper we use the GTAP applied general equilibrium model for simulating the integration of seven Central and East European countries into the EU in 2005. The Common Agricul-tural Policy is modified by introducing a uniform subsidy on ag-ricultural land that is currently discussed among other proposals. The land subsidy is transferred to the new members only in relative terms according to local price levels. Moreover, despite consider-able uncertainty, we simulate two different paths up to the year 2005 within the modeling framework.
Welfare gains from EU enlargement are mainly due to trade creation within a new EU-22. Under partial liberalization domestic prices in CEEC-7 rise, labor and land are drawn into agriculture and food production and, hence, output and exports increase in these sectors. Domestic welfare in CEEC-7 rises by about 2 per-cent of GDP at preenlargement levels. This includes budget trans-fers from EU-15, which amount to about 5 billion ECU. Despite these increased expenditures the total agricultural budget of the EU-15 does not rise, due to savings as a result of agricultural policy reform. Not included in the budget expenditures are struc-tural funds and general support measures because they are cur-rently difficult to forecast. Due to trade diversion, most other regions in the model lose after an EU enlargement.
IMPLICATIONS OF AN EU EASTERN ENLARGEMENT 687
liberalization, and in this case it is almost completely due to EU budget transfers related to the land subsidy. Nevertheless, expen-ditures under the CAP are heavily reduced, which would provide room for more general structural aid for the new members. Al-though the direct welfare gains from EU integration are larger under a partially liberalized CAP, in the case of complete liberal-ization the CEEC-7 are able to grow faster prior to EU enlarge-ment and the combined effects outweigh the partial liberalization results.
While interpreting the calculated effects of an EU enlargement we have to keep in mind that the model results crucially depend on the underlying assumptions with regard to agricultural policies, the general economic development up to the date of enlargement, as well as indirect effects of the EU integration like productivity shifts, investment incentives, and changes in the policy environ-ment. Furthermore, endogenizing dynamic effects like interre-gional capital flows within the model would also change the results. With regard to political viability, it is quite clear in view of the “Agenda 2000” that a partial liberalization scenario seems to be a more realistic option in the near future. However, the proposed policy changes might not be “green box” compatible, and they might not be sufficient for the CEEC-7 to meet their WTO obliga-tions. A uniform payment on agricultural land would be less mar-ket distorting than product-related compensation payments, and they are likely to lower administrative expenses related to agricul-tural policies. This would probably improve the position of the EU in future WTO negotiations on agricultural and food products. However, new distortions on factor markets due to the land sub-sidy cannot be ruled out. Depending on the design of the payment, a considerable part of the subsidy might be transferred to the factor owners. This effect is questionable because a major policy objective of the CAP still is income support to active farmers.
There are certainly limits to the model in the current verison. Changes in the CAP and effects of the EU enlargement are ana-lyzed on a highly aggregated level. Consideration of product-specific aspects is only possible to a limited extent. Wider product disaggregation, especially in agriculture and food, would certainly be desirable.18 As far as regional aggregation is concerned, the
688 C. A. Herok and H. Lotze
group of CEEC-7 does not consist of homogeneous countries. On the contrary, in many aspects they are very diverse, but this has to be neglected as long as the group is treated as a single region in the model. Data availability puts serious constraints to any empirical modeling exercise in transition economies. The GTAP database, although probably a collection of the best information available, still has deficiencies regarding countries in Central and Eastern Europe and the former Soviet Union. This should be kept in mind when the model results are interpreted.
One of the core assumptions of our model are well-functioning markets in all sectors and regions. This is certainly not always the case in the CEEC-7 and even less in the Former Soviet Union at this point. Extensions of the model used in other studies include the implementation of monopolistic competition, imperfect factor markets, and dynamics. There is plenty of scope for modeling the situation in transition countries more realistically in the future.
REFERENCES
Agra Europe. (1997)Bru¨sseler Prognosen fu¨r die EU-Agrarma¨rkte ero¨ffnen die Reformde-batte.Bonn: Anonymous, vol. 17/97, pp. E1–E7.
Anderson, K., and Tyers, R. (1995) Implications of EU Expansion for European Agricul-ture, Policies, Trade and Welfare. In: Expanding Membership of the European Union. Baldwin, R.E., Haaparanta, P.J., and Kiander, J. (eds.). Cambridge, UK: Cambridge University Press.
Armington, P.A. (1969). A Theory of Demand for Products Distinguished by Place of Production. IMF Staff Papers (16), S. 159–178. Washington, DC.
Baldwin, R.E., and Francois, J.F. (1996) Scale Economies, Imperfect Competition, and the Eastern Expansion of the EU. Paper presented at the 50th EAAE Seminar. October 15–17. Giessen.
Baldwin, R.E., and Venables, A.J. (1995) Regional Economic Integration. In Handbook of International Economics (Grossman, G.M., and Rogoff, K., Eds.). Amsterdam: North-Holland.
Banse, M., and Mu¨nch, W. (1997) Auswirkungen eines EU-Beitritts der Visegrad-Staaten. Eine Partielle und Allgemeine Gleichgewichtsanalyse. Paper presented at the An-nual Meeting of the German Association of Agricultural Economists (GEWI-SOLA). October 6–8. Mu¨nchen.
Brockmeier, M., Hertel, T.W., and Swaminathan, P.V. (1996) Integration of the Central European Economies into the European Union. Paper presented at the 50th EAAE Seminar. October 15–17. Giessen.
European Commission. (1995): Agricultural Situation and Prospects in the CEEC. Sum-mary Report. DG VI. Brussels.
European Commission. (1997a) Agenda 2000. DOC/97/6, Brussels.
IMPLICATIONS OF AN EU EASTERN ENLARGEMENT 689
European Commission. (1997c) The situation of agriculture in the European Union. Brus-sels.
Frandsen, S.E., Bach, C.F., and Stephensen, P. (1996) European Integration and the Common Agricultural Policy: A CGE Multi Regional Analysis for the Central European Countries and Denmark. Paper presented at the 50th EAAE Seminar. October 15–17. Giessen.
Gehlhar, M.J., Hertel, T.W., and Martin, W. (1994) Economic Growth and the Changing Structure of Trade and Production in the Pacific Rim.American Journal of Agricul-tural Economics, 76:1101–1110.
Harrison, W.J., and Pearson, K.R. (1996) Computing Solutions for Large General Equilib-rium Models using GEMPACK.Computational Economics, 9:83–127.
Herok, C.A., and Lotze, H. (1997) Neue Wege der Gemeinsamen Agrarpolitik: Handelsef-fekte und gesamtwirtschaftliche Auswirkungen.Agrarwirtschaft46:257–264. Hertel, T.W. (Ed.) (1997)Global Trade Analysis: Modeling and Applications. Cambridge,
UK: Cambridge University Press.
Hertel, T.W., Masters, W.A., and Gehlhar, M.J. (1997) Regionalism in World Food Mar-kets: Implications for Trade and Welfare. Paper presented at the XXIII. Interna-tional Conference of Agricultural Economists. August 10–16. Sacramento. Ingco, M. (1997) Agricultural protection. In:Global Trade, Assistance, and Protection:
The GTAP 3 Data Base(McDougall, R.A., Ed.). Perdue: Center for Global Trade Analysis, Purdue University.
International Agricultural Trade Research Consortium (IATRC). (1994) The Uruguay Round Agreement on Agriculture: An Evaluation. Commissioned Paper No. 9. Minnesota.
Kirschke, D., Hagedorn, K., Odening, M., and von Witzke, H. (1997)Optionen fu¨r die Weiterentwicklung der EU-Agrarpolitik.Kiel: Vauk.
Kirschke, D., Odening, M., Doluschitz, R., Fock, T., Hagedorn, K., Rost, D., and von Witzke, H. (1998)Untersuchungen zur Weiterentwicklung der EU-Agrarpolitik aus Sicht der neuen Bundesla¨nder.Kiel: Vauk.
Mahe´, L.P., Cordier, J., Guyomard, H., and Roe, T. (1995) L’Agriculture et l’e´largissement de l’Union europe´ene aux pays d’Europe centrale et orientale: Transition en vue de l’inte´gration ou l’inte´gration pour la transition? Study for DG I of the European Commission. Brussels.
McDougall, R.A. (1997)Global Trade, Assistance, and Protection: The GTAP 3 Data Base.
Perdue: Center for Global Trade Analysis. Purdue University.
OECD. (1996)Agricultural Policies, Market and Trade in Transition Economies, Monitor-ing and Evaluation.Paris: OECD.
Ryan, M., and Jones, W. (1997) Globalisation of the Food Industry in Central and Eastern Europe. InGlobalisation of the Food Industry: Policy Implications. Conference Proceedings. Loader, R.J., Henson, S.J., and Traill, W.B. (Eds.). Reading, UK: University of Reading.
Swaminathan, P.V. (1997) Regional Integration in the Presence of Monopolistic Competi-tion: Implications for enlarging the European Union. Ph.D. Dissertation. Depart-ment of Agricultural Economics. Purdue University.
Tangermann, S., Josling, T.E., and Mu¨nch, W. (1994) Pre-accession agricultural policies for central Europe and the European Union. Study for DG I of the European Commission. Brussels.
690 C. A. Herok and H. Lotze
the German Association of Agricultural Economists (GEWISOLA). Mu¨nchen, October 6–8.
Uhlmann, F. (1996) Die Ma¨rkte Fu¨r Getreide, O¨ lsaaten und Kartoffeln.Agrarwirtschaft
45:18–39.
United States Department of Agriculture (USDA). (1997a) International Agricultural Trade: Europe. WRS-97-5, December. Washington, DC.
United States Department of Agriculture (USDA). (1997b) International Agricultural Baseline Projections to 2005. Washington, DC.
Wissenschaftlicher Beirat Beim Bundesministerium Fu¨r Erna¨hrung, Landwirtschaft und Forsten (Wiss. Beirat). (1997) Zur Weiterentwicklung der EU-Agrarreform. An-gewandte Wissenschaft. Heft 459. Bonn.