The Journal of Vocational Education Research V 25, Issue 1 • 2000
Table of Contents
Editor’s Notes
James R. Stone, III 1
Presidential Address, AVERA: Keeping on Track to the Future
Hollie Thomas 5
The Effects of Gender and Years of Teaching Experience on Explanatory Style of Secondary Vocational Teachers Bettye P. Smith, Helen C. Hall ,and
Constance O. Woolcock-Henry 24
From Vocational Education and Training to Work: Representations from Two Occupational Areas
Marcelle Hardy 37
The Critical Incident Technique in Job Behavior Research Wanda L. Stitt-Gohdes, Judith J. Lambrecht, and
Journal of Vocational Education Research, Vol. 25, No.1, pp.1-4 2000
Editor’s Notes
James R. Stone, IIIUniversity of Minnesota
This issue begins my tenure as editor of the JVER. It is an inauspicious beginning to be sure as this issue is tardy in its arrival. The cause of the delay lies squarely with this editor. It is my hope to have us caught up by year’s end. John Schell continues as managing editor, a welcomed support. The previous editor, Jay Rojewski has been most supportive in this transition and for his support, I am also
appreciative.
Several years ago, my colleague and former JVER editor Professor Theodore Lewis (1995), wrote in this column that a journal of vocational education ought to be the place where we resolve the most interesting questions of the field. I would simply add that a journal of vocational education ought to be the place where change agents interested in vocational education go first for new knowledge.
Professor Lewis was right then and he is right today. This journal ought to be a place where we address perennial issues and problems of vocational education. What then, are the most interesting questions, the perennial issues of the field?
In 1995, Professor Lewis discussed the need to understand how workers are coping in the face of technology. He suggested that the correlation of social class and curriculum, the problem of integrating academic and vocational education, the transitions from school to work were all problems of an enduring nature.
More recently, my predecessor, Jay Rojewski, in his final comments as editor, observed what he characterized as an amazing range of topics addressed during his tenure. His list of topics included transition from school to work, environmental ethics, student skill assessment, career development and decision making, community service, and teacher stress (Rojewski, 1999).
The new National Research Center for Career and Technical Education built its proposal around questions derived from the recent Perkins III legislation. They proposed projects that asked questions about
curriculum integration,accountability, professional development, educational technology and distance learning, and academic/vocational skills needed for employment and continued education. These topics mirrored the Congressional vocational education agenda.
To this growing list, I add my own thoughts.
We know that there has been a general decline in the number of students enrolled in secondary vocational education and a decline in the number of vocational courses taken by students (Levesque, Lauen, Teitelbaum, Alt, &. MPR Associates, 2000). While traditional vocational education is in decline, we see growth in career academies, career-based charter schools, career magnets and other forms of non-traditional, or at least non-reported vocational education. What are the causes and consequences of such trends? Are they a good or bad thing?
Many of us have sensed there is confusion over the role and purpose of vocational education in our schools. How should public education address the economic and occupational development of its future citizens? Or do we leave all this to television?
The U.S. Department of Education is crafting and promoting a framework of occupational clusters. How will these or how have other pathway schemes affected the education and career decision making of young people?
Schools and colleges are rushing to spend huge sums on educational technology. Which technologies improve which aspects of the teaching learning process in vocational education?
More than 70% of adolescents work, a third of them more than 20 hours a week (Stone and Mortimer, 1998). Yet we find fewer than 11 percent of them connect that work to school through cooperative vocational education, apprenticeships or internships (Delci & Stern, 1999). What do we know about the effect of this disconnected learning on student achievement in high schools and transition to post high school education and training?
Why do so few women pursue and persist in information technology careers?
Tech Prep, curriculum integration, and contextualized learning have become part of the vocational educational landscape. What do we know about their effect on learning? Private vendors of occupational certification (e.g., Cisco and Novell) are penetrating our schools with “vocational education.” What is the effect of such activities on the young people who
participate? What is the impact on the nature of vocational education of such initiatives?
Why aren’t the thousands of articulation agreements created in the past dozen years showing up on our two-year college campuses?
Whither school to work?
Are these the most interesting or important questions? Or are they questions of a transient nature leaving deeper, perhaps more important questions unaddressed? What are today’s interesting questions?
So we turn to our scholars in this issue of the JVER and ask what they are asking. In this issue, we begin with the Presidential Address where Hollie Thomas asks what direction the professional association, AVERA, needs to follow. Marcelle Hardy asks questions of the school to work process in Canada. Bettye Smith, Helen Hall, and Constance Wollcock-Henry ask questions about high school teachers and Attributional Style. Finally, Wanda Stitt-Gohdes, Judy Lambrecht, and Donna Redman ask questions of the critical incident methodology as a strategy for understanding the work world.
In future issues, we will examine tech prep with Debra Bragg as a guest editor. Later this year we will assemble the thoughts of many of our leading thinkers on the nature and purpose of vocational education in a changed and changing world.
But for now, I ask that you consider what you believe to be the important questions and set about
References
Delci, M. & Stern, D. (1999). Who participates in new vocational programs: A preliminary analysis of student data from the NLSY97. Berkeley, CA: The National Center for Research in Vocational Education, University of California, Berkeley.
Lewis, T. (1995). Transition: What are the questions? Journal of Vocational Education Research. 20(1), pp. 3-6.
Levesque, K., Lauen, D., Teitelbaum, P., Alt, M. Librera, S. & MPR Associates. (2000). Vocational Education in the United States:Toward the Year 2000. Washington, D.C.: National Center for Education Statistics, U.S. Department of Education, Office of Educational Research and Improvement (doc. no. NCES 2000–29).
Rojweski, J.W. (1999). Editorial: Articles published in the Journal For Vocational Education Research from 1997-1999. Journal Of Vocational Education Research, 24(4), 161-163.
Journal of Vocational Education Research, Vol. 25, No. 1, pp. 5-23. 2000
Keeping on Track to the Future Presidential Address
American Vocational Education Research Association Hollie Thomas
Florida State University
Introduction
It has been my privilege to serve as your president during the last year of the Century. The timing has caused me to approach the task differently than I would have at a different point in time. We live in a time when reform seems to be on everyone’s mind (e.g. Lynch, Smith, & Rowjewski, 1994; Hilosky & Watwood, 1997; O’Reilly, Asche, & Rowland, 1995). Because of the timing, I have asked myself whether it is time to think about redirecting AVERA. With this question in mind, I wanted to know how well we are serving the membership and what we should be doing in the future. I have done two things to attempt to provide answers to these questions. First, I appointed a Futures Committee with the anticipation that this group would think out of the box and give us some bold new ideas as well as some ideas of how to fix what we are doing. Secondly, a survey was sent to all of the 1999 membership as well as to those who had been on the 1998 membership list but not on the 1999 list. The development of this survey is pretty much thinking inside of the box. All of this was designed to help us take a look at the changes we need to make in the organization.
We as educators have always been agents of change. We expect our students to make changes in their knowledge, skills and abilities. If they don’t we are obliged to give them a failing grade. We as Vocational Educators, however, have been known for our reluctance to change. As Marion Asche (1991) has said, Vocational Educators have been accused of starting every sentence about the future of Vocational Education with “now in 1917…” On the other hand, it has been shown that Vocational Educators are seen by their administrators as being very willing to change (Thomas & Schmidt, 1999). The question here is, are we making the changes needed in the organization that are needed to keep it up as a viable force in Vocational Education and what are the changes we should make in the future.
In this presentation I will present some ideas on change and why it is essential to the life of the organization, discuss the findings from the survey, and provide some thoughts about what we might do to keep the viability of the organization at an optimum level. I want to preface my statements with the thought that all of us have been asked to do more and more as our faculties in Vocational Education get smaller and smaller. Thus, the efforts that we are able to put into a professional organization may not be what we would like to be able to give. We need to think about maximizing the returns for the energy expended in nearly everything we do. Thus, I do not seek change for change’s sake.
Change Theory
Why is change important to an organization like ours? When put in bold relief like the Saber Tooth Curriculum (Benjamin, 1972) did many years ago, it is obvious that if one wants to remain relevant, change is necessary. Research in the area of physical systems has shown that a system will entropy when it is allowed to run long enough without a new source of energy (Horwich, 1987). In other words, it will simply run out of energy and run down. It isn’t, however, inevitable that a system must run down. Blanchard and Waghorn (1997) have written extensively on the life
expectancy of organizations. Their theory indicates that a new system starts off slowly, but after a relatively long period of slow growth, builds rapidly for an undetermined amount of time; then after a brief plateau it begins to decline rapidly. This theory is depicted by an S-shaped or sigmoid curve (see Figure 1). Based on this theory, Blanchard and Waghorn’s idea of how to succeed is to start
something new just before the old system runs out of energy. In my opinion, that might work in business, but in professional organizations the alternative strategy of generating new energy
periodically so that the period of growth goes on indefinitely is more viable. This can be depicted by a Double S curve as shown in Figure 2. This suggests that one should anticipate an impending
another period of time. It is my opinion that this is what the AVERA has done. We can point to many injections of new energy into the system. Incremental changes whether they are large or small can put new energy into an organization. Examples of the changes that the organization has made include the starting of a research journal, sponsoring the Vocational Education SIG at AERA,
development of a newsletter, giving awards to worthy members, and including a past presidents forum in the program. If you were to ask me what change the organization has made in recent years that equals these rather major changes, I would point to the AVERA web page for one. There haven’t been as many changes in what we do and how we do it in the last sixteen years as there was in the first sixteen. However, we do get a new infusion of energy each time we elect a new set of officers, elect new members to the Journal Editorial Board, elect a new Editorial Board Chair and appoint a new Journal Editor. Even though there is a learning curve for new officers, a new person will give new insights and provide leadership in a different way.
Actors in the Change Process
Given that changes are needed to keep an organization viable and relevant, we need to know how to bring about change. My experience is that individuals either grouse about the lack of
change/relevance or just vote with their feet and fail to renew their membership in the organization that ceases to meet their needs. If this becomes a predominant trend among the membership and a ready source of new members is not available, then it is apparent that entropy is about to occur. We will look at the actors that are necessary for change to occur and then at the process of change.
The actors involved in the change process according to Conner (1992) include sponsors, agents, targets and advocates. Sponsors are those individuals in an organization who can actually make the changes if the changes advocated pass the muster of being beneficial for the organization. In this organization these actors would be the executive committee or with changes in the Journal, the Editorial Board. Agents are the individuals who actually do the work to make the change. I am afraid that is too often the same folks as those who sponsor the change in this organization. The actors identified as targets are the individuals who need to change. You know, those of us who are out of date and need to be brought into the 21st century. Finally, but the most important actor, is the advocate for change. This is the person who is not in the position to make the change but wants the change to occur. We need to encourage our membership to advocate for the changes that would make the organization more relevant to their needs and we must let folks know that we want their input and we are listening. It should be made clear that anyone of us may play any of these roles at any point in time, i.e. there is not one set of players who are playing the same roles all of the time. I could be advocating for a change in the Editorial Board policy while being the target, one needing to change, on the Executive Committee etc.
Change Process
The steps in the process of changing an organization involve:
conducted within the context of AVERA and that the mission of the organization would be kept in mind while conducting the process.
We, as officers in the AVERA, perhaps I should limit my generalizations to myself, have a life and a job outside of the organization. Thus we may approach the organization as something we have to get done before the meeting gets here. This often causes me to do what has always been done. Bradshaw (1988) refers to this mindless tracking on the chores at hand as being done by “human doings”. If this process continues in an organization, it is clear that the changing needs of the membership will be ignored. Clearly the needs being met by the activities of the organization will continue to be met; hence the need for determining the needs of the membership is evident. Sources of information about the needs of the membership range from a single member advocating for change to a formal assessment of needs. We should be listening to the membership as well as conducting studies.
When identified, the needs should be discussed and prioritized. In order to do this it is important to look at all of the consequences of making the change as well as to debate the pros and cons of making the change. If the goal of making a change is to create more energy in the
organization, we certainly do not want to make changes that will consume more energy than it creates. This is the time when a person or group should be advocating for a change that they want to see occur. To do this they will have to develop a strong case for the change in order to convince those doubters like me.
The use of study groups in bringing about change is clearly presented by Murphy and Lick (1998) as a useful tool for use in educational organizations. The usual process of this type of activity is that we have the same group doing the thinking, i.e. the executive committee. While the futures group was not supplied with data about the needs of the membership, I did ask them to look at the changes that were needed in the organization. You may note that the committee included two members of the executive committee. However, I asked for volunteers for this committee in two Beacon messages. The only two who volunteered were current officers. I asked a third person to join them.
The fourth step, developing plans for making the identified changes, is certainly not new to vocational educators. We have been teaching others to plan programs by stating the tasks required, setting timelines and establishing critical paths for as long as I can remember. However, other than individual members who have responsibilities for ongoing aspects of the organization, I do not recall a plan for changes or new initiatives being planned systematically. It is my opinion that an
organization that seeks to be relevant must seek out needed changes and make the changes in a systematic manner.
plan the implementation process and involve our membership in the implementation, I think we can continue to put new energy into the organization.
Finally, evaluation is one of the things vocational educators do well. However, we may not be applying what we know to the organization. It would seem appropriate to evaluate any new initiative that the organization undertakes so that we can determine how well we are doing what we have undertaken and what results the initiative produces.
I have a feeling that many in the audience are asking, “why is this person stating the
obvious?” I just think that as we come to the end of a millennium it is time to remind ourselves that the principles that we apply to program development also apply to our professional organization. Survey of Membership
In an effort to gain a perspective on how the organization is viewed by the members, I have undertaken a survey of the membership to determine their perception of whether we should be undertaking a list of activities and how well we have been doing them. I am sure that many of you completed the survey.
The survey, which asked the extent that the respondents agreed with statements concerning AVERA and the services and opportunities provided by the organization, was sent to all current members. A second questionnaire was sent to individuals who were included on the 1998 AVERA directory but not in the1999 AVERA directory. The total number of surveys sent was 169 for current members and 140 for lapsed members. One of the former and 25 of the latter were returned for insufficient/non-current address. The number of returned useable surveys was 87 (51.5%) for current members and 6 (4.3%) for individuals who had not renewed their membership. Although the survey was sent to individuals whose membership had lapsed at a later point in time, time alone does not account for the non-response of this group. While the lack of response is informative, the responses from the six who did respond were not included in the analysis of data.
The survey was developed based on the records accumulated by the past presidents as well as on the memory of the activities the organization had sponsored by the current president who has attended all AVERA meetings since 1970. Fourteen statements were written reflecting how well the organization has been functioning on the selected items and fourteen similar items reflecting the advisability of the organization continuing to conduct similar activities. A final item asked the extent to which the respondents agree or disagree with the statement that the AVERA membership should consider making a name change.
The analysis of the data was descriptive for each of the 29 statements using means, frequencies and percentages. In addition, the items reflecting the same activity for the current situation and future desired status were paired and response for the current situation subtracted from the desired future status for each respondent. These data were also analyzed using the same
descriptive statistics. Results of the Survey
First, I learned more than the responses to the 29 statements in doing this survey. I learned that we have a viable organization that has the potential of attracting new members. Of the 169 current members we have 43 new members who were not in the 1998 Membership Directory. We also appear to have one institutional member for a total 1999 membership of 170. By comparing the 1999 Membership Directory with the 1998 I discovered that a total of 140 individuals who had been listed as members in 1998 had not renewed in 1999. This may have been an accumulation over a period of years if we were not systematically deleting members who did not renew. The forwarding address of 25 of these 140 individuals had expired forwarding addresses leaving 115 whose addresses had not changed. I had a similar experience with the e-mail addresses. We sent follow-up notices to everyone who had an e-mail address listed. This included 107 former members and 144 current members. Nineteen of the current member e-mails and 57 of the former member e-mails were returned by the internet. While I am not concerned with the fact that the 1998 Directory is out of date, I am concerned that we do not have correct e-mail addresses for our current members listed in the 1999 directory.
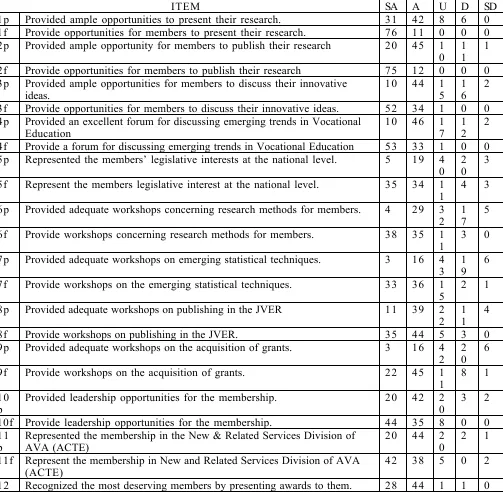
shown in Table 1, the majority of the respondents gave a response of Agree or Strongly Agree on 9 of the fourteen evaluative items of how well AVERA is doing at the present time. The five that did not receive a majority of responses representing this level of agreement were items that relate to representing legislative interest at a national level (27.5%), to providing leadership in the reform of Vocational Education (43.7%), and to providing workshops on research methods (37.9%), statistical techniques (21.8%), and acquisition of grants (21.8%). The items receiving more than three-fourths of the respondent ratings of Agree and Strongly Agree were “Providing ample opportunities for members to present their research” (83.9%), and “Recognizing the most deserving members by presenting awards to them” (82.8%).
Table 1
Frequency of Response by Survey Item
RESPONSE
ITEM SA A U D SD
1 p Provided ample opportunities to present their research. 3 1 4 2 8 6 0 1f Provide opportunities for members to present their research. 7 6 1 1 0 0 0 2 p Provided ample opportunity for members to publish their research 2 0 4 5 1
0 1 1
1
2f Provide opportunities for members to publish their research 7 5 1 2 0 0 0 3 p Provided ample opportunities for members to discuss their innovative
ideas.
3f Provide opportunities for members to discuss their innovative ideas. 5 2 3 4 1 0 0 4 p Provided an excellent forum for discussing emerging trends in Vocational
Education
4f Provide a forum for discussing emerging trends in Vocational Education 5 3 3 3 1 0 0 5 p Represented the members’ legislative interests at the national level. 5 1 9 4
0 2 0
3
5f Represent the members legislative interest at the national level. 3 5 3 4 1 1
4 3
6 p Provided adequate workshops concerning research methods for members. 4 2 9 3 2
1 7
5
6f Provide workshops concerning research methods for members. 3 8 3 5 1 1
3 0
7 p Provided adequate workshops on emerging statistical techniques. 3 1 6 4 3
1 9
6
7f Provide workshops on the emerging statistical techniques. 3 3 3 6 1 5
2 1
8 p Provided adequate workshops on publishing in the JVER 1 1 3 9 2 2
1 1
4
8f Provide workshops on publishing in the JVER. 3 5 4 4 5 3 0
9 p Provided adequate workshops on the acquisition of grants. 3 1 6 4 2
2 0
6
9f Provide workshops on the acquisition of grants. 2 2 4 5 1 1
8 1
10 p
Provided leadership opportunities for the membership. 2 0 4 2 2 0
3 2
10f Provide leadership opportunities for the membership. 4 4 3 5 8 0 0 11
p
Represented the membership in the New & Related Services Division of AVA (ACTE)
2 0 4 4 2 0
2 1
11f Represent the membership in New and Related Services Division of AVA (ACTE)
4 2 3 8 5 0 2
p 2 3 12f Recognize the most deserving by presenting awards to them. 4 6 3 9 2 0 0 13
p
Provided leadership in the of Vocational Education 7 3 1 2 5
2 0
4
13f Provide leadership in the of Vocational Education 5 0 2 9 6 2 0 14
p
Provided a mission statement that has guided the organization. 1 2 3 8 3 3
3 1
14f Revise the mission statement to provide new guidance for the organization 2 8 3 0 2 6
The responses to the activities that AVERA should be doing in the future were rated high with all of the items receiving a rating of Agree or Strongly Agree by more than two-thirds of the respondents. Nine of the 14 items receiving these ratings came from more than 90 percent of the respondents. The five items that received less than 90 percent of the response of Agree and Strongly Agree were those relating to representing legislative interest (79.3%), revising the AVERA mission statement (66.7%) and providing workshops concerning statistical techniques (79.3%), research methods (83.9%), and acquisition of grants (77.0%). It should be noted that the verb used with the item about the mission statement was “revise” rather than “provide” which would have given data parallel to the other items.
It can be observed that many of the items that were rated lower for the activities that the
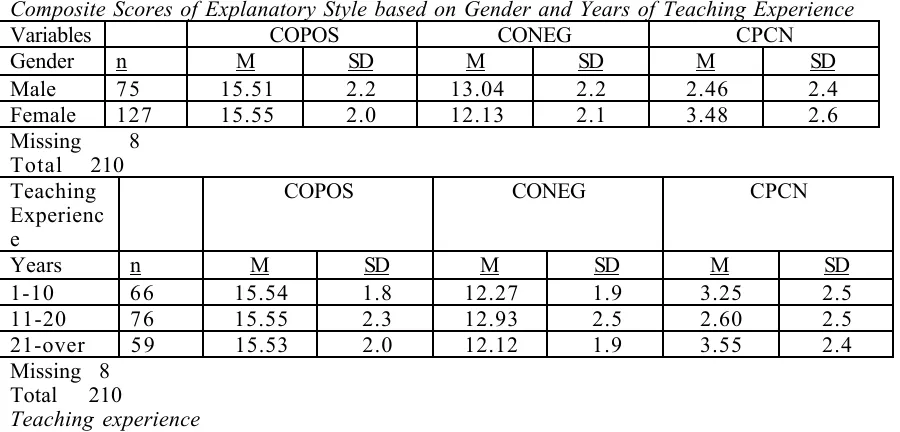
organization is currently doing are also the ones that were rated lower for the things that AVERA should be doing. This prompted me to look at the difference between the responses given by each individual for the 14 pairs of items. This procedure produced a possible scale of negative 4 to a positive 4 with the negative score representing respondents who more strongly agreed that the organization was doing activities than they agreed that the organization should be doing in the future. The positive responses represented the converse. Table 2 presents the data from the discrepancy analysis. It may be noted that the discrepancy scores equal to or less than positive or negative 1 accounted for one-half of the responses with the range being from 55.2 percent to 92.0 percent. The five items for which the frequency of discrepancy scores of equal to or greater than positive or negative 2 exceeded 30 percent were (a) “Provide workshops on the emerging statistical techniques (44.8%)”, (b) “Provide workshops concerning research methods (41.4%)”, (c) “Provide workshops on the acquisition of grants” (36.8%), (d) “Provide leadership in the reform of Vocational
Education” (35.6%), and (e) “Represent the members’ legislative interest at the national level” (35.6%). The five items for which the discrepancy scores were equal to or greater than positive or negative 2 was less than 20 percent were (a) “Recognize the most deserving members by presenting awards to them” (8.0%), (b) “Provide leadership opportunities for the membership” (11.5%), (c) Represent the membership in the New and Related Services Division” (11.5%), (d) “Provide opportunities for members to present their research” (16.1%), and (e) Provide (revise) the mission statement to provide new guidance for the organization” (18.4%). It should be noted that the discrepancy concerning the mission statement should be questioned given the inconsistency between the wording of the items. For this item, there were nearly as many negative as positive discrepancy scores.
Table 2.
Frequency of discrepancy by survey item pair
DISCREPANCY
ITEM 3 4 2 1 1 2 3 4
1 p Provided ample opportunities to present their research.
0 0 0 4 0 3 3 9 5 0
2 p Provided ample opportunity for members to publish their research.
0 0 0 3 0 3 5 11 1 0 1
2f Provide opportunities for members to publish their research.
3 p Provide ample opportunities for members to discuss their innovative ideas.
0 0 1 3 1 3 0 11 1 3 1
3f Provide opportunities for members to discuss their innovative ideas
4 p Provided an excellent forum for discussing emerging trends in Vocational Education.
0 0 3 2 4 3 7 14 8 1
4f Provide a forum for discussing emerging trends in Vocational Education.
5 p Represented the members’ legislative interests at the national level.
0 1 3 2 3 3 0 20 1 0 0
5f Represent the members legislative interest at the national level.
6 p Provided adequate workshops concerning research methods for members.
0 1 1 2 5 2 5 23 1 0 2
6f Provide workshops concerning research methods for members.
7 p Provided adequate workshops on emerging statistical techniques.
0 2 1 2 5 2 2 25 8 4
7f Provide workshops on emerging statistical techniques. 8 p Provided adequate workshops on publishing in the
JVER.
0 0 8 3 1 2 6 14 7 1
8f Provide workshops on publishing in the JVER. 9 p Provided adequate workshops on the acquisition of
grants.
0 1 4 2 5 2 6 23 8 0
9f Provide workshops on the acquisition of grants. 10
p
Provided leadership opportunities for the membership.
0 0 6 4 1 3 0 7 2 1
10f Provide leadership opportunities for the membership. 11
p
Represented the membership in the New and Related Services Division of AVA (ACTE).
0 1 4 4 9 2 4 8 1 0
11f Represent the membership in the New and Related Services Division of AVA (ACTE)
12 p
Recognized the most deserving members by presenting awards to them.
0 0 6 4 9 2 5 6 1 0
12f Recognize the most deserving members by presenting awards to them.
13 p
Provided leadership in the reform of Vocational Education.
0 0 5 1 7 3 4 17 1 1 3
13f Provide leadership in the reform of Vocational Education.
14 p
Provided a mission statement that has guided the organization.
1 2 2 2 2 6 2 3 9 3 1
14f Revise the mission statement to provide new guidance for the organization.
p = indicates in the past f = indicates in the future
the items had a mean discrepancy score of 1.00 or greater. Thus, it seems that the organization is perceived as having room to improve.
The last item on the survey was concerning whether the AVERA should consider changing the name. Nearly one-half (48.3%) of the respondents either agreed or strongly agreed with this statement while 21.8 percent either disagreed or strongly disagreed. Twenty-six (29.9%) of the respondents were undecided.
At the time of this writing there were insufficient responses from the non-renewal group to make any generalizations about the organization in terms of the responses to items. This lack of response can, in part, be attributed to the addresses used. However, this does not nearly explain the response rate. Of those who did respond, predominant reasons given for not being a current member was either that they thought they were or that they had intended to renew but had failed to do so. Please remember that we are dealing with a response rate of 4.3 percent.
Conclusions
The conclusions drawn here are from several sources: the literature, the survey data, comments written on the survey, and a combination of the above three sources with my thoughts thrown in for good measure.
Conclusions from the Literature
As I reread the literature in preparation for this presentation I thought of the implications of the literature for our organization. I am usually thinking of the implications for others such as in school districts. Thus, the literature affected me in different ways. Here are some of the things that came to mind.
• An organization that does not inject new energy into the organization will entropy over time. This organization has had infusions of new energy from time to time and has benefited from both the leadership and new member energy. We should be
conscientiously aware of the need for renewal of energy to sustain our organization and to anticipate when new initiatives are needed to meet the needs of the membership. • The literature indicates that there are various actors in the change process and that a
change needs a sponsor who has the authority to see that the appropriate steps are taken to move the change through the system. Equally important, however, is the advocate for change—that young person who sees a need for change and lets his/her opinions be known. We need to cultivate an environment in which everyone feels that his/her ideas for change will be heard.
• Inclusion of a greater percentage of the membership in the dialog about changing the organization will result in more energy being created. Appointing special groups to do tasks for the organization is a way to involve more members in getting the work done. The idea that the Executive Committee should do all of the work is a control mechanism that will limit the scope of the organization
• A systematic process for obtaining input about the needs of the membership is desirable for the health of the organization. A process for winnowing the input should be
developed and systematically used. It is important for the members to know that feedback is desired and will be considered. However, it is important to choose new initiatives carefully in order to maximize the return on the energy expended.
• Change for change sake has no productive use other than to dissipate scarce energy and resources. Proposed changes should be discussed and the consequences of making and not making the change thoroughly understood. Resistance to change is healthy, at least up to a point. It gives air to the discussion of why the change is important and requires the individuals proposing the change to express the needed change in greater detail and with acceptable clarity.
Conclusions from the survey of members
There are many conclusions that could be drawn from the data collected by the survey of the membership. It is gratifying to know that at least one-half of the membership will take the time to respond to a survey about the organization. It is my opinion that this simple survey is just the beginning of the assessment of the activities of the organization. I hope that we can move to an assessment of needs of the membership and make progress on meeting those needs that are congruent with the mission of AVERA and most important to the membership. The conclusions that I drew from the results of the survey are:
• The response of the membership regarding how well the AVERA is doing in
conducting the various activities listed was very positive. With the exception of two items concerning workshops on statistics and research methods, all items received a majority of the ratings in the agree/strongly agree category.
• Without exception the desired future status for all activities received a higher percentage of agree/strongly agree ratings than were given for the present status. It seems that, although the organization is rated favorably, there is still room for improvement.
• Some individual respondents rated the present status higher on the agree scale than they rated the desired future status. These discrepancy scores rarely exceeded one scale point, however. It would thus seem that there is reason to look closely at the activities and question whether the organization should do the activities in the future. • With the number of new members that we have and the favorable response that was
given for conducting workshops in such topics as statistics, research methods, and acquisition of grants, it seems advisable to consider the possibility of resuming these activities. To my knowledge these activities have not been done for many years. Some of us who have been members for a long time are also likely candidates for these activities.
• The time appears right to consider a change in the name of the organization. The item on the survey stated that a name change should be considered which does not lead me to conclude that the membership considers a name change to be imperative or necessarily advisable. Rather it seems important for the membership of the organization to weigh the alternatives.
Recommendations for the future
In preparing this presentation I have made some conclusions that are not necessarily based on sound evidence, i.e. more my opinion than fact perhaps. I will list a few.
• The data and literature gathered for this presentation suggest that change is essential to the health of organizations. The survey data gathered seem to indicate some possible changes. However, an extensive need assessment is recommended prior to making major changes in the organization.
• The membership should be provided the opportunity to be involved in as many aspects of the organizational life as possible. The executive committee and editorial board tend do the work themselves rather than delegate.
• An on going futures committee composed of a cross section of membership should be appointed and asked to think outside the box and make
recommendations for change in the activities of the organization.
• A study should be conducted to determine the reasons for the drop in membership over the past year. It is obvious that I was not able to tap the reasons for this reduction. At this point I do not know whether this is a statement about the health of the organization or natural attrition due to retirement and the like. • The fact that forty-four new members were attracted to the organization is
indicative of the organizational health. I would recommend that we look
I have appreciated the opportunity to serve as the president of AVERA. I hope that the next millennium will start off with a new burst of energy and that we are able to make a difference in the preparation of the workforce for the nation.
References
Asche, M (1991). Educational reform in vocational education: Review with implications for research and development. Journal of Vocational Education Research, 16 (3), p.1-34.
Benjamin, H. R.W. (1972). Saber-tooth curriculum, by Abner Peddiwell. New York, NY: McGraw-Hill.
Blanchard, K. H. & Waghorn, T. (1997). Mission possible: Becoming a world-class organization while there is still time. New York, NY: McGraw-Hill.
Bradshaw, J. (1988). Healing the shame that binds you. Deerfield Beach, FL: Health Communications.
Conner, R. D. (1993). Managing at the speed of change. How resilient managers succeed and prosper where others fail. New York, NY: Villard Books.
Deming, W. E. (1990). Manual for training in the Deming method North Miami, FL: Deming Method consulting Group.
Hilosky, A. & Watwood, B. (1997). Transormational leadership in a changing world: A survival guide for new chairs and deans. Annual International Conference for Community & Technical College Chairs, Deans, and Other Organizational Leaders, Reno, NV.
Horwich, P. (1987). Asymmetries in time: Problems in the philosophy of science. Cambridge, MA: MIT Press.
Murphy, C. U. & Lick, D. W. (1998). Whole-faculty study groups: A powerful way to change school and enhance learning. Thousand Oaks, CA: Corwin Press, Inc.
O’Reilly, P.A., Asche, F. M., & Rowland, B. K. (1995). A field-based approach to vocational education reform. Annual Convention of the American Vocational Association Denver, CO. Rojewski, J.R, Lynch, R. L., & Smith, C. L. (1992). a vision for secondary vocational education.
Journal of Vocational Education Research 17 (4), p. 41-65.
Thomas, H. & Schmidt, M. (1999). Attitudes of vocational educators toward change. Annual meeting of the American Educational Research Association, Montreal.
Author
Journal of Vocational Education Research, Vol. 25 No. 1, pp. 24-36. 2000
The Effects of Gender and Years of Teaching Experience on Explanatory Style of Secondary Vocational Teachers
Bettye P. Smith University of Georgia Helen C. Hall University of Georgia
Constance Woolcock-Henry University of Georgia
Abstract
The explanatory style of 219 secondary vocational teachers in Georgia was determined using the Attributional Style Questionnaire (M.E.P. Seligman, 1984). Teachers had similar explanatory styles based on gender; they had an optimistic style. Based on years of teaching experience, teachers who had taught between 11 and 20 years were more optimistic on negative events and all events than
teachers who had taught 21 years and longer.
The education reform movement of the 1980s was primarily directed toward improving the academic skills of college-bound students; little attention was given to strengthening academic skills of those students who were not college-bound. However, during recent years, politicians and business leaders have recognized and acknowledged the need to better prepare students for the workplace (Smith & Edmunds, 1998). The Carl D. Perkins Vocational and Applied Technology Education Act of 1998 and the School-to-Work Opportunities Act of 1994 are examples of national reports that have promoted an urgency in preparing students for the workplace.
The Carl D. Perkins Vocational Education Act, first established in 1984, focused on improving vocational programs and serving special populations--such as the underemployed,
unemployed, and disadvantaged. The law was reauthorized in 1990 as the Carl D. Perkins Vocational and Applied Technology Education Act (American Vocational Association, 1993), and again in 1998 as the Carl D. Perkins Vocational-Technical Education Act (Hettinger, 1999). The most recent law, Perkins Act 1998, is expected to give states and local districts greater flexibility to develop programs while making them more accountable for student performance.
Additionally, such federal legislation as the School-to-Work Opportunities Act of 1994 (STWOA) has been designed to assist educators in preparing students to be able to respond better to workplace needs. Originally focused on youth apprenticeship, the legislation has evolved into a much more comprehensive area: school-to-work transitions. The recently enacted STWOA stimulated more significant collaboration between education and employers to help prepare a high skilled workforce (Scott & Sarkees-Wircenski, 1996).
Although legislation has been passed and funds allocated for work-based programs, implementation has to be orchestrated and executed by knowledgeable professionals. Since one characteristic of secondary vocational education programs is preparation for the workplace, implementation of work-based initiatives is likely to be the responsibility of vocational teachers. However, the success of such work-based programs is linked to the perspective of the vocational teacher toward change and adaptability. According to Pellatiro (1989), American vocational-technical schools need teachers who exhibit positive professional attitudes. A positive attitude is generally conceived as a state of readiness to respond effectively in challenging situations. Organizing and managing work-based initiatives and programs may prove to be challenging for vocational
teachers. How vocational teachers view new and different programs may be detected through explanatory style, a descriptive term used for the manner in which individuals habitually explain to themselves why life events occur as they do (Seligman, 1990).
term used to explain variations in people's response to uncontrollable events; it reflects individual differences along three dimensions in how people habitually explain good and bad events they encounter in life. The first dimension is the extent that explanations are internal “It's I” versus external “It's someone else.” The second dimension contrasts stable “It's going to last forever” versus unstable “It's short lived” elements. The third is the global “It affects everything that happens to me” versus the specific “It's only going to affect this” dimension (Gottschalk, 1996; Peterson, Buchanan, & Seligman, 1995). According to Seligman (1990), individuals who give internal, stable, and global explanations for bad events are more prone to have a pessimistic explanatory style, whereas individuals who explain bad events in terms of external, unstable, and specific causes have an optimistic explanatory style.
Seligman (1990) distinguished the beliefs of optimists and pessimists to illustrate their opposing perspectives on difficult life events. Optimists believe that defeat is a temporary, situational setback that is not their fault. Pessimists believe that bad events are long-lasting,
potentially undermining large portions of their lives, and likely to be their fault. The differing beliefs that distinguish optimists and pessimists have a direct impact upon their abilities to take actions in difficult situations.
According to some researchers, (Fry & Hibler, 1993; Moss & Johansen, 1991), optimism is described as an ability to consider challenging situations as opportunities rather than perceiving challenging situations as threatening, insurmountable tasks. Thus, whether vocational teachers view work-based education reform and initiatives as opportunities or threats may be understood using the explanatory style construct. Initially, we hypothesized that vocational teachers who adjust readily to change are needed to initiate these initiatives and work-based programs. Explanatory style has attracted research interest in recent years (Hjelle, et al.,1996; Peterson & Seligman, 1984; Phelps & Waskel, 1994; Seligman, 1990) and guided our research. The relevant studies we reviewed pertain primarily to psychology and explanatory style.
Findings from Burns and Seligman (1989) showed that explanatory style toward negative events were stable across adult life. On the other hand, explanatory style for positive events demonstrated no stability across the adult life span. They concluded that if explanatory style for negative events was a stable aspect of adult life functioning, then individuals with a dysfunctional explanatory style might be at an increased risk for depression, poor health, and low achievement throughout their lives. Likewise, Seligman and Elder (1986) found stability of explanatory style for negative events but no stability of explanatory style for positive events.
Findings were congruent from Greenberger and McLaughlin (1998) and Bunce and Peterson (1997) studies investigating gender differences. Greenberger and McLaughlin (1998) explored sex differences in attachment, coping and explanatory style. They found that females did not differ from males in explanatory style. Similarly, Bunce and Peterson (1997) found no mean differences between men and women on any dimension of the Attributional Style Questionnaire (ASQ) for either positive or negative events.
In an attempt to establish norms for the Optimism-Pessimism scale of the Minnesota Multiphasic Personality Inventory, 691 girls and 624 boys who ranged in age from 13-17 years were used. Results revealed that boys reported significantly more optimism than girls. On negative events, girls reported significantly more pessimism than boys. Additionally, for positive events and age groups, scores among the age groups (13, 14, 15, 16 and 17) were significantly different, with 16-year-olds reporting the least optimism. For negative events, scores among the age groups were significantly different; again, 16-year-old showed the most pessimism. The age and sex interaction was not significant for either positive events or negative events, meaning that the sex differences were consistent across ages (Malinchoc, Colligan, & Offord, 1996). In conflict with Malinchoc et al. was Nolen-Hoeksema, Gingus, and Seligman’s (1991) study, that found boys constantly showed more depressive symptoms and maladaptive explanatory styles than girls at an early age.
The explanatory style thesis is a new phenomenon in education; consequently, little is known about the explanatory style of teachers. Hall and Smith (1999) started the discourse on the
explanatory style of teachers with a study on vocational teachers and found they possessed an optimistic explanatory style. Vocational teachers were similar on positive events (CoPos), but different on negative events (CoNeg) and all events (CPCN). On negative events, business and marketing teachers were more optimistic than trade and industrial teachers, family and consumer sciences and marketing teachers were more optimistic than agricultural teachers. On all events, business teachers were the most optimistic of the six program areas investigated.
Conclusions from the studies we reviewed are drawn. There was no gender difference reported for explanatory style when participants were adults. However, there was a difference when
participants were younger. Adolescent boys were more optimistic than girls. Interestingly, women with a pessimistic explanatory style experienced less job satisfaction. The one study concerning explanatory style of teachers (Hall & Smith, 1999) theorized that gender and years of teaching experience might affect explanatory style.
Therefore, we attempted to determine the effect of gender and years of teaching experience on explanatory style (optimism or pessimism) of secondary vocational teachers. Objectives of the study were to determine the explanatory style of secondary vocational teachers based on gender and positive events (CoPos)--how positively/optimistically one reacts to good events, negative events (CoNeg)—how positively/optimistically one reacts to bad events, and all events (CPCN)--how positively/optimistically one reacts to all events. We were also interested in determining if differences existed on gender and positive events, negative events, and all events. Finally, we examined possible differences based on years of teaching experience and positive events, negative events, and all events.
Method
The population of secondary vocational teachers in Georgia was used to achieve the sample. Names and addresses of 3,746 vocational teachers were obtained from the Georgia Department of Education. Based on Krejcie and Morgan (1970), the number of participants for a simple random sample was established at 351. For descriptive research, using the largest sample possible is
recommended especially if the expected difference between groups is small; this difference might not show up if the samples are too small (Gay, 1987; Gall, Borg, & Gall, 1996). According to Fraenkel and Wallen (1990), the larger the sample, the more likely it is to represent the population from which it comes. The sample size was doubled since we anticipated that vocational teachers share some similarities and that differences between groups might be small. The actual sample, therefore, included 703 possible participants. Two hundred and nineteen or 31% of potential participants responded, 36% male and 61% female. Participants had a range of 1 to 35 years of teaching experience. The complexities of the questionnaire, description provided in the ensuing paragraphs, increased the chances of a low response rate. However, according to Sudman (1976), there should be at least 100 subjects in a major subgroup and 20 to 50 in minor subgroups in order to generalize. The 219 participants in this study satisfied Sudman’s principle.
Instrumentation
The Attributional Style Questionnaire (ASQ) was developed by Peterson, Semmel, von Baeyer, Abramson, Metalsky & Seligman (1982) and revised by Seligman (1984). The ASQ was designed to determine style of thinking; pessimistic or optimistic. The self-reporting questionnaire contains 12 hypothetical situations: 6 negative events and 6 positive events. Six of the questions relate to interpersonal/affiliation and six are achievement-related. Participants are asked to imagine the event happening to them. There are four responses per situation. First, respondents are asked to provide a reason or cause for the situation. This response is not scored; but is used to prepare
respondents. The second response deals with the internal or external dimension of explanation. The third response deals with stable or unstable dimension of explanatory style, and the fourth response is concerned with the global or specific dimension of explanatory style.
specific with each dimension being rated separately. On the rating scale, positive situations range from a high of 7 to a low of 1, whereas negative situations range from a high of 1 to a low of 7.
Reported reliability for ASQ subscales (internal/external, stable/unstable, and global/specific) range from .39 to .64 which are unsatisfactory. However, when composite scores are formed (CoPos, CoNeg, CPCN) substantially higher and satisfactory levels of internal consistency are found (Reivich, 1995). Composite measures have reported reliabilities of .69 and .73 for positive and negative scores, respectively. One study reported reliabilities of .72 for CoPos and .75 for CoNeg (Peterson et al., 1982). For our study, reliabilities on the composite scores of .64 (CoPos), .61 (CoNeg), and .76 (CPCN) were calculated.
The three attributional dimensions (internal, stable, and global) rating scales associated with each event description are scored in the directions of increasing internality, stability, and globality. The scales are anchored so that external, unstable, and specific attributions receive lower scores (optimistic), and internal, stable, and global attributions receive higher scores (pessimistic). So on the negative dimension, low scores are more optimistic and high scores are more pessimistic, while on the positive dimension low scores are more pessimistic and high scores are more optimistic.
For the positive events, Composite Positive Attributional Style (CoPos), the total of all positive situations scores are summed and divided by the total number of positive situations. For example, the best score is 7 multiplied by 3 questions per situations multiplied by 6 situations then divided by 6 positive situations equals 21. The worst score is 1 multiplied by 3 questions per situations multiplied by 6 situations then divided by 6 positive situations equals 3. The range of scores is from 3 to 21. This score reflects how positively or optimistically one reacts to good events.
For negative events, Composite Negative Attributional Style (CoNeg), the total of all negative situations scores are summed and divided by the total number of negative situations. For example, the best score is 1 multiplied by 3 questions per situations multiplied by 6 situations then divided by 6 negative situations equals 3. The worst score is 7 multiplied by 3 questions per situations multiplied by 6 situations then divided by 6 negative situations equals 21. The range of scores is 3 to 21. This score reflects how positively or optimistically one reacts to bad events.
For all events, Composite Positive minus Composite Negative (CPCN), is computed by subtracting the lowest scores 3 (lowest CoPos) - 21 (lowest CoNeg) = -18 and the highest scores 21 (highest CoPos) - 3 (highest CoNeg) = 18. The negative score (-18) is less optimistic (pessimistic) whereas the positive score (18) is most optimistic. Therefore, the range of scores for CPCN is -18 to 18. This score reflects how positively or optimistically one reacts to all events- a measure of overall explanatory style, optimism or pessimism.
Procedures
The data were collected using a mailed questionnaire developed by Seligman (1984) entitled The Attributional Style Questionnaire. A cover letter and questionnaire were mailed to 703
secondary vocational teachers in Georgia. The questionnaire packet included a pre-addressed, stamped return envelope. According to Dillman (1978), a follow-up postcard should be sent in approximately 14 days, and so two weeks later a postcard was mailed to 599 participants reminding them to
complete the survey. Two weeks later a second questionnaire was mailed to participants who had still not responded.
According to Miller and Smith (1983), comparing early respondents with late respondents will allow one to estimate the representativeness of late respondents to non-respondents. So as questionnaires were received, dates were recorded. After data collection ended, a t-test was used to compare early and late respondents on positive events, negative events, and all events to determine if they were different. Results revealed no statistically significant difference between early and late respondents. With the assumption that late respondents are more typical of non-respondents, generalizing from respondents to the population was warranted.
Findings
Gender
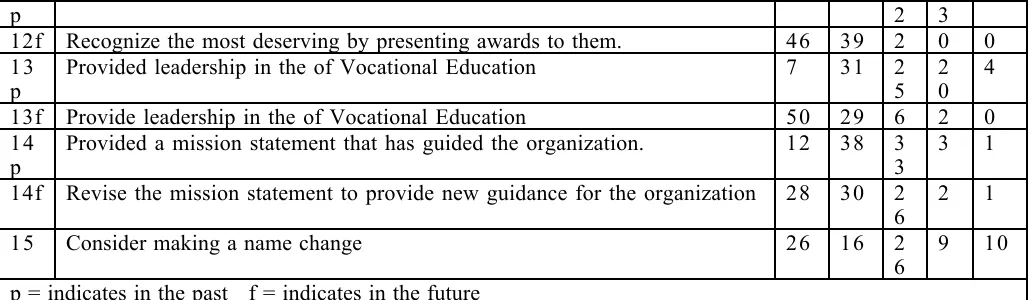
Based on mean scores that ranged from 2.46 to 15.55 (see Table 1), both males and females had an optimistic explanatory style. A t-test revealed no statistically significant differences between males and females on positive events, negative events, and all events. Therefore, it appears that male and female vocational teachers have similar explanatory styles toward negative events, good events, and all events.
TABLE 1
Composite Scores of Explanatory Style based on Gender and Years of Teaching Experience
Variables COPOS CONEG CPCN
Gender n M SD M SD M SD
Male 7 5 15.51 2.2 13.04 2.2 2.46 2.4
Female 127 15.55 2.0 12.13 2.1 3.48 2.6
Missing 8 Total 210 Teaching Experienc e
COPOS CONEG CPCN
Years n M SD M SD M SD
1-10 6 6 15.54 1.8 12.27 1.9 3.25 2.5
11-20 7 6 15.55 2.3 12.93 2.5 2.60 2.5
21-over 5 9 15.53 2.0 12.12 1.9 3.55 2.4
Missing 8 Total 210
Teaching experience
Teachers varied in their years of teaching experience. Three teachers reported 1 year of experience while another reported 35 years of teaching experience. In order to understand better the effect of teachers in various stages of their careers, teachers were sub-grouped according to number of years of teaching experience. This grouping yielded the following categories of teachers: 1-10, 11-20, 21 and over. On the Certified Personnel Data section of the Georgia Public Education Report Card, teachers are grouped in ten-year increments for years of experience (Georgia Department of Education, 1998). Teachers in this study were divided accordingly to stay with this categorization. In our study, there were only four participants with more than 30 years of teaching experience, therefore, they were included in the 21 and over group of teachers.
On years of teaching experience, frequencies were disproportionately distributed among three groups (see Table 1). The years, 11-20 received the highest number of tallies while the second highest category was 1-10 years. The lowest count was reported for the 21 years and over period.
The planned comparisons approach was used to determine if teacher groups were different on years of teaching experience and positive events (CoPos), negative events (CoNeg), and all events (CPCN). Rather than testing whether several populations have identical means, the planned comparisons approach determines whether one population mean differs from a second population mean or whether the mean of one set of populations differ from the mean of a different set of populations (Olejnik & Hess, 1997). Analysis indicated no significant difference in positive events and any teacher group. However, a significant difference was noted on negative events (M = 12.93, SD = 2.5), t(132) = 2.04, p = .04) and all events (M = 2.60, SD = 2.5), t(127) = -2.19, p = .03). The significant difference occurred on negative events (CoNeg) and all events (CPCN) between teachers who had taught 11 to 20 years and teachers who had taught 21 or more years. Teachers who had taught 11 to 20 years viewed negative events and all events more positively than teachers in the more experienced group.
Discussion and Implications
negative events to external (someone else), unstable (short-lived), and specific (not pervasive) causes rather than internal, stable, and global causes.
Second, gender had no significant effect on explanatory style as indicated by means on positive events (CoPos), negative events (CoNeg), and all events (CPCN). That is, males and females were alike in regard to pessimism and optimism. Our results are congruent with findings from studies conducted by Bunce and Peterson (1997) and Greenberger and McLaughlin (1998) who found no mean differences between males and females for either positive events or negative events. However, our findings differed from Nolen-Hoeksema et al., (1991) who found that boys showed a more maladaptive (negative) explanatory style than girls. Our findings also varied from Malinchoc et al., (1996) who found girls exhibited a more pessimism explanatory style than boys.
Third, teachers were different with respect to years of teaching experience on negative events and all events. Teachers with 11 to 20 years of teaching experience were more optimistic toward negative events and all events than teachers with 21 or more years of teaching experience. This result did not support the findings of others (Burns & Seligman, 1989; Seligman & Elder, 1986) who determined that explanatory style for negative events seem to be stable across life span;
individuals who were pessimistic about negative events were pessimistic throughout their lifetime. According to the explanatory style thesis, the difference between an optimist and a pessimist will determine how difficult situations are handled. The task of implementing, evaluating, and
revising work-based programs and other legislative mandates such as The Carl D. Perkins Vocational-Technical Education Act of 1998 and the School-to-Work Opportunities Act of 1994 can be
challenging and demanding. However, based on the results of this study, secondary vocational teachers in Georgia, regardless of gender, are optimistic and will view new initiatives as a challenge rather than a threat. We believe that these teachers will adjust well to change and are inclined to try new programs and change curricular to meet the demands of legislation and the workforce.
Concerning the difference in teachers based on years of teaching experience, we hypothesis that after 10 years of teaching, teachers have matured in their careers and will embrace change more readily. We propose that after so many years in the profession, these teachers have experienced some systematic educational reforms and are more positive and accepting of such changes. These teachers also feel less discomfort in implementing change. We also theorize that during this point in a person’s career, one is most enthusiastic, initiating, and ambitious about the profession. However, after 20 or more years of teaching, some educators are grounded in their beliefs and feel threatened by change. Based on the results of this study, we strongly recommend that teachers who have more than 10, but less than 21 years of teaching experience be pursued to initiate new programs and take a leadership role in implementing curricular changes.
Generally, in an educational environment where greater attention is given to required courses and preparation for post-high school education rather than vocational programs, these findings should support and enhance the discussion and decision making process concerning curricular changes and new mandated programs. Specifically, the optimistic disposition of vocational teachers ensures the likelihood of new programs experiencing some degree of success. Additionally, the potential for students in these work-based programs being more successful in making the transition from school to work is increased; this is achieved through modeling of behavior by vocational teachers who are optimistic.
Based on the results of this study, it is anticipated that vocational teachers will approach challenges presented by changing conditions in education in general and in vocational education specifically, optimistically.
References
American Vocational Association (1993). Vocational education today: Fact sheet. Alexandria, VA. Bunce, S.C., & Peterson, C. (1997). Gender differences in personality correlates of explanatory style.
Personality and Individual Differences, 23, 639-646.
Burns, M. O., & Seligman, M. E. P. (1989). Explanatory style across the life span: Evidence for stability over 52 years. Journal of Personality and Social Psychology, 56, 471-477. Dillman, D. A. (1978). Mail and telephone surveys: The total design method. New York: Wiley
Fraenkel, J. R., & Wallen, N. E. (1990). How to design and evaluate research in education. New York: McGraw-Hill.
Fry, B.C., & Hibler, J.A. (1993). Leadership profiles. In M. Bush & H.P. Taylor (Eds), Developing leadership in business education (pp. 10-24). Reston, VA: National Business Education Association.
Gall, M.D., Borg, W.R., & Gall, J.P. (1996). Educational research: An introduction (6th ed.). New York: Longman.
Gay, L.R. (1987). Educational research: Competencies for analysis and application. Columbus, OH: Merrill.
Georgia Department of Education. (1998). Georgia Public Education Report Card. [Online]. Available: http://www.doe.k12.ga.edu
Gottschalk, L. A. (1996). What is explanatory style? American Journal of Psychology, 109, 624-630.
Greenberger, E., & McLaughlin, C.S. (1998). Attachment, coping, and explanatory style in adolescence. Journal of Youth and Adolescence, 27(2), 121-139.
Hall, H. C., & Smith, B. P. (1999). Explanatory style of secondary vocational educators. Journal of Vocational and Technical Education, 15(2), 19-27.
Hettinger, J. (1999, January). The new Perkins...finally. Techniques, 74, 40-42.
Hjelle, L. A., Busch, E. A., & Warren, H. E. (1996). Explanatory style, dispositional optimism, and reported parental behavior. Journal of Genetic Psychology, 157, 489-499.
Krejcie, R. V., & Morgan, D. W. (1970). Determining sample size of research activities. Educational and Psychological Measurement, 30, 607-608.
Malinchoc, M., Colligan, R.C., & Offord, K.P. (1996). Assessing explanatory style in teenagers: Adolescent norms for the MMPI Optimism-Pessimism scale. Journal of Clinical Psychology, 52(3), 285-295.
Miller, L. E., & Smith, K. L. (1983). Handling non-response issues. Journal of Extension, 21, 45-50. Moss, J. Jr., & Johansen, B. (1991). Conceptualizing leadership and assessing leader attributes
(Report No. MDS-187). Berkeley, CA: National Center for Research in Vocational Education. Nolen-Hoeksema, S., Gingus, J. S., & Seligman, M. E. P. (1991). Sex differences in depression and
explanatory style in children. Journal of Youth and Adolescence, 20, 233-245.
Olejnik, S., & Hess, B. (1999). Top ten reasons why most omnibus ANOVA f-tests should be abandoned. Journal of Vocational Education Research, 22(4), 219-232.
Pellatiro, J. (1989). The power of positive attitudes for vocational- industrial teachers. Journal of Industrial Teacher Education 26(3), 59-61.
Peterson, C., Buchanan, G. M., & Seligman, M. E. P. (1995). Explanatory style: History and
evolution of the field. In G. M. Buchanan & M. E. P. Seligman (Eds.), Explanatory style (pp. 1-19). Hillsdale, NJ: Erlbaum.
Peterson, C., & Seligman, M. E. P. (1984). Causal explanation as a risk factor for depression: Theory and evidence. Psychological Review,91, 347-374.
Peterson, C., Semmel, A., von Baeyer, C., Abramson, L. Y., Metalsky, G. I., & Seligman, M. E. P.(1982). The attributional style questionnaire. Cognitive Therapy and Research, 6, 287-300. Phelps, L. H., & Waskel, S. A. (1994). Work reinforcers and explanatory style for women aged 40
to 75 years. The Journal of Psychology 128, 403-407.
Revick, K. (1995). The measurement of explanatory style. In G. M. Buchanan & M. E. P. Seligman (Eds.), Explanatory Style Hillsdale, New Jersey: Erlbaum.
Scott, J. L., & Sarkees-Wircenski, M. (1996). Overview of vocational and applied technology education. Homewood, IL: America Technical.
Seligman, M.E.P. (1984). The attributional style questionnaire. Philadelphia: University of Pennsylvania, Department of Psychology.
Seligman, M. E. P. (1990). Learned optimism. New York: Simon & Schuster.
Smith, C. L., & Edmunds, N.A. (1998). The vocational instructor’s survival guide. Alexandria, VA: American Vocational Association.
Sudman, S. (1976). Applied sampling. New York: Academic Press. Authors
BETTYE P. SMITH is Assistant Professor, Dept. of Occupational Studies, The University of Georgia, 221 River’s Crossing, 850 College Station Rd., Athens, GA 30602. [E-mail:
[email protected]] Her research interests include family and consumer education.
HELEN C. HALL is Professor, Dept. of Occupational Studies, The University of Georgia, 221 River’s Crossing, 850 College Station Rd., Athens, GA 30602. [E-mail: [email protected]] Her research interests include Family and Consumer Sciences, Vocational Teacher Education, and Leadership Development.
CONSTANCE WOOLCOCK-HENRY, Ed.D., is a recent doctoral graduate in the Dept. of Occupational Studies, The University of Georgia, 221 River’s Crossing, 850 College Station Rd., Athens, GA 30602.
Journal of Vocational Education Research, Vol. 25, No. 1, pp. 37-62. 2000
From Vocational Education and Training to Work: Representations from Two Occupational Areas1 Marcelle Hardy
Université du Québec à Montréal
Abstract
In this longitudinal and qualitative analysis, the experiences of vocational education and training students were examined as they transitioned from
secondary school to work. The study was based on 107 interviews with 28 women in Secretarial Studies and 111 interviews with 29 men in Machining Technics. Following a discussion of the family and peer influences on students’ professional orientation, the evolution of subjects’ representations of their occupation and the workplace was examined, from the beginning of their studies, through the mid-point, to the time of completion. Their professional situation one year after
graduation was then probed. Through testimonials, the students’ experiences were interpreted with respect to workplace relations, working conditions, learnings achieved, and professional aspirations. Differences and similarities between the subjects’ perceptions and realities experienced during and one year out of school are described.
The study of school-to-work transitioning by vocational high school students is contextualized by the evolution of the labor market and accompanying transformations in vocational education and training. An overview of the evolutionary characteristics of vocational education and training in Quebec and the main theoretical elements of the research served to situate my analysis of the participants’ work experience; methodological details offer insight into the nature of the research itself. Once I have outlined the students’ socio-professional characteristics and presented a description of the family and peer influences that may have affected their professional direction, the evolution of their representations over the course of their studies is examined. I then turn to their professional situation one year after leaving school and describe their appreciation of their work with respect to professional relations, working conditions, interest in the job, learnings achieved and career. Next, I compare the students’ representations during their studies with their perceptions and experiences one year after leaving school, teasing out the similarities and differences between the two periods. Finally, the limits of this study, as well as potential implications for
orienting students and preparing them for the labor market, are detailed.
Theoretical Framework
The past decades have been marked by a growing concern over the quality of workforce training with respect to labor market demands (Appelbaum & Batt, 1994; Carnevale, 1991; Conseil économique du Canada, 1992; Ministère de l’Education, 1993). This preoccupation has led to educational reforms designed to promote a sharing of agendas by industry and education, and to facilitate the transition from school to work. In Quebec2, growing pressure from industry prompted the Minister of Education to implement vocational education and training reforms (Ministère de l’Education, 1987), whereby industry and education representatives worked in tandem to revise the content of vocational curricula and methods of evaluating learning. These reforms were
accompanied by an increased requirement of one to two years of high school education prior to vocational education and training3. Introducing theoretical elements into vocational curricula was intended to promote the development of such skills as problem solving, as well as the integration of youths and adults in the same classes. Ten years later, a new Action Plan (Ministère de l’Education, 1997) has furthered the previous reforms by contributing to increased collaboration among education and industry partners, and by diversifying vocational education and training models. These reforms have been characterized mainly by curriculum changes intended to respond to employers’