Chapter 4
Data Management: Warehousing,
Access and Visualization
MSS foundation
New concepts
Object-oriented databases
Intelligent databases
Data warehouse
Online analytical processing
Multidimensionality
Data mining
4.1 Opening Vignette: Data
Warehousing and DSS at Group
Health Cooperative
2-3 million data records are processed monthly
How to manage?
How to use for decision support?
How to hold down costs?
How to improve customer service?
How to utilize resource effectively?
How to improve service quality?
Answers
Develop a comprehensive database (data warehouse)
and DSS approach
Very effective
4.2 Data Warehousing, Access,
Analysis and Visualization
What to do with all the data that
organizations collect, store and use?
Information overload!
Solution
Data warehousing
Data access
Data mining
Online analytical processing (OLAP)
Data visualization
4.3 The Nature and Sources of
Data
Data: Raw
Information: Data organized to convey meaning
Knowledge: Data items organized and processed to
convey understanding, experience, accumulated
learning, and expertise
DSS Data Items
–
Documents
–
Pictures
–
Maps
–
Sound
–
Animation
–
Video
Can be hard or
soft
Data Sources
4.4 Data Collection and Data
Problems
Summarized in Table 4.1
TABLE 4.1 Data Problems.
Problem Typical Cause
Possible Solutions (in Some Cases)
Data are not correct. Raw data were entered inaccurately.
Data derived by an individual were generated carelessly.
Develop a systematic way to ensure the accuracy of raw data.
Whenever derived data are submitted, carefully monitor both the data values and the manner in which the data were generated.
Data are not timely. The method for generating the data is not rapid enough to meet the need for the data.
Modify the system for generating the data.
Data are not measured or
indexed properly. Raw data are gatheredaccording to a logic or
periodicity that is not consistent with the purposes of the
analysis.
A detailed model contains so many coefficients that it is difficult to develop and maintain.
Develop a system for rescaling or recombining the improperly indexed data.
Develop simpler or more highly aggregated models.
Needed data simply do
not exist. No one ever stored dataneeded now.
Required data never existed.
Whether or not it is useful now, store data for future use. This may be impractical because of the cost of storing and maintaining data. Furthermore, the data may not be found when they are needed.
Make an effort to generate the data or to estimate them if they concern the future.
4.5 The
Internet
and
Commercial Database
Services
For External Data
The Internet:
Major supplier of
external data
Commercial Data “Banks”
:
Sell
access to specialized databases
Can add external data to the MSS in a
timely manner and at a reasonable
cost
DSS In Focus 4.1: Sources of External Data--A Sam
pler
Many sources of public data exist, some of which are available on the Internet. Common data sources are:
Federal Publications
Surv
e
y
of Curre
nt Busine
ss
(Department of Commerce) (continues Business Conditions Digest in short form)--monthly, general business conditionsM
onthly
Lab
or Re
v
ie
w
(Department of Labor)--monthly employment statistics (a journal with articles)Em
p
lo
ym
e
nt and
Earning
s
(Department of Labor)--monthly, more detailed than Monthly Labor ReviewOther
Inte
rnatio
nal M
one
tary Fund
--report of balance of payments, including currency rates, for participating countriesM
ood
y
's
--a series of manuals including abstracted information and balance sheets of most large U.S. corporations, intended for investorsStand
ard
&
Poo
r's
--periodically updated report of financial stability of most U.S. corporationsAd
ve
rtising
Ag
e
--marketing newspaper, with a great deal of data on marketingD
S
S
In Focus 4.1 (C
ont'd)
In
d
e
x
e
s
B
u
s
in
e
s
s
In
fo
rm
a
tio
n
S
o
u
rc
e
s
.
1
9
8
5
. R
e
v
. e
d
., L. M
. D
a
n
ie
lls
(e
d
.).
U
n
iv
e
rs
ity
o
f C
a
lifo
rn
ia
P
re
s
s
. C
a
te
g
o
riz
a
tio
n
o
f d
a
ta
b
a
s
e
s
b
y
fu
n
c
tio
n
a
l
a
re
a
o
f b
u
s
in
e
s
s
En
c
y
c
lo
p
e
d
ia
o
f B
u
s
in
e
s
s
In
fo
rm
a
tio
n
S
o
u
rc
e
s
.
U
p
d
a
te
d
a
n
n
u
a
lly
. G
a
le
R
e
s
e
a
rc
h
, In
c
. B
ib
lio
g
ra
p
h
ic
g
u
id
e
o
n
a
b
o
u
t 1
,0
0
0
b
u
s
in
e
s
s
s
u
b
je
c
ts
,
in
c
lu
d
in
g
o
n
lin
e
d
a
ta
b
a
s
e
s
En
c
y
c
lo
p
e
d
ia
o
f In
fo
rm
a
tio
n
S
y
s
te
m
s
a
n
d
S
e
rv
ic
e
s
.
U
p
d
a
te
d
a
n
n
u
a
lly
.
G
a
le
R
e
s
e
a
rc
h
, In
c
. D
e
s
c
rip
tiv
e
g
u
id
e
to
d
a
ta
b
a
s
e
s
in
e
le
c
tro
n
ic
fo
rm
T
h
e
C
D
-R
O
M
D
ire
c
to
ry
.
U
p
d
a
te
d
a
n
n
u
a
lly
. T
F
P
L P
u
b
lis
h
in
g
. In
d
e
x
o
f
C
D
-R
O
M
d
a
ta
b
a
s
e
s
(
S
o
u
rc
e
: O
ls
o
n
a
n
d
C
o
u
rtn
e
y
[1
9
9
2
], p
. 1
1
9
. U
s
e
d
w
ith
p
e
rm
is
s
io
n
.)
TABLE 4.2 Representative Commercial Database (Data Bank)
Services.
CompuServe and The Source. Personal computer networks providing statistical data banks (business and financial market statistics) as well as bibliographic data banks (news, reference, library, and electronic encyclopedias). CompuServe is the largest supplier of such services to personal computer users.
Compustat. Provides financial statistics about more than 12,000 corporations. Data Resources, Inc. offers statistical data banks in agriculture, banking, commodities, demographics, economics, energy, finance, insurance, international business, and the steel and transportation industries. DRI economists maintain a number of these data banks. Standard & Poor's is also a source. It offers services under the U.S. Central Data Bank.
Dow J ones Information Service. Provides statistical data banks on stock market and other financial markets and activities, and in-depth financial statistics on all corporations listed on the New York and American stock exchanges, plus 800 other selected companies. Its Dow J ones News/Retrieval system provides bibliographic data banks on business, financial, and general news from The Wall Street J ournal, Barron's, the Dow J ones News Service, Wall Street Week, and the 21-volume American Academic Encyclopedia.
Interactive Data Corporation. A statistical data bank distributor covering agriculture, automobiles, banking, commodities, demographics, economics, energy, finance, international business, and insurance. Its main suppliers are Chase Econometric Associates, Standard & Poor's, and Value Line.
Lockheed Information Systems. The largest bibliographic distributor. Its DIALOG system offers extracts and summaries of more than 150 different data banks in agriculture, business, economics, education, energy, engineering, environment, foundations, general new
publications, government, international business, patents, pharmaceuticals, science, and social sciences. It relies on many economic research firms, trade associations, and governmental groups for data.
Mead Data Central. This data bank service offers two major bibliographic data banks. Lexis provides legal research information and legal articles. Nexis provides a full-text (not abstract) bibliographic database of over 100 newspapers, magazines, and newsletters, news services, government documents, and so on. It includes full text and abstracts from the New York Times and the complete 29-volume Encyclopedia Britannica. Also provided is the Advertising & Marketing Intelligence (AMI) data bank, and the National Automated Accounting Research System.
The Internet/Web and
Corporate Databases and
Systems
Use
Web Browsers
to
Access vital information by
employees and customers
Implement executive information
systems
Implement group support systems
(GSS)
Database management systems
provide data in HTML
4.6 Database Management
Systems in DSS
DBMS:
Software program for entering (or
adding) information into a database;
updating, deleting, manipulating, storing,
and retrieving information
A DBMS combined with a modeling
language is a typical system development
pair, used in constructing DSS or MSS
DBMS are designed to handle large
4.7 Database Organization
and Structure
Relational Databases
Hierarchical Databases
Network Databases
Object-oriented Databases
Multimedia-based Databases
4.8 Data Warehousing
Physical separation of operational and decision
support environments
Purpose: to establish a
data repository
making
operational data accessible
Transforms operational data to relational form
Only data needed for decision support come from
the TPS
Data are transformed and integrated into a
consistent structure
Data warehousing (or information warehousing):
a solution to the data access problem
End users perform ad hoc query, reporting
Data Warehousing Benefits
Increase in knowledge worker productivity
Supports all decision makers’ data requirements
Provide ready access to critical data
Insulates operation databases from ad hoc processing
Provides high-level summary information
Provides drill down capabilities
Yields
–
Improved business knowledge
–
Competitive advantage
–
Enhances customer service and satisfaction
–
Facilitates decision making
–
Help streamline business processes
Data Warehouse
Architecture and
Process
Two-tier architecture
Data Warehouse
Components
Large physical database
Logical data warehouse
Data mart
Decision support systems (DSS) and
DW Suitability
For organizations where
Data are in different systems
Information-based approach to
management in use
Large, diverse customer base
Same data have different representations
in different systems
Characteristics of Data
Warehousing
1. Data organized by detailed subject
with information relevant for decision
support
2
.
Integrated data
3
.
Time-variant data
4
.
Non-volatile data
4.9 OLAP: Data Access and
Mining, Querying and Analysis
Online Analytical processing (OLAP)
–
DSS and EIS computing done by end-users in
online systems
–
Versus online transaction processing (OLTP)
OLAP Activities
–
Generating queries
–
Requesting ad hoc reports
–
Conducting statistical analyses
OLAP uses the data
warehouse
and a
set of tools
, usually
with multidimensional
capabilities
Query tools
Spreadsheets
Data mining tools
Data visualization tools
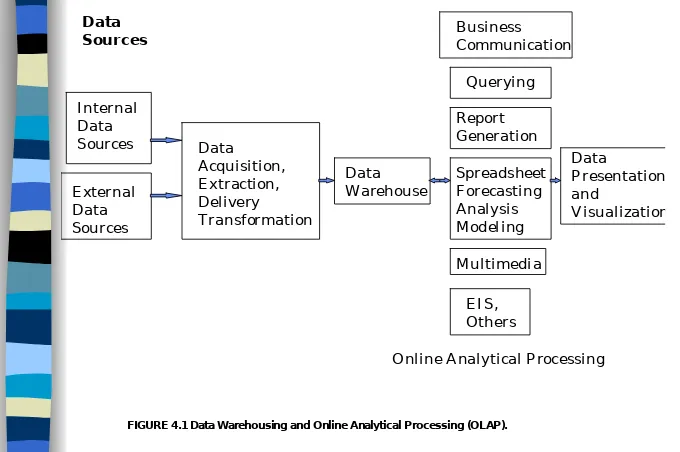
Data
Sources
I nternal
Data
Sources
E xternal
Data
Sources
Data
Acquisition,
E xtraction,
Delivery
Transformation
Data
Warehouse
Business
Communication
Querying
Report
Generation
Spreadsheet
F orecasting
Analysis
M odeling
M ultimedia
E I S,
Others
Online Analytical Processing
Data
P resentation
and
[image:23.720.17.697.50.502.2]Visualization
DSS In Focus 4.8: Database Queries
Managers may ask many questions from a computer. Here are selected representative questions that were used as benchmarks to test DSS query software by Corporate Computing (August 1992).
Query Group 1--Phone Number Queries
List the telephone numbers of the contacts at Sand Energy, particularly if this number is different from the company number or is missing. Otherwise list the main company phone number.
Query Group 2--Product Queries
List the number of units of each product that Sand Energy Company has ordered. Query Group 3--Financial Queries
List the product that is part of the largest order and that is also the product most commonly ordered.
Query Group 4--Periodic Queries
Generate a cross-tabular report of the revenues per ordering customer per product in 1992. Query Group 5--Graphing Queries
Create a pie chart that shows total dollar sales to top five customers separately, and groups total dollar sales for all other customers.
Query Group 6--Reporting Queries
Generate an order report for the latest order placed by Sand Energy Company. Include: today's date; company name; order information; line item information; total dollar amount.
(Source: Condensed from Corporate Computing, August 1992.
Using
SQL
for Querying
SQL (
Structured Query Language
)
Data language
English-like, nonprocedural, very user
friendly language
Free format
Example:
SELECT
Name, Salary
FROM
Employees
DSS In Focus 4.9: Sam
pler of SQL
Statem
ents
N
a
tu
ra
l La
n
g
u
a
g
e
S
Q
L
Lis
t o
f a
ll p
u
rch
a
s
e
s
o
f L.B
. U
n
iv
e
rs
ity
s
in
ce
Ja
n
u
a
ry
o
f 1
9
9
6
, in
te
rm
s
o
f p
ro
d
u
cts
,
p
rice
s
, a
n
d
q
u
a
n
titie
s
S
ELECT P
RO
D
U
CTS
P
U
RCH
P
RICE Q
U
A
N
TITY FR
O
M
P
U
RCH
A
S
E-H
IS
T W
H
ERE
CU
S
T-N
A
M
E EQ
L.B
.
U
N
IV
ERS
ITY AN
D
P
U
RCH
-D
A
TE G
E 0
1
/0
1
/9
6
Lis
t th
e
p
rice
o
f co
tto
n
s
h
irts
, m
e
d
iu
m
s
ize
,
w
ith
s
h
o
rt s
le
e
v
e
s
a
n
d
w
h
ite
co
lo
r
S
ELECT P
RICE, A
M
O
U
N
T-A
V
AIL FRO
M
P
RO
D
U
CT
W
H
ERE P
RO
D
-N
A
M
E EQ
CO
TTO
N
S
H
IRT A
N
D
S
IZE
EQ
M
ED
IU
M
A
N
D
S
TYLE
EQ
S
H
O
RT S
LEEV
ES
A
N
D
CO
LO
R EQ
W
H
ITE
Data Mining
For
Knowledge discovery in
databases
Knowledge extraction
Data archeology
Data exploration
Data pattern processing
Data dredging
Major Data Mining
Characteristics and
Objectives
Data are often buried deep
Client/server architecture
Sophisticated new tools--including advanced visualization
tools--help to remove the information “ore”
Massaging and synchronizing data
Usefulness of “soft” data
End-user minor is empowered by “data drills” and other
power query tools with little or no programming skills
Often involves finding unexpected results
Tools are easily combined with spreadsheets etc.
Parallel processing for data mining
Example in Figure 4.4
Data Mining Application
Areas
Marketing
Banking:
Retailing and sales
Manufacturing and production
Brokerage and securities trading
Insurance
Computer hardware and software
Government and defense
Airlines
Health care
Broadcasting
4.10 Data Visualization and
Multidimensionality
Data Visualization Technologies
Digital images
Geographic information systems
Graphical user interfaces
Multidimensions
Tables and graphs
Virtual reality
Presentations
Animation
DSS In Action 4.11: Data Visualization
To prevent systems from automatically identifying meaningless patterns in data, CFOs want to make sure that the processing power of a computer is always tempered with that of the insight of a human being. One way to do that is through data visualization, which uses color, form, motion, and depth to present masses of data in a comprehensible way. Andrew W. Lo, Director of the Laboratory for Financial Engineering at Massachusetts Institute of Technology’s Sloan School of Management, developed a program in which a CFO can use a mouse to “fly” over a
3
-D
lan
d
scap
e
re
p
re
se
ntin
g
the
risk, re
turn, and
liq
uid
ity
of a co
m
p
an
y
’s asse
ts
. With practice, the CFO can begin to zero in on the choicest spot on the 3-D landscape--the one where the trade-off among risk, return, and liquidity is most beneficial. Says Lo: “The video-game generation just loves these 3-D tools.”So far, very few CFOs are
cruising
in 3
-D
cy
b
e
rsp
ace
. Most still spend the bulk of their time on routine matters such as generating reports for the Securities & Exchange Commission. But that’s bound to change. Says Glassco Park President Robert J. Park: “What we have in financial risk management today is like what we had in computer typesetting in 1981, before desktop publishing.”(
S
o
urce
:
Condensed from: P. Coy, “Higher Math and Savvy Software are Crucial,”Busine
ss W
e
e
k,
Multidimensionality
3-D + Spreadsheets
Data can be organized the way managers like to see
them, rather than the way that the system analysts
do
Different presentations of the same data can be
arranged easily and quickly
Dimensions: products, salespeople, market
segments, business units, geographical locations,
distribution channels, country, or industry
Measures: money, sales volume, head count,
inventory profit, actual versus forecasted
Time: daily, weekly, monthly, quarterly, or yearly
Multidimensionality
Limitations
Extra storage requirements
Higher cost
Extra system resource and time
consumption
More complex interfaces and
maintenance
Multidimensionality is especially
4.11 Intelligent Databases and
Data Mining
Developing MSS applications requires
access to databases
AI technologies (ES, ANN) to assist
database management
Integration Example in Figure 4.5
Link ES to large databases
Example: query optimizer
Natural language interfaces
Intelligent Data Mining
Use intelligent search to discover
information within data warehouses that
queries and reports cannot effectively reveal
Find patterns in the data and infer rules from
them
Use patterns and rules to guide
decision-making and forecasting
Five common types of information that can
Main Tools Used in
Intelligent Data Mining
Case-based Reasoning
Neural Computing
Intelligent Agents
Other Tools
–
decision trees
–
rule induction
–
data visualization
Summary
Data for decision making come from internal and
external sources
The database management system is one of the
major components of most management support
systems
Familiarity with the latest developments is critical
Data contain a gold mine of information if they
can dig it out
Organizations are warehousing and mining data
Multidimensional analysis tools and new
Summary (cont’d.)
Object-oriented approach to
systems analysis, design, and
implementation may prove useful
New data formats for multimedia
DBMS
Internet and intranets via Web
browser interfaces for DBMS
access
Built-in artificial intelligence
methods in DBMS
Questions for the Opening
Vignette
1.
Use the Holsapple and Whinston classification system
and identify the categories of the DSS applications in
the case.
2
.
Identify the driving forces that led to the creation of
the data warehouse.
3
.
Comment on the sources of data.
4
.
Identify the decisions supported by the data
warehouse.
5
.
Read the article: Braley, D. (1996, February). “System
Purchases Support Vendors’ Visions.”
Health
Management Technology.
Vol. 17. No. 2. 13-14.
Exercise 4
The U.S. government spends millions of dollars gathering
data on its population every 10 years (plus some
mid-decade corrections). Census data are critical in
determining the representation of each state in the House
of Representatives and the number of Electoral College
votes to which each state is entitled for Presidential
elections. More importantly, census data provide
information about U.S. markets. The demographics
indicate family and gender make up, incomes, education
level, etc. for the states, metropolitan statistical areas
(MSA), and counties. Such data are available from various
sources including books, disk, CD-ROM and the World
Wide Web (see Internet Exercise 5). In this exercise, we
take a real-world view of external, but readily available
data.
1. Find an electronic source of standard census
data files for the states and MSAs.
2. Access the data and examine the file structures.
Do the contents and organization of each make
sense? Why or why not? If not, suggest
improvements.
3. Load the state P1 data population table into a
spreadsheet file (Excel if possible) and into a
database file (ACCESS if possible). How difficult was
this? How could this have been made easier? Don’t
forget to delete the comments and U.S. totals (if
present) at the top, for later use. Note that
4. Using the state P1 population data, sort the
data, based on population size. What are the five
most populated states, and the five least
populated states? Which five states have the
largest and smallest population densities? Which
state has the most males and which state has
the most females? Which three states have the
most people living on farms, and which state has
the least lonely people? Which file type
(spreadsheet or database) did you use and why?
What features made it easy to do these
analyses?
5. Load the State Basic Table P6 (Household
Income) into a spreadsheet or database file.
6. Data warehousing and data mining are
used to combine data and identify patterns.
Using data (load and save them into
spreadsheet or database files) from files:
a) P1 Population
b) P3 Persons by Age
c) P4 Households by Size
d) P6 Household Income
e) P8 Other Income Measures
f) P9 Level of Education.
Synthesize these tables into a usable set and
determine if there are any relationships at the
state level between:
Population per square mile and education
Income and age
Household size and education
Can you think of any other relationships to
7. Examine the MSA data tables and
see if any of the relationships found
for the state data above hold.
8. How does your MSA (or one
closest to where you live) compare to
your state’s census profile and that
of the entire United States? How did
you determine this?
Group Exercise
One of the most difficult tasks in any large
city is traffic law enforcement. According to
PCWeek
, Nov. 13, 1993, p. 63, a solution to
the problem can be found in a
client/server-based data warehousing system. Read the
article and then visit your local traffic
enforcement agency.
a
)
Review the current information system.
b
)
Identify problems in the existing system.
c
)
Explain how a system like the one
Case Application 4.1: Data
Warehousing at the Canadian
Imperial Bank of Commerce
2nd largest bank in Canada
One of the top 10 banks in North America
Decision support applications supported by a data
warehouse
Data warehouse provides diverse decision-making
support
Analyses supported include customer traffic patterns at
branches
Data warehouse evolved over time
The secret is to hold the data at the event level and
summarize them to the level of granularity appropriate
for specific queries
Statistical modeling and consulting
Supports EIS
Benefits of the Data
Warehouse Structure
Data integrity
Consistency across time lines
High efficiency
Low operating costs
Can store data at different levels of
summarization
Appendix W4-A: Object-oriented
Systems Analysis, Design and
Programming
W4-A.1 Introduction to the
Object-Oriented Approach
Objects are created and
manipulated, rather than ‘items’ in
programs
Objects have
Certain features or attributes
Exhibit certain behaviors
Objects can be grouped and
classified, like real-world objects
Specific objects (a specific person)
have certain attributes by being in a
class (employees, citizens,
customers, etc.)
An object knows what it is and what
it can do
W4-A.2
Object Think
The system analyst focuses on the user
requirements that lead directly to the definition
and subsequent development of objects
Objects have characteristics that they exhibit,
and inherit characteristics directly from their
class, and from their “parents”
Example: University library
Class of objects called “books”
Class of objects called “borrowers
W4-A.3 Important
Object-Oriented Approach
Terminology
Object: a thing - a specific instance
An object knows what it is and what it can do
Class: a type of thing, and all specific things that fit
the general definition of the class belong to the class
Like a data entity type when modeling data
A class is the general category and an object is a
specific instance
Attributes of a Class: The attributes that all of the
objects in the class share define a class of objects
The attribute values are part of what an object knows
when using the object think approach
Association Relationships:
Objects may be related to other objects
These are similar to relationships in a data model.
A relationship is an association based on the
context in which we view objects, e.g., a natural
association
These relationships have names, can be optional or
mandatory, and have cardinality
Whole-part Relationships:
Stronger than association relationships
Methods or Services of a Class:
A method is something the object knows
how to do
Service is something that the object knows
how to do for a requester
Standard services:
all objects know how to
do
Complex services:
custom designed for the
class of objects
Encapsulation or Information Hiding:
Encapsulation
means packaging several items together into
one unit
Packaging both the attributes and services of the class
together so that the object knows things (attributes) and
how to do things (services).
We
hide
the internal structure of an object from the
environment
Message Sending:
End users can send messages to objects to perform a
service
Objects can send messages to other objects
Polymorphism (Multiple forms):
Different kinds of related items
Inheritance, Classification Hierarchies
and Reuse:
Classification hierarchies allow classes of
objects to inherit attributes from larger
classes
Allows for object reuse
Pre-defined classes of interface objects
W4-A.4 The
Object-Oriented System
Development Cycle
1. Object-Oriented Analysis
2
.
Object-Oriented Design
3
.
Object-Oriented
Object-Oriented Analysis
Define system requirements
through scenarios or use cases
Then, build an object model with
the capability to satisfy the
requirements
Output: requirements model
Object-Oriented Design
The requirements model created in
the analysis phase is enhanced in
the design phase.
Sometimes more attributes and
services are added
Object-Oriented
Implementation
Usable system is developed
Use object-oriented programming
languages
If needed, provide links to a separate
database management system
Object-Oriented CASE Tools
New capabilities are being developed
W4-A.5 Object-Oriented
Programming Languages
Pure
–
Smalltalk
Hybrid:
–
C++
Also:
–
Object-oriented Cobol
–
Ada
–
Objective C
–
Object Pascal
–
Actor
–
Eiffel
W4.A-6 Object Oriented
Database Management
Systems
The database system must
1
.
Support complex objects
2
.
Support object identity
3
.
Allow objects to be encapsulated
4
.
Support types or classes
5
.
Support inheritance
6
.
Avoid premature binding
7
.
Be computationally complete
8. Be extensible
9. Be able to remember data locations
10
.
Be able to manage large databases
11
.
Accept concurrent users
12
.
Be able to recover from
hardware/software failures
13
.
Support data query in a simple way
Strengths and
Weaknesses of an
Object-Oriented Database
Strengths
1
.
Data Modeling
2
.
Nonhomogeneous data
3
.
Variable length and long strings
4
.
Complex objects
5
.
Version control
6
.
Schema evolution
7
.
Equivalent objects
8
.
Long transactions
9
.
User Benefits
Weaknesses
1
.
New problem solving approach
2
.
Lack of a common data model
with a strong theoretical foundation
3
.
Limited success stories
Companies
Versant Object Technology Corp. (Menlo
Park, CA - Versant ODBMS)
KE Software Inc. (Vancouver, BC -
http://www.kesoftware.com/ - try the
demo)
O
2
Technology (Palo Alto, CA -
http://www.o2tech.fr/ - try the demo)
Object Design Inc. (Burlington, MA)
Hewlett-Packard Co. (OpenODB)
Itasca Systems Inc. (Itasca Distributed
Management System)
Object Design Inc. (ObjectStore)
Objectivity Inc. (Objectivity/DB)
Ontos Inc. (Ontos DB)
Servio Corp. (Gemstone)
UniSQL Inc. (UniSQL/X,
W4-A.7 Commercial
Applications of the
Object-Oriented Approach
From enterprise information systems,
maintenance management and financial
applications to Geographical Information
Systems
EDS’s Maintenance Management System (MMS)
Time Warner Communications: a variety of
business applications
Sprint Corp. developed an object-oriented
order-entry sales system to speed the providing of
phone service
W4-A.8 Summary and
Conclusions
Many demonstrated successes
But a paradigm shift is required
The entire organization must adopt
object-think
Revolutionary change
TABLE W4.1 The Benefits and Potential Problems of the Client / Server
Architecture.
Feature
Benefit
Potential Problems
Networked webs of
small, powerful
computers
If one machine goes down,
your business machines stay
up. The appropriate task may
be run on the appropriate
computer
No one machine may be capable of storing the
entire database
No one machine may be capable of performing
necessary computational tasks
Parts don’t always work together. There are
several possible culprits when something goes
wrong
Designing the division of work between client
and server may be complicated
Computer arrays with
thousands of MIPS;
clients' aggregate
MIPS beyond
calculation
The system provides the power
to get things done without
monopolizing resources.
End-users are empowered to work
locally
Coordination of efforts and communication
contention may occur
Some workstations are
as powerful as
mainframes, but cost
90% less
By giving you more power for
less money, the system offers
you the flexibility to make
other purchases or to increase
your profits
You locate or build support tools yourself
The software developed for the Mac or
Windows is different from that for mainframes
The computational power may be underutilized
Open systems
You can pick and choose
hardware, software, and
services from various vendors
Too many options and / or incompatible
systems may be difficult to manage and
maintain
TABLE W4.1 The Benefits and Potential Problems of the Client / Server
Architecture (cont'd).
Feature
Benefit
Potential Problems
Systems grow easily
and are infinitely
expandable
It's easy to modernize your
system as your needs change.
Expanded capacity may be
added incrementally
Continual upgrades may cause incompatible
software problems
Older machines may not run newer software
Individual client
operating
environments
You can mix and match
computer platforms to suit the
needs of individual
departments and users
Managing and maintaining a variety of small