Value Chain of the Artisanal Oyster
Harvesting Fishery of The Gambia
Momodou Njie, Ousman Drammeh
Gambia-Senegal Sustainable Fisheries Program
(Ba Nafaa)
This publication is available electronically on the Coastal Resources Center’s website at
http://www.crc.uri.edu. For more information contact: Coastal Resources Center, University of Rhode Island, Narragansett Bay Campus, South Ferry Road, Narragansett, Rhode Island 02882, USA. Tel: 401) 8746224; Fax: 401) 7894670; Email: [email protected]
Citation:, Momodou Njie and Ousman Drammeh, 2011, Value Chain of the Artisanal Oyster Harvesting Fishery of The Gambia, Coastal Resources Center, University of Rhode Island, pp.74
Table of Contents
Abbreviations and Acronyms ... vi
1.0 Introduction... 1
2.0 The Oyster Value Chain Assessment Study ... 1
3.0 Overview of the Oyster Fishery in The Gambia ... 4
3.1 Oyster Harvesting Practices...7
3.2 Background to the Study Site – the Tanbi Wetlands Complex...9
4.0 Mapping the Oyster Value Chain Actors and Functions ... 11
4.1 Oyster Harvesters ...11
4.2 Oyster Processors and the Processing of Oysters and Cockles...16
4.3 Oyster Sellers and the Marketing of Oysters and Cockles...22
4.4 Buyers and Consumers and the Utilization of Oysters and Cockles...24
4.4.1 International Markets for Oysters ...26
4.5 Other Oyster Value Chain Actors...27
4.5.1 Canoe Owners/ Hirers of Oyster Harvesting Canoe ...27
4.5.2 Supply of Firewood for Oyster Processing ...28
4.5.3 Financing of Oyster Workers ...28
4.6 Production of White Lime from Oyster Shells ...28
4.6.1 The White Lime Production Process...30
5.0 Costs and Revenues in the Oyster Harvesting and Lime Making Value Chains ... 32
5.1 Costs and Revenues in the Oyster Harvesting Value Chain ...32
5.1.1 Fixed Assets in Oyster Harvesting ...32
5.1.2 Fixed Assets in Oyster Processing and Marketing ...33
5.1.3 Depreciation of Fixed Assets in Oyster Harvesting Processing and Marketing...34
5.1.4 Total Capital Projection ...36
5.1.5 Average Revenues from Oyster Harvesting Business Enterprise ...37
5.1.6 Net Revenues from Oyster Harvesting...38
5.1.7 Net Worth of Investment in the Oyster Harvesting Enterprise at End of One Season ...39
5.2 Cost and Sales Accounting on Production of White Lime from Oyster Shells ...40
5.2.1 Estimation of the Profitability of Production of White Lime from Oyster Shells...42
6.0 Profile of the Enabling Environment for Oyster Harvesting ... 43
6.1 National Policy relating to the Oyster Industry ...43
6.2 Increasing Visibility of the Oyster Harvesting Sector ...44
7.0 Synthesis of Constraints on Oyster Harvesting, Processing, and Marketing ... 45
8.0 Opportunities and Recommended Priority Actions ... 46
8.1 Natural Resources Management and Comanagement Options for Oyster Resources ...46
8.2 Strengthening Oyster Associations...46
8.3 Improving Product Quality and Safety along the Value Chain ...47
8.4 Upgrading Oyster Processing ...48
8.5 Enhancing Local and Export Markets and Wealth Creation...49
8.6 Enhanced InterFirm Cooperation and Opportunities for Tapping Export Markets ...49
8.7 Other Opportunities and Priorities for Increasing Wealth from the Oyster Industry...50
References... 51
Appendix 1: Questionnaires for The Gambia Oyster Fisheries Value Chain Assessment ... 52
List of Figures
Fig. 1: Interview and focus group discussions with oyster harvesters ... 2
Fig. 2: Focus group discussion session with oyster harvesters ... 3
Fig. 3: Interview with key informant producer of white lime... 3
Fig. 4: The Gambia marine and estuarine ecosystems ... 6
Fig. 5: Oysters growing in the intertidal zone on the mangrove prop roots system... 7
Fig. 6: Oyster harvesters in oyster canoes... 8
Fig. 7: Overexploited mangrove oyster harvesting site ... 8
Fig. 8: The Tanbi Wetland Complex ... 10
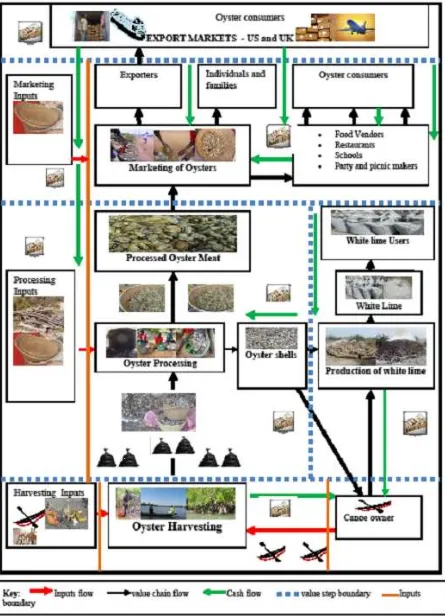
Fig. 9: The oyster industry value chain map ... 14
Fig. 10: Oyster harvesting and processing equipment and tools... 15
Fig. 11: Oyster harvester... 16
Fig. 12: Collected firewood for oyster and cockles processing ... 17
Fig. 13: Oyster cooking setup ... 17
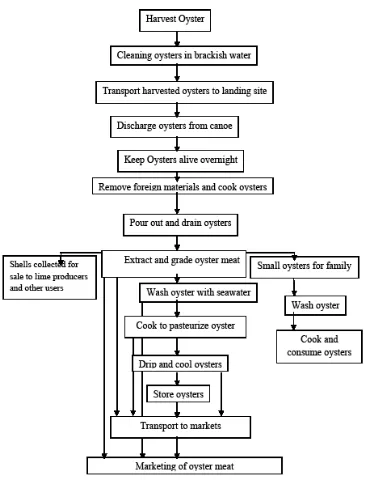
Fig. 14: Generalised process flow diagram for oyster production ... 18
Fig. 15: Extraction of oyster meat from shells after cooking... 19
Fig. 16: Two varieties of a day’s harvest of oysters processed... 19
Fig. 17: Oyster harvesters relax in the shade of a tree ... 20
Fig. 18: Cockles cooking setup for cooking operation during processing... 20
Fig. 19: Sieving out and hand picking of cockle meat from cooked cockles during processing ... 21
Fig. 20: Washing and recooking of cockle meat during processing ... 21
Fig. 21: Processed cockle meat following final wash and recooking – ready for market ... 22
Fig. 22: Oyster marketing ladies at an oyster selling point on the roadside along the highway ... 22
Fig. 23: Medium size oysters ... 23
Fig. 24: Measuring out oyster meat during marketing ... 23
Fig. 25: Team of oyster harvesters complete the harvest cycle ... 24
Fig. 26: Oyster shells being accumulated for selling to producers of white lime ... 29
Fig. 27: Lime producer ... 30
Fig. 28: Lime production setup ... 30
Fig. 29: Lime production in process: ... 31
Fig. 30: Filled bags of white lime produced from oyster shells... 31
List of Tables
Table 1:The nine Tanbi Wetlands... 2
Table 2: Number of Oyster harvesting operators at selected sites ... 12
Table 3: Number of canoes available to oyster harvesters... 12
Table 4: Social and demographic information on oyster harvesters ... 13
Table 5: Results of interview with five food vendors ... 25
Table 6: Oyster balance sheet for food vendor buying and selling of oyster food ... 26
Table 7: Annual export quantities of oysters ... 27
Table 8: Fixed assets in oyster harvesting/season... 32
Table 9: Fixed assets in oyster processing per season ... 33
Table 10: Fixed assets in oyster marketing/selling per season ... 34
Table 11: Operating costs ... 34
Table 12: Economic lifespan and depreciation of oyster harvesting fixed assets ... 35
Table 13: Economic lifespan and depreciation of oyster harvesting fixed assets ... 35
Table 14: Economic lifespan and depreciation of oyster marketing/selling fixed assets... 36
Table 15: Total depreciation of fixed assets (with canoe) ... 36
Table 16: Total depreciation of fixed assets (without canoe) ... 36
Table 17: Total capital projection with canoe... 36
Table 18: Total capital projection without canoe... 37
Table 19: Estimated average quantity of processed oysters produced and income per harvester... 37
Table 20: Profitability of the oyster harvesting business with canoe for one year ... 38
Table 21: Profitability of the oyster harvesting business without canoe for one year ... 38
Table 22: Net worth of the investment with canoe as at end of one year of operation ... 39
Table 23: Net worth of the investment without canoe as at end of one year of operation... 39
Table 24: Input items and costs in production ... 41
Table 25: Input items and costs in production of average batch of white lime... 41
Table 26: Profitability of lime production at real cost per batch of lime produced ... 42
Table 27: Profitability of production of white lime at minimized cost per batch of lime produced ... 42
Table 28: Estimates of total earnings of lime producers... 43
Abbreviations and Acronyms
AFDP Artisanal Fisheries Development Project
BADEA Arab Bank for Economic Development
CCLME Canary Current Large Marine Ecosystem
CFC Community Fisheries Centers
CMC Central Management Committee
HACCP Hazard Analysis and Critical Control Point
1.0 Introduction
The Government of The Gambia accords high priority to the development of the artisanal fisheries sub sector because of its important role in providing much needed protein and employment opportunities, and to help reduce poverty, malnutrition and ruralurban migration.
The policy objectives of the fisheries sector are linked to key national development objectives as outlined in the Poverty Reduction Strategy Paper and the Gambia Incorporated Vision 2020, which are blueprints for eradication of poverty and the attainment of national social and economic development. National development objectives include increased food selfsufficiency and security; a healthy and productive population; enhanced employment opportunities for nationals; increased revenue generation and foreign exchange earnings; the attainment of national social and economic development; and the integration of women in the development process as equal beneficiaries and partners. The organization of fisherfolk communities into strong and viable interest groups and their active involvement and participation in all stages of the development process as equal partners and beneficiaries is key to the attainment of the sectoral policy objectives.
Oyster harvesting is an important source of income for poor families around the Tanbi wetlands and important food source in The Gambia. The purpose of this value chain assessment is to gain a better understanding of the artisanal oyster harvesting fishery and to identify opportunities to improve cooperation and effectiveness across subsector participants in order to increase wealth and equity. The value chain approach helps to enhance the competitiveness of sectors, identify and understand both the major opportunities for upgrading and the driving constraints to market growth, and to generate recommendations for priority actions that can result in increased benefits for oyster fishery sector participants.
2.0
The Oyster Value Chain Assessment Study
The objectives of the oyster value chain study are to:
ク Assess the value of oysters as well as income generated at each level of the value chain
ク Identify priority actions with the greatest potential to provide valueadded benefits at each level of the value chain, including oyster collection and equipment, landing and handling, financial markets/credit, wholesale and retail sale, processing, and marketing
ク Characterize the business enabling environment (national policies and regulations, organization of oyster collectors, public infrastructure, conflicts), competitiveness, and product quality
ク Provide a good understanding of gendered roles in the value chain, including harvest, processing, marketing and sales
ク Identify opportunities for new local markets at wholesale and retail levels and potential for export markets
1) and administered with respondents from nine selected oyster landing and processing sites. The approach used participatory rapid appraisal tools and methods such as focus group and key informant discussions and the administering of formal interview questionnaire to collect data and capture important information. Relevant research organizations, and industry groups and organizations were also consulted and discussions held with them. Finally, oyster buyers and consumers such as restaurant operators, food vendors, individual buyers and housewives were also interviewed and data collected on their purchase and use of oyster products.
Table 1:The nine Tanbi Wetlands oyster harvesting communities involved in the value chain assessment study
Oyster harvesting community sample sites
1. Abuko 6. Kartong
2. Ibo Town 7. Kubuneh
3. Faji Kunda 8. Lamin
4. Jeswang 9. Mandinary
5. Kamalo
The analysis took into account and built on other relevant studies and the work of other fisheries programs and projects and their activities, such as the USAID Wula Nafaa program in Senegal and its oyster component, and the USAID Ba Nafaa project activities in The Gambia, which also support the oyster industry.
Fig. 1: Interview and focus group discussions with oyster harvesters in Kartong (left) and Kubuneh (right)sites.
Fig. 2: Focus group discussion session with oyster harvesters in the Kubuneh landing and processing site
Fig. 3: Interview with key informant producer of white lime from oyster shells on production site in Kubuneh
3.0
Overview of the Oyster Fishery in The Gambia
The oyster fishery is an important and unique subindustry of the artisanal fisheries industry and oysters are of significant economic importance in The Gambia. It provides employment and income, food and revenue. While men dominate fishing in general, the harvest and collection of oysters is dominated by women who carry out all the different operations of harvesting, processing and marketing. Many of the women are first and second generation migrants from Guinea Bissau and the Casamance, Senegal (Theisen, 2010). Occasionally men assist in the harvest in partnership with closely related women (usually their spouses and relatives), but processing and sales is entirely women.
Oyster harvesters exploit oysters for commercial purposes. The oyster meat when extracted from the shell is sold out to consumers and fetches income for the producers. The meat has a high protein content and is an important source of dietary protein. Oysters are harvested seasonally, normally in the dry season, from March to June when mature oysters are removed from the wild, processed and marketed. Oysters are found in the wild attached to mangrove growths (roots and branches) in the estuarine areas, on both banks of the River Gambia and its tributaries in many localized areas (mainly in intertidal zones).
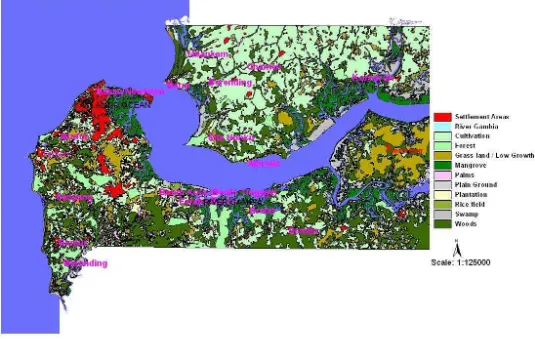
The River Gambia which takes its source from the Futa Djallon Highlands in Guinea flows through east Senegal and down the entire length of The Gambia to empty into the Atlantic Ocean. As it approaches the Atlantic Ocean, the river slows down and forms a number of tributaries. The mixing of sea and fresh water inflows from the river results in the characteristic brackish waters of the Gambia River estuary that provides the right environmental factors for the growth and development of mangroves and oysters, and extends from the mouth of the River in coastal areas to about 160 kilometres inland, shifting above and below this limit depending on tidal and seasonal variations in water inflows (Figure 4).
The River Gambia runs centrally along the entire length of the country and hosts a diversity of fish species in the estuarine and freshwater regimes with shrimp and shellfish also in the estuary where mangroves fringe the river and provide ideal habitat for a diversity of aquatic organisms, particularly oysters that attach to mangrove root substrate. The river ecology provides important breeding and feeding grounds for fishery resources with potential for aquaculture development. According to a poverty
profiling study of artisanal fisheries communities, fishing and fishing related activities including oyster harvesters, constitute the second most important livelihood activity after farming, in communities along the banks of the River Gambia (Njie et al, 2003/4).
Data on oyster and other shellfish production, which are significant sources of livelihoods, are generally unavailable because it has not been part of the countrywide Frame survey design and data collection effort of the fisheries sector. Limited surveys have been conducted on the oyster and other shellfish fishery including on the oyster communities and their activities.
In the Tanbi Wetlands Complex, which is the main focus of this value chain assessment study, it was estimated that there are about 507 harvesters, predominantly women, who are involved in this laborious but valuable occupation for their living and that hundreds more could be involved in related activities including production of white lime from oyster shells.
Despite the important contributions of oyster harvesting to the social and economic conditions of coastal communities, fisheries development policy and planning have given little attention to the oyster fishery. There are no formal fisheries management and conservation measures specific to the oyster fishery. The Wildlife conservation and management Act, however, provides for conservation measures on the
mangroves and other aquatic organisms of the coastal zone and the Fisheries Act 2007 allows for fisheries resource comanagement.
With the fisheries policy objectives of increased food security and livelihoods’ improvement for the rural population, one strategy involves the promotion of aquaculture (commercial and smallscale, including oyster culture) development. The expected outcomes under this strategy include increased generation of foreign exchange earnings from export of aquaculture products, sustainable oyster production (throught the rackculture system), reduced destruction of mangroves, and increased local supply of oysters to meet demands both in the domestic and international market.
The development of oyster culture in The Gambia became a stated priority for Government from the 1980’s. The Department of Fisheries conducted research studies on the culture of the mangrove oyster of West Africa Ostrea (Crassostrea) tulipa through a research project funded by Canadian International Development and Research Cooperation (IDRC). Results of the studies including monitored culture trials identified great commercial potentials for the products but the market was not adequately identified. The rack system of culture employed by the research project was indicated to prove a more efficient method for the exploitation of oysters and is a more sustainable alternative than existing harvest methods which are destructive to the mangrove ecology. Policy makers want to encourage less destructive methods, increase oyster production as well as improve access to credit facilities for low income producers.
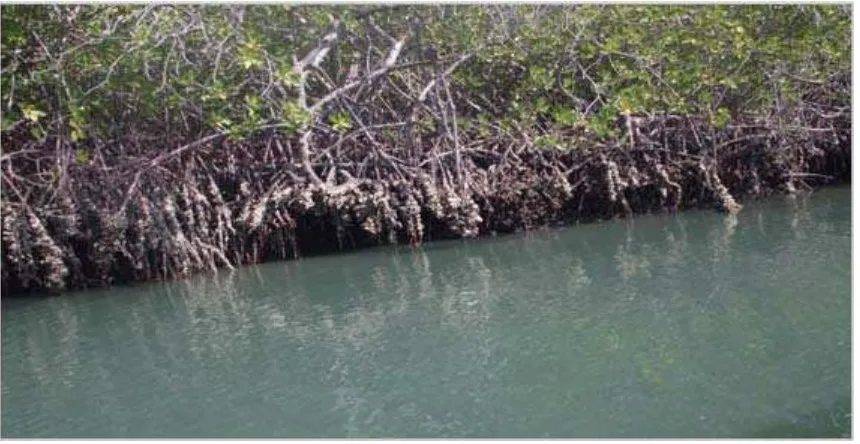
Mangrove oysters (Crassustrea spp.) are found in the brackish water areas and are important source of livelihoods for oyster harvesting communities. Apparently, only one species of oyster (Crassustrea tulipa) is found in The Gambia. Juvenile oysters or oyster spats from spawned oysters swim in the water and get attached to mangrove prop roots from where they feed as the tides rise and fall. Here they grow in competition with each other and other organisms to mature into adults that spawn to repeat the lifecycle, thereby continuing to provide valuable source of livelihoods to the specialized groups of mainly women harvesters in estuarine areas. These harvesters extract the mangrove oysters that are processed and marketed for income and food. The highly proteinrich oyster meat also provides a healthy source of protein supplement for families of oyster harvesters as for all consumers.
Fig. 5: Oysters growing in the intertidal zone on the mangrove prop roots system
3.1 Oyster Harvesting Practices
Fig. 6: Oyster harvesters in oyster canoes en route to oyster harvesting on mangrove fringes
The harvest grounds used to be within close range during the 1950s to the 1970s. However, increased entry and harvesting intensity has compelled harvesters to now travel longer distance by canoe in search of less exploited oyster sites. The use of destructive harvesting techniques is a contributing factor to the rate of depletion of nearby oyster stocks.
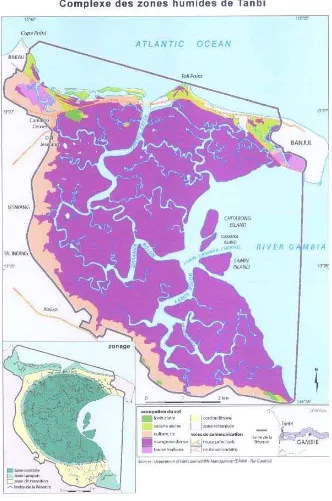
3.2 Background to the Study Site – the Tanbi Wetlands Complex
The value chain assessment was focused on the artisanal oyster harvesting communities of the oyster industry of the Tanbi Wetlands Complex which is located on the South Bank of the River Gambia, in the vicinity of the capital of Banjul, and spreading southwards. The Tanbi wetlands complex was declared a Ramsar site in February, 2007 meaning that it is a protected area by the international convention for the preservation of wetlands and its natural resources. The geographic coordinates of Tanbi are: 13o26’N and 16o38’W. It covers a total area of about 6,300 hectares of which 4,800 hectares (76%) are covered by mangroves. There are small patches of saline mudflats between the mangroves and ricefields, which border part of the site to the south and west. In the north, the main highway linking Banjul to the mainland roughly follows, for some 10 km, the boundary between the mangrove and the shifting sand beaches and tidal lagoons of the Atlantic coast. In the extreme northwest there is a small area of freshwater marsh around Cape Creek.
The widest expanse of the Tanbi is located a few kilometres to the southeast of Banjul. The northern most point skirts the Bund Road in the southwest periphery of the city of Banjul, created to stabilize the land around Banjul. Here, there are several shallow lagoons whose tidal ranges are controlled from a water pumping station on the Bund Road. There are large expanses of mudflats on the river immediately south of these lagoons and at the Mandinari flats, 5 km upriver. It also includes the Cape Creek in the Cape point in Bakau and encompasses the fringes of the island of St. Mary at its Atlantic Ocean side and down southeast to Lamin and Mandinari.
The species of mangroves in the wetlands area include the Avicennia africana, Alder Conocarpus, Laguncularia racemosa, Annona glabra and the Rhizophora. The dominant mangrove species are the Avicennia mangrove shrub and the taller Rhizophora mangrove typically located near tidal creeks (or bolongs). Baobab trees and palm trees can be found in the Tanbi wetlands on more solid ground. The vegetation gradually changes to bare flats, salt marsh, and dry woodland or grass woodland to the west and south, with agricultural uses in the bordering zones. The Tanbi wetlands complex plays a key role in water retention and shoreline stabilization as it acts like a giant natural sponge for rainwater and tidal river flows.
A wide variety of animals inhabit the area, including small monkeys, crocodiles, lizards, and at least 360 bird species (including greyheaded gulls, malachite kingfishers, pigmy sunbird, rednecked falcon, pelicans and storks). Threatened or endangered animal species in the Tanbi include the West African manatee, Pel’s fishing owl, the African clawless otter, brownnecked parrot and the Western Red Colobus.
There is fast growing population in the area with several hundred thousand people living within 5 km of this wetland. Several hotels are located on the Atlantic coast and industrial development and sand mining take place with rice cultivation and vegetable gardening encroaching into the freshwater marsh. Shrimp fishing and oyster gathering are intensive in some areas. There is uncontrolled dumping around the edge of the wetland. The mangrove is vulnerable to large scale land reclamation due to the surrounding population density, urban development and commercial demand for land.
Some fifteen communities make up the majority of oyster and cockles harvesters concentrated in the Tanbi Wetlands. In recent years, with the support of sympathizers, the harvesters are now organized into a registered producer association called The Oyster Women’s Association (TOWA), previously know as the TRY Association, which is an affiliation of various local community groups and individual oyster harvesters. TRY members have defined the issues that need to be addressed in the oyster industry. These include improved processing, quality and hygiene, as well as alternative livelihoods for members during the closed season for oyster harvesting. TRY and the women harvesters are preparing an oyster
management plan that includes limiting access by establishing territorial use rights. The USAID funded GambiaSenegal Sustainable Fisheries Project (Ba Nafaa) is providing support to the TOWA Association and oyster harvesting fishery in resource management planning, oyster culture, processing and sales, and capacity development..
Seasonal closure of oyster harvesting during the rainy season was initially linked to the traditional belief that eating oysters during this season is harmful (even though most oysters are heat treated by cooking before consumption). However, it is now becoming obvious to harvesters that seasonal closure of the fishery results in bigger size oysters and replenishes populations. TOWA Association members recently agreed for the first time to delay the 2009/2010 harvesting season until March 2010 (instead of December 2009), to allow for even greater growth of the oysters, protect wild mature oysters as a source of spat and to protect the mangrove from damage during the harvest of the wild stock.
4.0
Mapping the Oyster Value Chain Actors and Functions
The oyster value chain described below comprises harvesting, processing, markets, and sales. Appendix 2 describes in detail the generalized chain of activities in oyster harvesting, processing and marketing. The full value chain that is described in detail in this section is shown in Figure 9 below.
4.1 Oyster Harvesters
Harvesters collect the oysters from the mangroves and transport them to landing sites for processing. They are predominantly middle aged to older women. The average age of harvesters in the study sites is 40 years. Recently, younger women are becoming involved, such as in Old Jeswang and Kamalo. This increasing trend of involvement of younger people is explained as due to financial benefits derived from the industry.
In general, oyster harvesters are also those who process and sell the oysters. Hence, oyster harvesters are the same and sole actors along the oyster production chain. They operate in teams of between two and five members but generally in teams of three people.
Table 2: Number of Oyster harvesting operators at selected sites
Oyster harvesting site Number of oyster harvesting operators
Kamalo 45
Jeswang 50
Fajikunda 45
Kartong 76
Ibo Town 40
Kubuneh Bafuloto, Galoya and Kembujeh
45
Bund Road 28
Abuko 53
Lamin 78
Mandinary, Kerewan and Daranka 32
Kuloro and Mandinaba 15
TOTAL 507
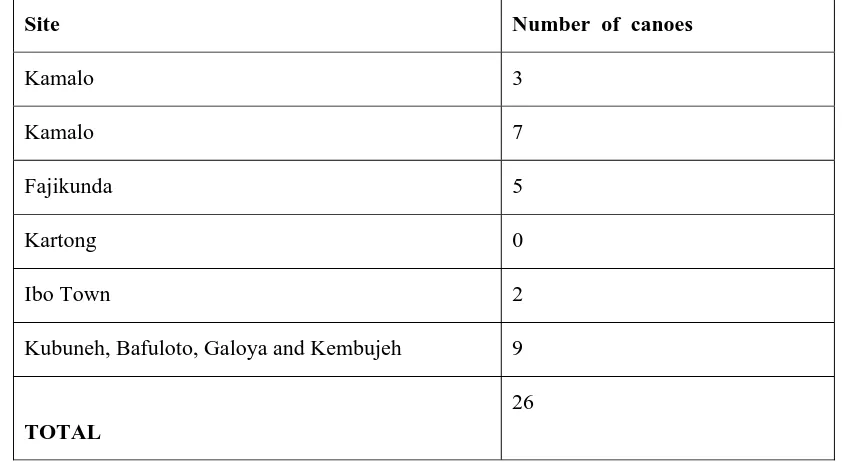
Table 3: Number of canoes available to oyster harvesters in selected oyster landing and processing sites.
Site Number of canoes
Kamalo 3
Kamalo 7
Fajikunda 5
Kartong 0
Ibo Town 2
Kubuneh, Bafuloto, Galoya and Kembujeh 9
TOTAL
Table 4: Social and demographic information on oyster harvesters
Oys
ter
har
v
estin
g
Site Gender Aver
age
Ages Mari
tal
status Number
in
house
hold
Depen
da
nts
Ethnic Gruop Na
ti
on
al
it
y
Education Reesidence
Abuko F 40.2 Married 5 2.7 Jola Gambian None Permnt Bond Road F 40.2 MWD 3 0 Jola Gambian None Permnt Faji Kunda F 40.5 Married 4 1 Jola Gambian None Permnt Jeswang F 42.5 Married 5 2 Jola Gambian None Permnt Kamalo F 41.5 Married 7 4 Jola Gambian None Permnt Kartong F 46.8 Married 6 3 Jola Gambian None Permnt Kumuneh F 35.4 Married 10 0 Jola Gambian Grade 6 Permnt Lamin F 42.3 Married 4 2 Mandinka Gambian None Permnt Mandinary F 31 Married 8 0 Others Gambian Grade 6 Permnt Overall Avrge. F 40 Married 6 2 Jola Gambian Permnt
An earlier study (Ngaido, 1990) of the oyster and cockle harvesting fishery in the Gambia found a higher percentage of male harvesters (19%). At that time, it may have been more lucrative and interesting for men, or perhaps the difference can be partially explained by the difference in study sites. A more recent study confirms that oyster and cockle harvesting in the Gambia is dominated by women (Cham and Touray, 2008). Also consistent with the findings of this VCA, the same study finds that the majority of oyster harvesters are illiterate.
The total population of people involved in oyster harvesting and related activities is not well known because little or no special attention has been given to the industry in terms of research studies compared to finfish fishing. However, it was estimated during the study that there are about 507 harvesters it is known that many people, predominantly women, are involved in this laborious but valuable occupation for their living.
Statistical data relating to quantities of oysters harvested or landed per annum is not documented because it is not part of the catch and landings data of the fisheries sector. Until recently, little consideration has been given to the oyster harvesting industry in terms of policy and the development planning. No wonder, a poverty profiling study of artisanal fisheries communities (Njie et al, 2003/2004) ranked oyster
harvesters as the poorest of the poor in the artisanal fisheries sector.
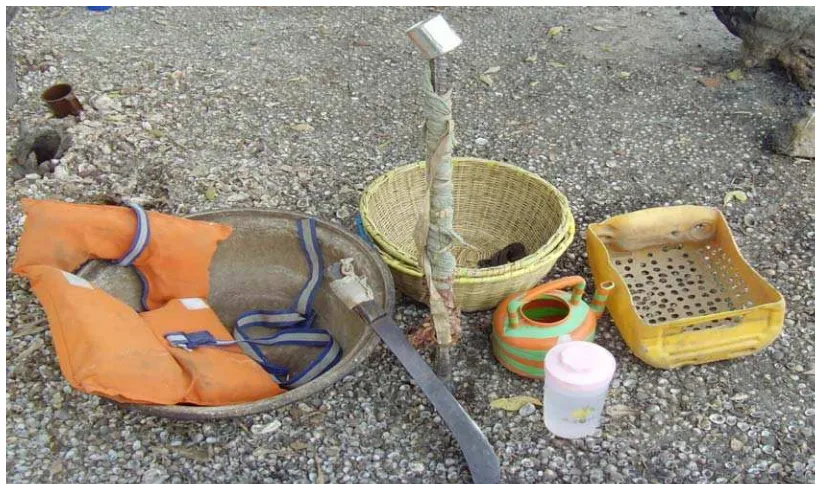
In the past, oyster harvesting practice involved the hacking of mangrove prop roots or branches to which oysters are attached. This practice has largely been eliminated and a large knife and other tools are used to scrape oysters off the roots of mangroves leaving the mangrove tree intact. With increased awareness about the destruction done to mangroves and reduced productivity, harvesters now take precaution against cutting off of mangroves parts. Harvest equipment and tools include canoe, paddles, knives, baskets, empty bags, protective clothing (multilayers of clothing, socks, hats, and madeup shoes (old cloth and plastic wound around the feet), gloves and lifejackets (see Figures 10 and 11).
Fig. 10: Oyster harvesting and processing equipment and tools
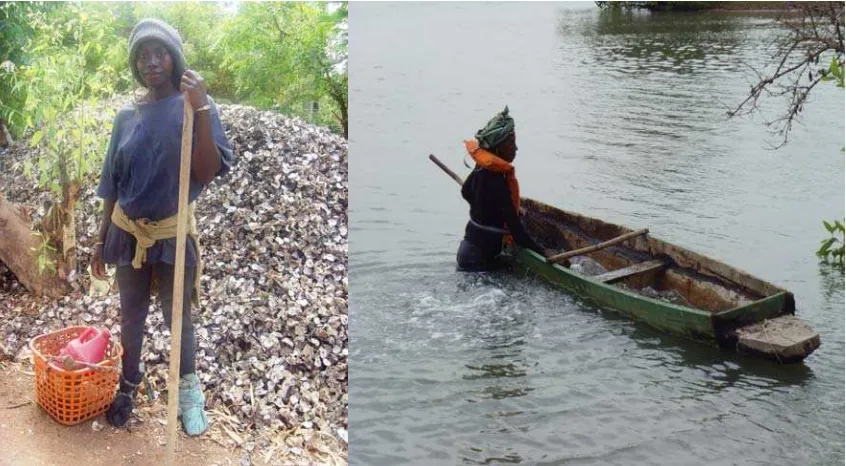
Fig. 11: a) Oyster harvester dressed for a trip b) Harvester bails water out of canoe for the trip
Most oyster harvesters are also cockle gatherers. When it is closed season for oyster harvesting, it is open season for cockles, and vice versa. Both oyster and cockle collection may be combined with other off-season alternative livelihood activities.
Cockles are normally collected from the shallow parts of streams and lagoons during low tide. Collectors travel to collection sites where they wade in the water or walk in the muddy bottom as the tide recedes combing the bottom with bare hands or with the aid of tools to pick the cockles and collect them in hand baskets. Quantities collected vary widely according to the site, effort and time of the year. On average, a specialized woman may collect between 1220 kgs of unprocessed cockles on a good day.
4.2 Oyster Processors and the Processing of Oysters and Cockles
Fig. 12: Collected firewood for oyster and cockles processing (cooking)
Fig. 13: Oyster cooking setup – steaming barrel on open stone fire (left) and pouring out cooked oysters from barrel (right)
Fig. 15: Extraction of oyster meat from shells after cooking and during processing –meat is graded by size.
Fig. 16: Two varieties of a day’s harvest of oysters processed and ready to take to market for sale
Fig. 17: Oyster harvesters relax in the shade of a tree on the roadside after processing, waiting for customers
The processing of cockles is similar to that of oysters. Cockles are normally processed by
boiling/steaming in pots, pans or drums for about 30 minutes to 1 hour during which the shells open up and the cockle meat loosen up or fall out of the shell. After steaming, the cockle meat is usually sieved with perforated trays or they are shaken and separated by gravity when the meat falls to the bottom and shells gently scooped out from the top.
Following separation, individual cockle meat pieces are picked out from the separated shells and returned to the sieved out meat and small shell that are seived through are also removed picked out by hand. These operations are shown in Figures 19 and 20 below.
Fig. 19: Sieving out and hand picking of cockle meat from cooked cockles during processing
Fig. 20: Washing and recooking of cockle meat during processing
Fig. 21: Processed cockle meat following final wash and recooking – ready for market
4.3 Oyster Sellers and the Marketing of Oysters and Cockles
Oyster selling is also done by the oyster harvesters. However, it is not uncommon to find younger women (daughters or family members of harvesters) entrusted with selling processed oysters as can be found along the highway to and from the city of Banjul.
Processed oysters and cockles are marketed in diverse places including at the processing site and during processing. The main marketing points are in urban market places, along roadsides and other isolated places. Some producers carry the products on their head and sell from one home to another in the neighbourhoods.
Fig. 22: Oyster marketing ladies at an oyster selling point on the roadside along the highway
handpicked grade of processed oysters is currently sold at GMD20, while the smallest grade is sold at GMD10.
Fig. 23: Medium size oysters (left) with measuring cup and larger size (right) oysters during marketing
Fig. 24: Measuring out oyster meat during marketing – operation observes hygiene rules
Most oyster sellers market their produce in urban areas around the periphery of markets in temporal, makeshift spaces.
Fig. 25: Team of oyster harvesters complete the harvest cycle by successful sale of all processed oysters
4.4 Buyers and Consumers and the Utilization of Oysters and Cockles
There are diverse buyers and consumers of oysters and cockles and a diversity in food uses. Buyers are mainly individuals ranging from bachelors and housewives to street food vendors. Others are from school feeding programs, school lunch sellers, hotels and restaurant operators, and party makers as during school picnics and parties including the nowadays fashionable “Ebbeh Day” in schools. “Ebbeh” is a cassava and palm oil based food fortified with diverse other food ingredients, especially seafoods including oysters and cockles. Other buyers are exporters who send them in limited quantities in the dried or frozen forms.
Oysters are used in the preparation of various dishes and are part of a number of fashionable and popular recipes in the traditional Gambian society. Oysters are in increasing demand, especially for the
preparation of family suppers and breakfasts and for snacks at home sold by street food vendors. In homes in the Gambia, oysters and cockles are ingredients to many dishes and an important source of protein. A notable dish is the popular “Benachin” (everything cooked in one pot) in which it is common to find cockles and oysters cooked with the rice.
Table 5: Results of interview with five food vendors
Question Average response
Buying frequency 5 days per week
Quantity bought 4.5 cups
Source from same person? No
Relationship with the sellers? Good
How much do you buy oysters for? GMD15/cup of 150g
Oyster preparation Stew
Size of the portion ½ cup (75g)
Cost of portion GMDD21.00
Are your customers regular? Yes
Does your preparation finish daily? Yes
If there is any leftover, what do you do with it? Consume
What other uses do you put oysters to? Family meals
Selling oyster food profitable? Yes
Selling price of oysters? Fair
Buy oysters if price increases? Yes
Oysters available year round? No
Like to have oysters year round Yes
Buy other shellfish (cockles, whelks etc…)? Yes, cockles
Additional information or ideas about the oyster industry
Sanitation of processing site
Size should be big
Quality, packing and presentation need improvement
Table 6: Oyster balance sheet for food vendor buying and selling of oyster food
Average Expenditure on oyster Expenditure on cooking ing
redients
Total Expenditures per we
ek
Income f
rom
oyster food preparation Profit on oyster food before cost
Buying frequency
per week
5
Daily quantity of
oysters bought
4.5 cups
per day
Cost of oysters
D15/cup
(150g)
337.5
/week
Size of the portion
½ cup
Cost of ingredients
and fuel per
preparation
D32/day
160
/week
497.50
Price of the portion D21
GMD941
per/week
GMD443.50
per week
4.4.1 International Markets for Oysters
Currently, limited quantities of oysters are exported by individuals who normally carry them as a gift to relatives or are informally sold to customers in the niche market. The main export destinations of these small exports are mainly the U.S.A. and the U.K., where buyers or recipients are mainly Gambians who have occasional preference for traditional foods.
Table 7: Annual export quantities of oysters (2003 – 2007)
According to oyster buyers, there is a large untapped market in both the export and domestic markets, for oysters, especially with improvements in quality including packaging and presentation. Already, some people are involved in occasional sending of oysters and cockles as traditional food products to the United States. In a recent (May 2010) shipment to the U.S. of a consignment of about seven tons of smoked and fresh fishery products and other traditional foods, 318Kgs were oysters. The domestic and international market could be expanded with guaranteed supplies based on better managed resources and the culture of oysters.
Sanitary requirements and control systems must be adequately met if oysters are to be legally exported, particularly to the European and American markets. Historically, no medical records have specifically linked any foodborne illness to consumption of oysters in The Gambia. However, the export market will require stringent food safety controls, including risk assessment and a sanitation plan.
4.5 Other Oyster Value Chain Actors
4.5.1 Canoe Owners/ Hirers of Oyster Harvesting Canoe
The relationship of canoe owners and oyster harvesters, particularly in Kartong, is quite pronounced and arrangements are such that, women processors put aside the payment in kind of the rental fee on the canoe. For each harvest and processing cycle (23 days), about a basket of oyster /cockle shells is measured and placed aside in a heap. The accumulated shells are occasionally collected by the canoe owner and transported by canoe to a white lime production site for lime production. The bag of empty shells is valued at GMD50 and therefore six bags of shells are gathered to pay for the canoe per month. Oyster harvesters and cockle gatherers often hire the canoes collectively and operate together but often each working for oneself and putting aside the amount of shells required for payment of the rent on the canoe.
4.5.2 Supply of Firewood for Oyster Processing
Oyster harvesters generally do not buy firewood for cooking the oysters. They normally collect their own firewood while harvesting and transport it in the canoe with the oysters. Firewood is also collected from dead tree branches and shrubs in the vicinity of the processing site.
4.5.3 Financing of Oyster Workers
Oyster harvesters do not have sources of credit and in the past have relied on their own personal savings or loans from relatives and group members. They are generally unable to access formal credit markets due to a lack of savings accounts with commercial banks and colateral. However, there are strong social relationships in oyster harvesting communities and harvesters assist each other in various ways including lending small sums of money to each other and through informal savings within associations of
harvesters, neighbours or relatives. In some communities, harvesters form small associations of harvesters in which periodic savings are made and used for their own personal and family needs but also to invest in acquiring small equipment and utensils for their oyster production. At the same time utensils and
equipment are shared amongst harvesters until each can acquire their own.
4.6 Production of White Lime from Oyster Shells
During processing of oysters, processors collect the shells separately and heap them in mounds around the processing site. In the past, the shells used to be of little or no value to producers. In recent times
however, producers are aware of the extra income they can derive from the shells and therefore ensure their collection and identification in heaps. These heaps of shells are left at processing where the shells dry out and get cleanedup by sunshine and rain respectively. Because of low number of lime producers and the fact that lime production is not practiced at all processing sites, large quantities of shells can be found at processing sites, sitting for several years before they are bought and used. In fact, lime producers also prefer older shells that are already well washed and are brittledry. Hence it could take several seasons before shells get used up. The quality of the final lime product is determined by the
cleanliness/whiteness of the shells. In some sites lime production is becoming so important that shell piles are removed more quickly. Lime production usually intensifies towards the end of the dry season as the rains approach.
Previously, the shells could be taken for free, but now the women processers sell them for extra income. Shells are generally sold per heap or truck/tractor load. The size of the heap may vary and price is agreed through bargaining. In general, the cost of a heap sufficient for production of a batch of lime costs about GMD1,500. Costs and revenues from the production of white lime from oyster shells discussed below in Section 5.
Lime production does not take place at all 9 value chain sample sites and the number of producers varies per site. The number of producers interviewed ranged from 1 in Mandinary to 5 in Kartong. A total of 21 producers were interviewed in seven of the 9 sample sites.
It was found that the average lime producer has a household size of 8 people. All the lime producers interviewed are Gambians and the majority belong to the Mandinka ethnic group, followed by the Jola and Fula ethnic groups. Most of the producers had no formal education. Seventyeight percent said lime production is profitable, but they also believe that the oyster resources are decreasing.
Lime producers generally work alone with occasional help from family members and dependants. However, due to the labor intensity of the work, some hired labor is usually obtained (such as for cutting fuelwood and loading the shells on the burning platform.
4.6.1 The White Lime Production Process
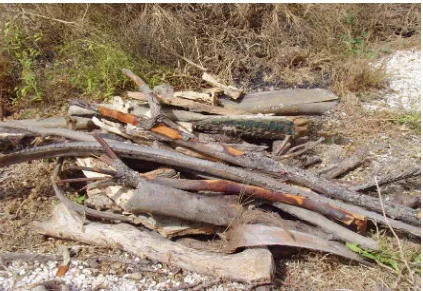
The process involves a number of steps. Tree logs are used as fuel for burning the shells and they are transported in tractor loads or on horse or donkey carts to the production site. They are arranged on the ground as a burning platform with grass straw and plant stalks interspersed between the logs to facilitate lighting. The shells are then loaded on the burning platform (Figure 27).
Fig. 27: Lime producer using his own donkey and cart to transport firewood logs for the lime production process
A gallon of gasoline is sprinkled over the shells and wood platform. As the wood catches fire and burn, the shells heat up and crumble down. As the fire increases in intensity, the shells become red hot and burn from the inside as just like a furnace.
The setup continues to burn for 47 days with occasional plunging of a long stick into the burning shells to stir up them up so that those in the upper layers in the pile fall into the fire (Figure 29). By the end of the process, all the wood and shells are burnt down. Water (usually sea water from nearby streams) is added to the burnt mass by sprinkling and churning to ground the mass into a kind of muddy paste.
Fig. 29: Lime production in process: stirring the shells (left); burning pile of shells (right)
The mass is then heaped and left to dry under the sun for three days after which it is churned again and beaten into a caked mass of white lime product, which is ready for bagging into 50Kg bags.
On average, the lime producer gets about 100 bags of white lime per batch produced. About 2 cycles of lime production are completed per month. On average, lime production takes place during a period of three to four months of the year (in the dry season only). So an average of 8 batches is produced per lime production season (per annum) if production is continuous throughout the season. The bags are sold to retail buyers.
5.0 Costs and Revenues in the Oyster Harvesting and Lime Making Value Chains
5.1 Costs and Revenues in the Oyster Harvesting Value Chain
Costs are separated in this section according to the three main steps of the oyster production chain: harvesting, processing and marketing of oysters. Each stage of the production chain requires a number of inputs and fixed and variable costs (or operating costs). Revenue is obtained only at the point of sale. Since the oyster harvester performs all three steps of the value chain, from harvesting through to
marketing of the final product, these are together considered as a single business enterprise. All analyses are based on seasonal values during the 4 month harvesting season, during the year 2010.
The analysis considers two scenarios involving: a) harvesters acquire their own canoes by purchase (the canoe considered as a fixed capital asset); and b) harvesters hire the canoes and pay rent to canoe owners (cost of hiring the canoe considered as operating cost).
The values for costs and revenues were collected from respondents in each of the 9 sample sites. Cumulative averages were then worked out for each cost and revenue item in the respective value chain step. Fixed assets were depreciated based on average lifespan also obtained from information collected from respondents.
5.1.1 Fixed Assets in Oyster Harvesting
The fixed assets and their cost for oyster harvesting per season in the first scenario (with purchase of a canoe) are presented below in Table 8.
Table 8: Fixed assets in oyster harvesting/season (with canoe) – first scenario
Asset Quantity Unit cost Total Cost
Canoe 1 4,500 4,500
Big Baskets 2 150 300
Empty rice bags 5 5 25
Paddle 1 100 100
Axe 2 100 200
Cutlass 1 100 200
Protective sweater 1 100 100
Asset Quantity Unit cost Total Cost
Life jacket 1 150 150
Pair of gloves 3 25 75
Torch light 2 25 50
Socks 3 25 75
Used clothes 1 100 100
Total 5,925
The fixed assets and their cost of oyster harvesting per season in the second scenario (without a canoe) are exactly the same as the first scenario, with the exception of the canoe. Therefore, the total fixed cost is GMD 1,425.
5.1.2 Fixed Assets in Oyster Processing and Marketing
The fixed assets involved in oyster processing and marketing (selling) are presented below in Table 9. These values are the same in both scenarios (with and without canoe ownership).
Table 9: Fixed assets in oyster processing per season
Asset Quantity Unit cost Total Cost
Empty 200L barrel 1 300 300
Empty rice bags 4 5 20
Used blankets 2 150 300
Pouring stick 1 75 75
Knives 5 25 125
Processing baskets 2 150 300
Empty rice bag 4 5 20
Cooking pot/pan 2 75 150
Total 1,290
Table 10: Fixed assets in oyster marketing/selling per season
Input costs Quantity Unit cost Total Cost
Selling basket 2 150 300
Twometres mutton cloth 4 25 100
Twometres poplin cloth 4 18 72
Total 472
In Table 11, the operating costs involved in the business of oyster harvesting, processing and marketing are presented for scenario 2 (without canoe). Scenario 1 is exactly the same, except there is no cost of canoe hire. Therefore, without canoe hire, the total operating cost is GMD1,880.
Table 11: Operating costs (without canoe)
Input costs Quantity Unit Cost Total Cost
Hire of canoe/month 4 months 300 1,200
Firewood 48 lots 15 720
Matches 10 matches 1 10
Salt 1 bag 150 150
Transport cost (av) 36 25 900
Torchlight batteries 10 10 100
Total 3,080
5.1.3 Depreciation of Fixed Assets in Oyster Harvesting Processing and Marketing
Table 12: Economic lifespan and depreciation of oyster harvesting fixed assets
Item Lifespan Qty Unit
cost Total Depreciation y1 y2 y3 y4 y5
Canoe 5 years 1 4500 4500 900 3600 2700 1800 900 0
Big baskets 2 years 2 150 300 150 150 0 0 0 0
Empty rice
bags 1 years 5 5 25 25 0 0 0 0 0
Paddle 2 years 1 100 100 50 50 0 0 0 0
Axe 2 years 2 100 200 100 100 0 0 0 0
Cutlass 2 years 1 100 100 50 50 0 0 0 0
Protective
sweater 1 years 1 100 100 100 0 0 0 0 0
Masking hat 1 years 2 25 50 50 0 0 0 0 0
Life jacket 1 years 1 150 150 150 0 0 0 0 0
Pair of gloves 1 years 3 25 75 75 0 0 0 0 0
Touch light 1 years 2 25 50 50 0 0 0 0 0
Socks 1 year 3 25 75 75 0 0 0 0 0
Used clothes 1 year 1 100 100 100 0 0 0 0 0
1875
Table 13: Economic lifespan and depreciation of oyster harvesting fixed assets
Item Lifespan Qty Unit
cost Total Depreciation y1 y2 y3 y4 y5
Empty 200L
barrel 1 year 1 300 300 300 0 0 0 0 0
Empty rice
bags 1 year 4 5 20 20 0 0 0 0 0
Used blankets 1 years 2 150 300 300 0 0 0 0 0
Pouring stick 1 year 1 75 75 75 0 0 0 0 0
Knives 1 year 5 25 125 125 0 0 0 0 0
Processing
baskets 2 years 2 150 300 150 150 0 0 0 0
Empty rice
bag 1 year 4 5 20 20 0 0 0 0 0
Cooking
pot/pan 2 year 2 75 150 75 75 0 0 0 0
Table 14: Economic lifespan and depreciation of oyster marketing/selling fixed assets
production Lifespan Qty Unit
cost Total Depreciation y1 y2 y3 y4 y5
Selling basket 2 1 150 300 300 0 0 0 0 0
Twometre
mutton cloth 1 4 25 100 100 0 0 0 0 0
Twometre
muslin cloth 1 4 18 72 72 0 0 0 0 0
472
The total depreciation of oyster harvesting, processing and marketing assets for the two scenarios (with and without canoe) is summarized in Tables 15 and 16.
Table 15: Total depreciation of fixed assets (with canoe)
Harvesting fixed assets 1875
Processing fixed assets 1065
Marketing/selling/distribution 472
Total 3412
Table 16: Total depreciation of fixed assets (without canoe)
Harvesting fixed assets 975
Processing fixed Assets 1065
Marketing/selling/distribution 472
Total 2512
5.1.4 Total Capital Projection
Having obtained the fixed assets at the different value chain steps and the operating costs with and without a canoe, the total capital projection of the business can be calculated as shown in Tables 17 and 18. A comparison of the two reveals that the investment with a canoe has higher demand on capital.
Table 17: Total capital projection with canoe
Harvesting fixed assets 5925
Processing fixed assets 1290
Marketing/selling/distribution fixed assets 472
Operating cost 1880
Table 18: Total capital projection without canoe
Harvesting fixed assets 1425
Processing fixed assets 1290
Marketing/selling/distribution fixed assets 472
Operating cost 3080
Total 6267
5.1.5 Average Revenues from Oyster Harvesting Business Enterprise
To obtain the revenue from sale of the product, average production per producer is estimated for the respective sample sites. This considers the average quantity of oyster meat produced per producer, per production cycle (3 days), characterized by an average of two days of harvesting and a day of processing and marketing. The production cycle calculation is the basis for calculation of the average revenue values from which average monthly and annual/seasonal revenue is estimated. The estimated average quantities of processed oysters from which estimated income (revenue) of oyster harvesters is estimated are both shown in Table 19.
It is to be noted that in estimating the quantities of oysters produced, the marketing measure of one empty milk tin (cup) was used as the local unit of measurement of processed oysters. This was then converted to an average net weight derived from measurements from different producers. This unit weight (150 grams) is valued at the average selling price of GMD15. Assuming that there are approximately 12 possible production cycles in a month, the monthly production value is arrived at by multiplying average price of the product by the quantity produced per cycle.
Table 19: Estimated average quantity of processed oysters produced and income per harvester (all values in GMD)
Oyster Harvest
Site
Average quantity per 3
days harvest cycle (cups)
Average quantity (grams)/ harvest cycle
Average income/ harvest cycle
Average monthly income
Average annual (seasonal)
income
Jeswang 15 2,250 225 2,700 10,800
Kamalo 18 2,700 270 3,240 12,960
Abuko 10 1,500 150 1,800 7,200
Mandinary 15 2,250 225 2,700 10,800
Lamin 18 2,700 270 3,240 12,960
Fajikunda 15 2,250 225 2,700 10,800
Kubuneh 33 4,950 500 6,000 24,000
Kartong 20 3,000 300 3,600 14,400
Oyster Harvest
Site
Average quantity per 3
days harvest cycle (cups)
Average quantity (grams)/ harvest cycle
Average income/ harvest cycle
Average monthly income
Average annual (seasonal)
income
Total 154 23,100 2,325 27,780 111,320
Average 17.11 2,567 258 3,087 12,369
Note: A cup (empty milk tin /150 grams) of oysters costs an average of GMD15. Harvest cycle is 3 days
5.1.6 Net Revenues from Oyster Harvesting
On the basis of the average costs and revenues obtained from the above analyses, the profitability of the business of oyster harvesting is estimated for each of the two scenarios (Tables 20 and 21, respectively).
The net profit of oyster harvesting per season with canoe (GMD7,077) is higher compared to without canoe (GMD6,077) as a consequence of the higher operational cost for canoe rental. Thus, oyster harvesting is more profitable when the operator invests in a self owned canoe than when the operator depends on renting a canoe. Recently, the TOWA Association established a savings and credit program, which may help members to save and purchase their own canoe with time.
Table 20: Profitability of the oyster harvesting business with canoe for one year
Income (proceeds from the sale of oyster meat) 12,369
Less cost:
Depreciation of Havesting Fixed Assets 1,875
Depreciation of Processing Fixed Assets 1,065
Depreciation of Marketing/Selling Fixed Assets 472
Total Depreciation 3,412
Operating Cost 1,880
Total Cost 5,292
Net Profit 7,077
Table 21: Profitability of the oyster harvesting business without canoe for one year
Income (proceeds from the sale of oyster meat) 12,369
Less cost:
Depreciation of Harvesting Fixed Assets 975
Depreciation of Processing Fixed Assets 1,065
Depreciation of Marketing/Selling Fixed Assets 472
Total Depreciation 2,512
Total Cost 5,592
Net Profit 6,777
5.1.7 Net Worth of Investment in the Oyster Harvesting Enterprise at End of One Season
The net worth of the oyster harvesting business enterprise is estimated below. The net worth of the business is estimated at end of one year (one season) for the investments in both scenarios as shown in Tables 22 and 23 respectively. It is evident that the net worth of the oyster harvesting business enterprise in the first scenario, with investment in a canoe is higher (GMD16,644) after one season, as compared to the second business scenario based on canoe rental which has a net worth of GMD13,044.
Table 22: Net worth of the investment with canoe as at end of one year of operation
Capital 9,567
Net Profit 7,077
16,644
Represented By:
Fixed Assets:
Harvestung 5,925
Less Depreciation 1,875
4,050
Processing 1,290
Less depreciation 1,065
225
Marketing/Selling/Distribution 472
Depreciation 472
Total Fixed Assets 4,275
Current:
Cash in Hand/at Bank 7,077
Provision for the replacement of
Depreciated Assets 3,412
Provision for the replacement of
operational inputs 1,880
Total Current Assets 12,369
Net worth 16,644
Capital 6,267
Net Profit 6,777
13,044
Represented By:
Fixed Assets
Harvestung 2,625
Less Depreciation 975
1,650
Processing 1,290
Less depreciation 1,065
225
Marketing/Selling/Distribution 472
Depreciation 472
Total Fixed Assets 1,875
Current:
Cash in Hand/at Bank 6,777
Provision for the replacement of
Depreciated Assets 2,512
Provision for the replacement of
operational imputs 3,080
12,369
Less Current Liabilities
12,369
Net worth 13,044
5.2 Cost and Sales Accounting on Production of White Lime from Oyster Shells
The analysis is again approached through two scenarios: a) lime production at real investment cost, and b) lime production at minimum cost, with savings through performing of tasks by the producer, which are otherwise paid for. For example, transport of logs using own means, such as transport with donkey cart and to cut and supply one’s own tree logs among others as depicted in the following accounting tables. Table 24 and Table 25 show the input items and costs involved in the two scenarios.
Table 24: Input items and costs in production of average batch of white lime from oyster shells at real cost
Input item
Quantity Unit cost Total Cost
1 Lot of oyster shells 1 1500 1500
1 Lot of firewood tree logs 1 2500 2500
Transportation of logs 1 500 500
Labour on loading shells /day 2 375 750
5L gasoil for lighting 5 32 160
Labour on mixing and churning 2 75 150
Empty bags 100 5 500
Bagging 100 2 200
Transportation of bags of lime 100 5 500
Transportation 2 25 50
Total input costs 6,810
Table 25: Input items and costs in production of average batch of white lime from oyster shells with labour savings
Input item
Quantity Unit cost Total Cost
1 Lot of oyster shells 1 1500 1500
1 Lot of firewood tree logs 1 1000 1000
Transportation of logs 1 0 0
Labour on loading shells /day 2 375 750
5L gasoil for lighting 5 32 160
Labour on mixing and
churning 0 0 0
Empty bags 100 5 500
Bagging 0 0 0
Transportation 2 25 50
Total input costs 3,960
5.2.1 Estimation of the Profitability of Production of White Lime from Oyster Shells
To estimate the profitability of white lime from oyster shells, an estimate of the revenue or income from the sale of white lime is made. The average production batch yields about 100 bags of white lime sold at an average price of GMD100. The total projected income from this average production batch is valued at about GMD10,000. With total input cost of GMD6,810.00, the net profit from production of an average batch of white lime at real cost is estimated to be about GMD3,190. (Table 26).
Table 26: Profitability of lime production at real cost per batch of lime produced
Income (proceeds from the sale of white lime) 10,000
Less:
Total input costs 6,810
Net Profit 3,190
Profitability of the average batch of white lime at minimised cost of production by the lime producer is estimated at about GMD6,040 (Table 27). Assuming the lime maker’s opportunity cost of his time is zero, the lime maker can almost double profit by performing the lime making labour himself.
Table 27: Profitability of production of white lime at minimized cost per batch of lime produced
Income (proceeds from the sale of white lime) 10,000
Less:
Total minimized input costs 3,960
Net Profit 6,040