MICROSTRUCTURE ANALYSIS OF SYNTHESIZED LiBOB
Etty Marti Wigayati
*, Christin Rina Ratri, Ibrahim Purawiardi,
Fadli Rohman, and Titik Lestariningsih
Research Center for Physics, Indonesian Institute of Sciences, Kawasan Puspiptek Serpong Gd. 442 Tangerang Selatan 15314, Banten Indonesia
Received March 3, 2015; Accepted June 4, 2015
ABSTRACT
Lithium bis (oxalate) borate or LiBOB is an active material used as the electrolyte for lithium battery application. LiBOB (LiB(C2O4)2) powder was prepared from LiOH, H2C2O4 and H3BO3. The employed method was solid state
reaction. LiBOB powder produced from the reaction was then observed using SEM and TEM. Surface area was analyzed using Quantachrome Nova 4200e. From the analysis analyzed using XRD to identify the resulting phases, crystal structure, and crystallite size. The functional groups were analyzed using FT-IR. The particle morphology was result, it was seen that the resulted phases were C4LiBO8 and LiB(C2O4)2.H2O, the crystal structure was
orthorhombic with space group Pbca and Pnma. From the particle morphology observation it was shown that micro pores were created irregularly. When the observation was deepened, nanopores with elongated round shape were seen within the micropores. The pore size was approximately 50–100 nm. The surface area, total pore volume, and average pore diameter of LiBOB powder was 88.556 m2/g, 0.4252 cm3/g, and 19.2 nm respectively.
Keywords:phase; crystal structure; crystallite size; functional group; nanopores particle morphology
ABSTRAK
LiBOB (Lithium bis oksalat borat) merupakan bahan aktif yang dapat dipergunakan untuk elektrolit pada baterai Lithium. Serbuk LiBOB (LiB(C2O4)2) dibuat dari bahan baku LiOH, H2C2O4 dan H3BO3. Metoda yang dipergunakan
adalah solid state reaction. Serbuk LiBOB yang dihasilkan dianalisa menggunakan XRD untuk mengetahui fasa yang terbentuk, struktur kristal dan ukuran kristalitnya. Ikatan gugus fungsi dianalisa dengan FTIR. Morfologi partikel diamati dengan SEM dan TEM. Surface area dianalisis dengan alat Quantachrome Nova 4200e. Dari hasil analisis dapat diketahui bahwa fasa yang terbentuk adalah fasa C4LiBO8dan LiB(C2O4)2(H2O), struktur kristal orthorhombic
dengan space group Pbca dan Pnma. Pada pengamatan morfologi partikel dapat diketahui terbentuk rongga pori dalam ukuran mikro dengan bentuk tidak beraturan. Ketika pengamatan diperdalam lagi pada bagian rongga pori nampak terjadi nanopori dengan bentuk bulat sedikit memanjang. Ukuran pori berkisar 50-100 nm. Luas permukaan, volume pori total, dan rerata diameter pori dari serbuk LiBOB masing-masing adalah 88,556 m2/g, 0,4252 cm3/g, dan 19,2 nm.
Kata Kunci:fasa; struktur kristal; ukuran kristalit; ikatan gugus; morfologi partikel nanopori
INTRODUCTION
Lithium bis(oxalato) borate (LiBOB) is a new lithium salt firstly proposed at 1999 by Lischka et al. [1-2] as a highly promising and advantageous electrolyte for rechargeable lithium-ion batteries. Thermal behavior of LiBOB is an interesting and important research subject especially concerning the safety of lithium-ion batteries. In the last few years, several researchers have published LiBOB-related scientific journals, particularly discussing thermal studies of LiBOB which showed excellent thermal stability up to 300 °C. Beyond this temperature, LiBOB would be decomposed into Li2CO3,
B2O3, and CO2[3-5]. Another publication explained that
LiBOB electrolyte dissolved in propylene carbonate (PC)
solvent that showed has higher power capability compared to another lithium salts in similar solvent [6-7]. It was also explained that the charge/discharge test of 0.7 M LiBOB in EC:EMC (1:1) solvent showed more superior performance compared to 1 M LiPF6 in
EC:EMC (1:1) solvent. LiBOB has higher stability and discharge capacity at high temperature [8].
In addition, LiBOB has distinctive physical properties such as hygroscopic and stable when it contacts with water. However, LiBOB solubility in the mixture of carbonate solvent to form liquid electrolyte was found to be relatively low compared to LiPF6,
purity. All materials were supplied from Merck (Germany).
Instrumentation
The heat treatment for preparing LiBOB was performed using Thermolyne muffle furnace. Crystalline structure and the crystallinity of the powder were analysed using X-Ray Diffractometer (XRD) Rigaku type SmartLab. The functional groups were analyzed using FT-IR Thermoscientific type Nicolet iS-10 machine. The surface morphology of LiBOB powder, characterization using Scanning Electron Microscope (SEM) Hitachi SU-3500 and Transmission Electron Microscope (TEM) FEI type Tecnai G2 20S-Twin 200 kV acceleration voltages. Surface area of LiBOB powder was observed using Quantachrome Nova 4200e.
Procedure
To synthesize LiBOB, solid state reaction among oxalic acid, lithium hydroxide, and boric acid was performed with chemical reaction scheme as follows [9]:
2H2C2O4.2H2O + LiOH.H2O + H3BO3→LiB(C2O4)2+ 9 H2O
Reactants used for synthesizing LiBOB are lithium hydroxide, boric acid, and oxalic acid. These materials were pre-treated first to remove moisture. Reactants were weighed and mixed following molar ratio of 2:1:1. Heating process was performed in a muffle furnace at 120 °C temperature for 4 h and 240 °C for 6 h, subsequently. The product obtained from the heating was white powder.
X-Ray diffraction
Powder crystallinity of the LiBOB sample was scanned using X-Ray Diffractometer (XRD) with CuKα target, wave length λ = 1.5406 Ă, and 2θ range of 10° to 80°. A diffractogram with diffraction peaks was obtained as a result; that was analysed with PDXL software to collect formed phase information as well as qualitative analysis including crystal structure parameter in a unit
method.
Scanning and Transmission Electron Microscopy (SEM and TEM)
To identify the surface morphology of LiBOB powder, characterization using SEM was performed. The sample was prepared by putting it onto carbon tape and coating it with pure gold (Au) using sputter-coating method to increase specimen conductivity. To explore the surface morphology of the sample, Transmission Electron Microscope (TEM) was used. The sample was prepared by dispersing the powder with toluene in order to aid the attachment of the powder onto the surface of the grid, since the sample size on the grid was limited to be smaller than 200 nm. Toluene-dispersed sample was dropped on the grid using a pipette under an optical microscope. The prepared sample was then inserted into the TEM holder to be analyzed.
Surface area analysis
Surface area of LiBOB powder was observed using surface area pore size analyzer, with Brunauer-Emmett-Teller (BET) method. In principle, this equipment employs gas (usually nitrogen) adsorption on the surface of a solid material which was characterized at a constant temperature (the boiling point of the gas). If the specific gas volume adsorbed on the surface of a solid material at a certain temperature and pressure is known, the theoretical surface area of one molecule of adsorbed and so the surface area of the solid material can be calculated. Total pore volume and average pore radius were also observed in this analysis.
RESULT AND DISCUSSION
Fig 1.X-ray diffraction pattern of LiBOB powder
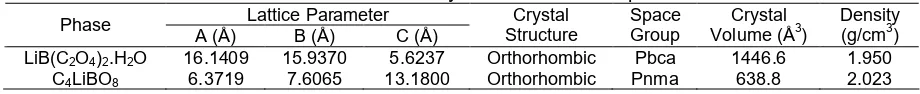
Table 1.Qualitative analysis result of LiBOB powder
Lattice Parameter Phase
A (Å) B (Å) C (Å)
Crystal Structure
Space Group
Crystal Volume (Å3)
Density (g/cm3)
LiB(C2O4)2.H2O 16.1409 15.9370 5.6237 Orthorhombic Pbca 1446.6 1.950
C4LiBO8 6.3719 7.6065 13.1800 Orthorhombic Pnma 638.8 2.023
Table 2.Crystallite size calculation result 2θ (deg) D (Å) FWHM (deg) Crystallite Size (nm)
19.42 4.5669 0.236 35.7
20.13 4.4077 0.282 29.9
23.75 3.7437 0.415 20.4
32.15 2.7817 0.350 24.7
strongest lines of d-spacing value that was recorded in ICDD database. To determine a phase, three d-spacing values that was found from observation data with three strongest lines values were matched with ICDD database of the predicted phase. The matching tolerances are ± 0.01 for first d-spacing value and ± 0.02 for second and third d-spacing values. From the X-ray diffraction pattern of this sample, it was indicated that there were two main phases i.e. LiB(C2O4)2.H2O (LiBOB
hydrate) and C4LiBO8 (LiBOB). The LiBOB hydrate
phase was indicated by three d-spacing values i.e. 3.74116 Å, 4.40427 Å, and 4.563 Å at 2-theta 23.7641°, 20.1454°, and 19.438° that matched with ICDD/PDF 4+
database for LiBOB hydrate no. 01-073-9447 which had three strongest lines values i.e. 3.74141 Å, 4.41409 Å, and 4.57673 Å. The Miller indexes of these three strongest lines were [131], [121], and [021]. On the other hand, The LiBOB phase was indicated by three d-spacing values i.e. 4.563 Å, 3.78786 Å, and 3.27829 Å at 2-theta 19.438°, 23.4669°, and 27.1796° that matched with ICDD/PDF 4+ database for LiBOB no. 00-062-0917 which had three strongest lines values i.e. 4.57621 Å, 3.79991 Å, and 3.29133 Å. The Miller indexes of these three strongest lines were [102], [020], and [022]. The qualitative analysis result of LiBOB powder sample was shown in Table 1.
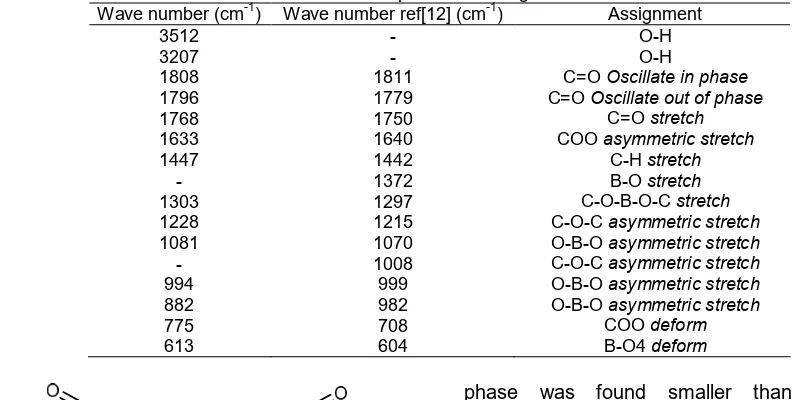
Fig 2.FT-IR spectrum of LiBOB powder
Table 3. Infra-red absorption band assignments for LiBOB Wave number (cm-1) Wave number ref[12] (cm-1) Assignment
3512
C=OOscillate in phase
C=OOscillate out of phase
C=Ostretch
Fig 3.Structural formula of LiBOB compound
The degree of crystallinity was found to be 96.66% which means LiBOB powder has relatively high crystal structure regularity, i.e. in orthorhombic crystal system.
The X-ray diffraction pattern of this sample was analyzed by Rietveld refinements using Rigaku PDXL software. The chi-square of the refinement was 1.4406 and the reliability factor Rwp 15.96%. The quantitative
analysis has shown that LiBOB powder sample consists of 69.8 wt.% LiBOB hydrate and 30.2 wt.% LiBOB.
It has been shown from quantitative analysis result that in LiB(C2O4)2.H2O phase, LiBOB binds H2O due to
its hygroscopic nature. The crystal volume of C4LiBO8
phase was found smaller than LiB(C2O4)2.H2O,
because of the H2O molecules inside C4LiBO8. On the
other hand, the crystal density of C4LiBO8 was found
higher than LiB(C2O4)2.H2O, which means C4LiBO8 was
more dense.
FT-IR Analysis
From the infrared spectrum shown in Fig. 2, it was seen that there were vibration probability of functional groups C-O, C=O, B-O, O-B-O and C-C in LiBOB powder following the structural formula that presented in Fig. 3. Wave number 1768–1808 cm-1 and 994–1303 cm-1were assigned to C=O and C-O-B-O-C vibration, respectively. Wavenumber 775 cm-1 was a typical C-O-O deform peak.
Fig 4. SEM figure of LiBOB powder at 5000x
magnification, zoomed to 15,000x Fig 5.TEM image of synthesized LiBOB powder
Fig 6.TEM image of commercial LiBOB powder
that C=O and B-O symmetric stretch at wave number 1750 and 1372 cm-1 as well as asymmetric stretch of C-O-C at wave number 1008 cm-1 did not appear for synthesized LiBOB. The absorption band O-B-O asymmetric stretch was observed at wave number 1081 cm-1, which was one of typical vibration peak of LiBOB compound. In reference LiBOB, this functional group was also identified at wave number 1070 cm-1.
Absorption bands appeared at wave number 3511 and 3412 cm-1were assigned for O-H bond. This bond indicates that there was probability of unfinished reaction of the boric acid or oxalic acid compound to produce LiBOB. It can also indicate that there was hydroxyl group from the moisture in the air attached to the newly-formed LiBOB molecules due to the hygroscopic nature of LiBOB. This attachment turned LiBOB phase into LiBOB hydrate phase, as was confirmed by the XRD analysis results.
Surface Morphology
SEM image of LiBOB powder with 5,000x magnification shown at Fig. 4 showed that the powder
was in a form of hollow particle with irregular pores in micrometers size. The inset figure with 15,000x magnification showed that the darker shade was pore cavities with various size (approximately within 0.5–1 µm range of diameter) among the particle bulges (the brighter shade). The pore cavities of LiBOB powder were distributed evenly on the entire surface. To observe the pore cavities of the sample more closely, TEM characterization was conducted; the result is presented at Fig. 5.
It was observed that the pores were in elongated, round shape. TEM image at Fig. 5 showed that the brighter shade was the pore cavities surrounded by the darker shade in a single LiBOB particle. Another pore was seen inside the pore cavities, which implies that there are many pores inside one single particle with pore size of 50–100 nm range. TEM analysis of commercial LiBOB powder (Sigma Aldrich) was presented at Fig. 6. There was also pore inside the pore cavities, shown in darker shade with 25–50 nm size, and spread evenly.
particle, more particles are exposed and the numbers of total collisions are increased, hence increasing the reaction rate. Therefore, with large surface area LiBOB powder is expected to be easily soluble in carbonate solvents.
It was seen that pore size analysis using BET method was smaller, micropore size category, than using TEM, because the result from TEM analysis was obtained visually using the image of the sample being observed while the result from BET method was obtained theoretically from gas adsorption on the sample surface.
CONCLUSION
Microstructure observation of LiBOB was important in synthesizing liquid electrolyte for lithium-ion batteries application. Several parameters, such as particle size, particle morphology and the degree of crystallinity should be observed as well. In this research, synthesized LiBOB has been observed by using XRD, BET, SEM, and TEM to show its crystalline structure and particle morphology. In this microstructure analysis, it was observed that there were two phases: LiBOB and LiB(C2O4)2.H2O. LiBOB phase has orthorhombic crystal
structure. Particle morphology analysis using SEM has shown that there are pore cavities inside the particle. From TEM analysis, it can also be seen that synthesis of LiBOB by means of solid state reaction resulted in
REFERENCES
1. Lischka, U., Wietelmann, U., and Wegner, M., 1999, German Pat., DE 19829030C1.
2. Xu, W., and Angel, C.A., 2001,Electrochem. Solid-State Lett., 4 (1), E1–E4.
3. Cui, X., Zhang, H., Li, S., Li, X., and Feng, H., 2014,Ionics, 20 (6), 789–794.
4. Barth, W.V., Hueso, A.P., Zhou, L., Lyons, L.J., and West, R., 2014, J. Power Sources, 272, 190– 195.
5. Fan, L.Z., Xing, T., Awan, R., and Qiu, W., 2011, Ionics, 17 (6), 491–494.
6. Yu, Z., Xu, T., Xing, T., Fan, L-Z., Lian, F., and Qiu, W., 2010,J. Power Sources, 195 (13), 4285–4289. 7. Kaneko, H., Sekine, K., and Takamura, T., 2005,J.
Power Sources, 146 (1-2), 142–145.
8. Wang, S., Qiu, W., Guan, Y., Yu, B., Zhao, H., and Liu, W., 2007, Electrochim. Acta, 52 (15), 4907– 4910.
9. Yu, B., Qiu, W., Li, F., and Xu, G., 2006, Electrochem. Solid-State Lett., 9 (1), A1–A4. 10. Rahaman, M.H.A., Khandaker, M.U., Khan, Z.R., Kufian,
M.Z., Noor, I.S.M., and Arof, A.K., 2014,Phys. Chem. Chem. Phys., 16 (23), 11527–11537.
11. Moryc, U., and Ptak, W.S., 1999, J. Mol. Struct., 511-512,241–249.