Gadjah Mada International Journal of Business Vol. 17, No. 2 (May-August 2015): 107-124
Determinants of Investment Opportunity Set
(Degree of Internationalization and
Macroeconomic Variables)
Cynthia A. Utama
*and
Meiti Sulistika
Faculty of Economics, University of Indonesia, IndonesiaAbstract: The aim of this study is to investigate the influence of internal factors (i.e. the degree of internationalization, profitability, firm size, and financial leverage) and external factors (i.e. GNP growth and the inflation rate) on firms’ growth opportunities or their Investment Opportunity Set (IOS). The IOS is measured by the market-to-book assets ratio. The result shows that profitability and firms’ size have a positive impact on the IOS whereas the degree of internationalization and financial leverage has a negative influence on the IOS. Finally, the IOS is positively affected by GNP growth while the inflation rate has a negative impact on IOS.
Abstrak: Tujuan dari penelitian ini adalah untuk mengetahui pengaruh faktor internal (yaitu tingkat internasionalisasi, profitabilitas, ukuran perusahaan, dan leverage keuangan) dan faktor eksternal (yaitu pertumbuhan GNP dan tingkat inflasi) pada peluang pertumbuhan perusahaan atau set peluang investasi (IOS). IOS diukur dengan rasio aset market-to-book. Hasil penelitian menunjukkan bahwa profitabilitas dan ukuran perusahaan ‘memiliki dampak positif pada IOS sedangkan tingkat internasionalisasi dan le-verage keuangan memiliki pengaruh negatif pada IOS. Akhirnya, IOS positif dipengaruhi oleh pertumbuhan GNP sementara tingkat inflasi memiliki dampak negatif pada IOS.
Keywords:degree of internationalization; firm size; gross national product; inflation rate;
investment opportunity set; leverage; market to book ratio; profitability
Introduction
A firm’s value is a function of its exist-ing assets (assets-in-place) and growth oppor-tunities (Myers 1977; AlNajjar and Riahi-Belkaoui 2001; Kallapur and Trombley 2001). Kester (1984) corroborated that a firm’s in-vestment choices include firm growth oppor-tunities that determine the firm’s real value and profit potential. Mason and Merton (1985) mentioned that a high growth com-pany is a comcom-pany which has the capacity to carry out investment activities in the form of the purchase of assets, such as machines, that support the production, the introduction of new products, the acquisition of other companies, and other capital expenditure as-sociated with the maintenance and replace-ment of the assets of the company. Vogt (1997) mentioned that markets will react positively to firms which have a positive net present value of growth opportunities.
As mentioned above, the Investment Opportunity Set (henceforth, IOS) represents investment options held by companies today, thus the IOS is very important in determin-ing how the company grows in the future. Therefore, determinants of IOS will affect how investors appraise the company (Kallapur and Trombley 2001).
AlNajjar and Riahi-Belkaoui (2001) found that a firm’s internal factors (i.e. the degree of internationalization, profitability, leverage, and firm size) determine the IOS, while Riahi-Belkaoui (2002) stated that in-ternal factors and exin-ternal factors (i.e. GNP and inflation) affect the IOS.
Xiao et al. (2013) stated that previous studies investigating the influence of inter-nationalization on firms’ performance showed contradictory and inconsistent re-sults. Further, those empirical studies focused
on multinational corporations in developed countries.
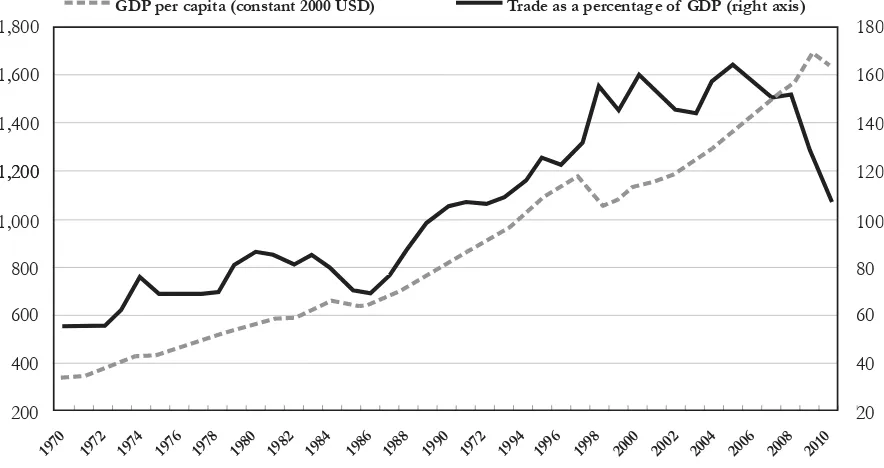
On the other hand, Indonesian firms operating in emerging economies tend to lack experience, have fewer resources, and are newly internationalized, relative to multina-tional corporations in developed countries. Further, international trade in Indonesia is a significant proportion of the Gross Domes-tic Product (GDP) as shown below.
Indonesia’s GDP per capita has risen al-most 5 fold in the past forty years (Figure 1). Trade has played an important role in this remarkable achievement. In the past 25 years, i.e. until 2010 trade, as a share of GDP, increased significantly in Indonesia, in part due to the country’s outward oriented devel-opment strategy. And while the deep global trade contraction in 2009 is apparent, more recent data suggests that trade has increased to levels closer to trend (OECD 2012).
As trade increases in proportion to GDP, then this also brings an increase in foreign direct investments. OECD (2012) stated that:
Considering that trade has a significant role in the economy, then a study examining whether internationalization has a significant impact on firms’ investment opportunities warrants further research. It is also intriguing to investigate the influence of international-ization of firms in underdeveloped countries like Indonesia.
As far as we know, the extant literature that investigates the influence of internal fac-tors and external facfac-tors simultaneously on IOS is very rare. In Indonesia, Hasibuan (2007) and Tumpal and Natalia (2007) inves-tigated the influence of internal factors on the company IOS without considering the impact of external factors or macroeconomic variables on IOS. Ratnawati (2007) examined the impact of inflation on IOS but did not examine the influence of internal factors on IOS.
Further, the extant literature that con-siders the impact of the degree of interna-tionalization on IOS is quite rare, though
currently many companies export their prod-ucts abroad. Delios and Henisz (2000) stated that internationalization requires the devel-opment of knowledge and capabilities regard-ing international market conditions, and that the companies also faced uncertainty and constraints related to the environment at the international level. International trade regu-lations in the country where the company is expanding its market will limit the degree of internationalization of the firm (Hill 2007). This condition may restrain the firms’ growth opportunities. AlNajjar and Riahi-Belkaoui (2001), Riahi-Belkaoui (2002), and Hasibuan (2007) found a negative relationship between the level of internationalization and IOS.
Based on the previous explanations, the objectives of this study were to investigate: (1) the influence of profitability, firm size, degree of internationalization, and leverage on IOS; (2) the influence of external factors, i.e. GNP growth and inflation rate on IOS.
GDP per capita (constant 2000 USD) Trade as a percentage of GDP (right axis)
1970 1972 1974 1976 1978 1980 1982 1984 1986 1988 1990 1972 1994 1996 1998 2000 2002 2004 2006 2008 2010
200 400 600 800 1,000 1,200 1,200 1,400 1,600 1,800
20 40 60 80 100 120 140 160 180
The remainder of the paper is organized as follows. Section 2 reviews the literature and hypotheses development. Section 3 de-scribes the data and methodology. Section 4 describes the empirical results and section 5 concludes the paper.
Hypotheses Development
Profitability shows a company’s ability to earn profit. A higher profitability allows the firm to sustain its existence in their cho-sen industry. The level of profitability repre-sents how profitable a business is (Keown et al. 2002). So, a firm’s profitability reflects its performance to potential investors (Savitri 2009). Further, the greater the firm’s profit-ability is, the bigger the possibility of retained earnings for investment purposes. Firms’ In-vestment Opportunity Sets are positively in-fluenced by profitability. Bodie et al. (2009) argued that projects with high profitability (i.e. higher return on equity or ROE) in-creased a firm’s growth opportunities if the firm could invest its earnings into projects where the ROE exceeded the cost of capi-tal. Consequently, firms with good investment opportunities tend to increase their retained earnings or plow back ratio (i.e. the ratio of retained earnings-to-net income). Further, Bodie et al. (2009) elaborated on the rela-tionship between the Return on Equity (ROE), the Price to Earnings ratio (P/E ra-tio), and the Price to Book Value (PBV or P/ B) as proxies of the IOS or growth opportu-nities as shown below
According to Bodie et al. (2009), Wall Street distinguishes between “good firms” and “good investments.” A good firm may be
highly profitable, with a correspondingly high ROE. But if its stock price is bid up to a level commensurate with this ROE, its P/B ratio will also be high, and the stock price may be a relatively large multiple of earnings, thus reducing its attractiveness as an invest-ment. The high ROE of the firm does not by itself imply that the stock is a good invest-ment. Conversely, troubled firms with low ROEs can be good investments if their prices are low enough. Thus, we conclude that there is a positive relationship between profitabil-ity and IOS (Riahi-Belkaoui 2002).
H1: Profitability has a positive influence on the In-vestment Opportunity Set.
A larger firm size usually means it has larger assets that can be used for investment, and makes it easier for the firm to compete and dominate the market. Gaver and Gaver (1993) found that the greater the firm’s size and the more established the company was, it would have higher investment opportuni-ties compared to those of a smaller company. In addition, a larger size firm has lower asym-metric information and a higher reputation, so the company has easier access to external financing. Large and more established firms tend to be more active in increasing the value of their investments in various ways, such as product differentiation to create barriers to entry, economies of scale, and patents (Chung and Charoenwong 1991). AlNajjar and Riahi-Belkaoui (2001) also corroborated that a firm’s size has a positive impact on its IOS. They argued that small companies often face limitations or difficulties in determining the choice and execution of new projects, or dif-ficulties in restructuring existing assets, while large companies tend to dominate the mar-ket position in their industry. In other words, a greater firm size results in greater invest-ment opportunities.
Dhanaraj and Bearnish (2003) also stated that larger firms have a larger quan-tum of resources and availability of manage-rial resources. Bloodgood et al. (1996) also showed that larger firms have the capability to hire more skilled managers than smaller firms. Therefore, larger firms have more ca-pacity to fund their growth opportunities than smaller firms.
H2: Firm size has a positive effect on IOS. Sapienza et al. (2006) argued that a com-pany that has entered the international mar-ket needs to adapt to the environment of the country where the company is expanding its market. Singla and George (2013) also sup-port the fact that internationalization causes additional costs of learning about the foreign culture and markets, and firms when they first start in a foreign market might suffer from poor product image. Hope et al. (2011) also mentioned that:
Other costs include those in manufac-turing and selling abroad which are needed to modify the production process and mar-keting strategy to adapt the product to local conditions. Further, a firm incurs costs asso-ciated with staffing, and setting up an inter-nal management system and an exterinter-nal busi-ness network.
Delios and Henisz (2000) stated that in addition to requiring the development of knowledge and capabilities regarding inter-national market conditions, the company also faced uncertainty and constraints related to the environment at the international level. International trade regulations in the country where the company is expanding its market will limit the degree of internationalization of the firm (Hill 2007). This condition will hinder the firm’s investment growth oppor-tunities. Consistent with this view, AlNajjar
and Riahi-Belkaoui (2001), Riahi-Belkaoui (2002), and Hasibuan (2007) found a nega-tive relationship between the level of inter-nationalization and IOS.
H3: The level of internationalization negatively af-fects the IOS.
Higher financial leveraged firms will experience a higher risk of default due to their inability to pay the interest and principal of their debt (Angeline 2007). Likewise, the in-terest payments and principal of debt may increase the potential loss of investment be-cause the interest and principal payments can be higher than the return on investment. In addition, using leverage in the firm’s capital structure also limits the investment decisions due to the boundaries in the debt covenants (negative covenants), where the lender deter-mines certain restrictions to ensure repayment of the principal and interest. Francis et al. (2013) showed that financial leverage indi-cates a firm’s riskiness and higher leverage impacts on its access to external financing. Thus, firms with a higher leverage have a higher financial risk than those with a lower leverage, and they tend to reduce their busi-ness risk through a lower Investment Oppor-tunity Set. Therefore, leverage has a negative influence on IOS (Gaver and Gaver 1993; Gul 1999; AlNajjar and Riahi-Belkaoui 2001).
cli-mate for investment. Francis et al. (2013) also corroborate that higher GDP enhances the growth of financial markets and consequently provides better investment opportunities. Lakonishok et al. (1994) showed that eco-nomic growth (i.e. growth in real GDP) has a positive influence on the IOS (i.e. price to book value). Countries with lower economic growth are assumed to have a bad economic outlook and consequently, these countries’ firms trade at discount or have a lower price to book value. Therefore, the annual change in GNP is expected to have a positive im-pact on IOS (Riahi- Belkaoui 2002).
H5: The annual growth in GNP has a positive in-fluence on the Investment Opportunity Set.
Unanticipated increases in inflation will affect companies’ wages and the Cost Of Goods Sold (COGS), total asset value, and the market price of the company’s product. Unanticipated inflation creates uncertainty about the future economic situation (Sukirno 2004). This situation decreases a company’s motivation to develop its economic activi-ties. A firm’s investments are highly depen-dent on changes in the inflation rate, because the inflation rate determines nominal inter-est rates and consequently affects the costs of capital for the firm’s investments. High rates of inflation will increase interest rates, which in turn will reduce investment. As mentioned above, Lakonishok et al. (1994) argued that lower economic growth, indicated by higher inflation, yields a lower IOS (i.e. price to book value). This argument is sup-ported by Bodie et al. (2002) who showed that the market value of a firm is affected by the cost of capital in the constant dividend growth model provided below:
where P is the market price, while k and g show the cost of capital and expected growth consecutively. Hence, unanticipated increases in inflation produce higher costs of capital and given the ceteris paribus of other vari-ables, market price and also price to book value will be reduced. Thus, the inflation rate has a negative effect on the IOS (Ratnawati 2007).
H6: Inflation rate negatively affects the Investment Opportunity Set.
A firm’s age indicates its ability to con-tinue to carry out its business and shows a level of learning curve or firm experience (Febriana 2004). The age of a firm also pre-vents potential bias towards newly diversi-fied firms in the international market area (Kim et al. 1989). Previous studies showed that a firm’s growth or investment opportu-nities had a positive correlation with the firm’s age (Das 1995; Heshmati 2001; Ermini 2008; Teruel-Carrizosa 2010). Growth opportunity can be represented by the R&D-to-assets ra-tio (Brown and Peterson 2009) or innova-tional performance (Yildiz et al. 2013). Be-sides, an established company tends to in-crease its public confidence in the company so that it will increase its growth opportuni-ties.
H7: The Investment Opportunity Set is positively influenced by a firm’s age.
In addition, the extant literature shows that any negative influence of international-ization is affected by the firm’s size and age. Firms that are characterized by their small size and young age are assumed to be of higher risk when conducting their expansion into foreign markets because these firms tend to have a lack of resources and experience (Fernandez and Nieto 2006: Claver et al. 2008; Shrader et al. 2000). Hence, Singla and D1
George (2013) concluded that the degree of risk aversion to entering a foreign market could be reduced by older and larger firms having more ability to impose patents and contracts in their international expansion. H7: Firm size positively moderates the negative
re-lationship between the IOS and the level of internationalization.
H8: Firms’ age positively moderates the negative re-lationship between the IOS and the level of internationalization.
Methods
Definition of Operational
Variables
This study used 6 independent variables which were expected to determine the IOS, i.e. profitability, firm size, degree of interna-tionalization, leverage, GNP growth, and in-flation rate.
Investment Opportunity Set (IOS)
One variable that is used as a proxy of IOS is the ratio of market-to-book assets (henceforth, PBV) which is the most com-monly used proxy measure of investment opportunities in a company. This proxy is used to measure a company’s growth prospects. PBV is the ratio of the market value of as-sets to the book value of asas-sets. Generally, the PBV is greater than 1 (one), showing that a company has good investment opportuni-ties (Smith and Watts 1992; Ho et al. 2004; AlNajjar and Riahi-Belkaouli 2001; Adam and Goyal 2007). Kallapur and Trombley (1999)
and Kallapur (2001) stated that proxies of the IOC can be classified into 4 types: price-based proxies, investment price-based proxies,1 variance measures,2 and composite measures. The price-based proxies are based on the as-sumption that growth firms will have higher market values relative to assets in place be-cause growth prospects are at least partially impounded in the stock price. That is, a ma-terial portion of the market value of equity is accounted for by growth opportunities. Accordingly, price-based proxies are formed as a ratio incorporating a measure of the as-sets in place and the firm’s market value. Kallapur and Trombley (1999) also showed that among the commonly used proxies, mar-ket-to-book value ratios were the most highly correlated with future growth. While, Kole (1991) and Smith and Watts (1992) used the book to market value of asset or the inver-sion of price to book. In other words, price to book value reflects the mix of assets in place and growth opportunities, because the book value of assets is a proxy for assets in place, and the market value of assets is a proxy for both the assets in place and growth opportunities. Therefore, this study used the ratio of market-to-book assets as a proxy rep-resenting the IOS, and it was measured as follows:
Profitability
Profitability is measured by the ROA, i.e. the amount of net income earned by the
1 Investment-based proxies include R&D, sales, ratio of capital expenditure to value and are based on the
assumption that a high level of investment activity is positively related to the IOS.
2 Variance measures include variance of returns, asset b and are based on the assumption that options become
more valuable as the variability of returns on the underlying assets increases.
Market to Book Assets=
company each year divided by the total as-sets of the company in the same year (Riahi-Belkaoui 2002). The equation is as follows:
Firm Size
In line with previous empirical studies, this study employed the logarithm of total assets as a proxy of the firm’s size to adjust for the large differences in size amongst com-panies ( Ferry and Jones 1979; AlNajjar and Riahi-Belkaoui 2001; Wibowo and Andriyani 2008).
Degree of Internasionalization Level
The degree of internationalization level is calculated by the total amount of a company’s export sales expressed as a per-centage of the total sales of that company (Sullivan 1994; Riahi- Belkaoui 2002; Filatotchev and Piesse 2009):
Leverage
A firm’s leverage is proxied by the ratio of its long-term debt to total assets (AlNajjar and Riahi-Belkaoui 2001):
Firm Age
A firm’s age in this study is shown by the total age of the assets held by the com-pany.3 The firm’s age is measured by the fol-lowing equation:
Sample
The financial data used in this study were hand-collected from the annual finan-cial statements of companies listed on the Indonesian Stock Exchange from 2000-2008. The financial statements included balance sheets, income statements, cash flows, changes in capital and this data came from the Indonesian Stock Exchange. It can be downloaded from the Indonesian Stock Exchange’s web site (i.e. www.idx.co.id) or from the CD Room of the Faculty of Eco-nomics, University of Indonesia Library. Other data used in this study were the clos-ing stock prices, which can be obtained from the Indonesian Capital Market Directory (ICMD) provided by the Faculty of Econom-ics, University of Indonesia Library.
Inflation data was gathered from the Indonesian Financial Statistics records (IFS) which are available in the library of Bank Indonesia. Further, GNP data was provided by the Indonesian Central Bureau of Statis-tics library. The economic growth was com-puted from real GNP growth from products and services produced, thus to compute the growth, we had to calculate the output of products and services at a fixed price, i.e. the price prevailing in any given year that can be used to assess products and services pro-duced in other years. The value of national income earned in this calculation is called the national income at a fixed price or real na-tional income (Sukirno 2004).
To be included in the final sample, the observation had to meet the following cri-teria: (1) The companies were manufactur-ing companies publicly listed on the Indo-nesian Stock Exchange; (2) The companies produced financial reports from 2000 until Net Income
3 http://www.investopedia.com/exam-guide/cfa-level-1/assets/fixed-asset-disclosures.asp, June 25 2014, 4.05
pm.
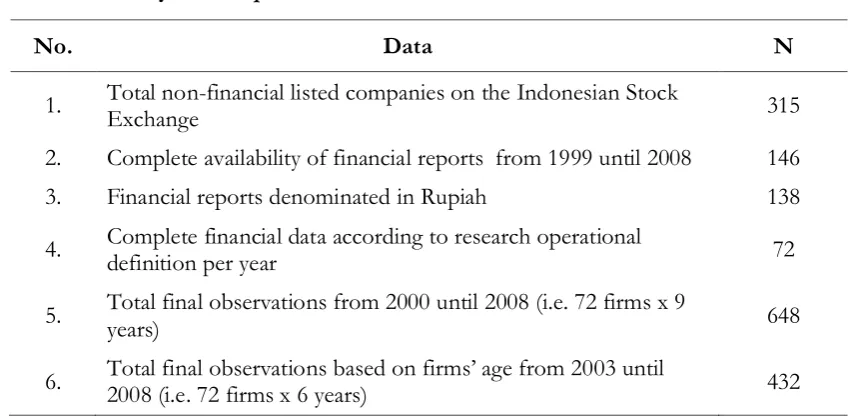
2008; (3) Financial statements had to be de-nominated in Rupiah (Rp). The result of the sample selection is shown in the table below. The total observations comprise of 648 items, covering 73 firms over a 9 year period, but given the availability of data of some firms’ ages, the total number observations were re-duced to 432, from 72 firms over 6 years.
Empirical Model
We employed 3 equations to test our hypotheses. The first model was used to test the model without the firms’ age variable, but using the moderating variables and industry category as independent variables. The sec-ond equation added the firms’ age variable without the moderating variables and indus-try category. While in the third equation, we simultaneously investigated the impact of the firms’ age, the moderating variables and the industry category. We used the industry cat-egories as control variables because many previous studies showed that firms’ charac-teristics are very sensitive to the industry cat-egory. Based on 9 industry sectorals listed on
the Indonesian Stock Exhange, we employed 7 industry categories, i.e.: (1) miscellaneous industries; (2) the trade, service, and invest-ment industries; (3) basic industries and the chemical industry; (4) mining; (5) the con-sumer products industry; (6) the agricultural industries; (7) the infrastructure, utilities and transportation, plus property and real estate industries. Thus, we used 6 dummy variables and we set the infrastructure, utilities and transportation plus property and real estate industries as the base category. Finally, we also used years as dummy variables to see whether there was an influence from the eco-nomic crisis on firms’ growth opportunities. Empirical models in this study were formu-lated as follows:
PBVit =+1ROAit-1 +2SIZEit-1 +
3ESTSit-1 +4LEVit-1 +5GNPit + 6INFit + it ……….…...… (1)
PBVit = + 1ROAit-1 + 2SIZEit-1 + 3ESTSit-1 + 4LEVit-1 + 5AGEit + 6GNPit + 7INFit + it ...… (2)
No. Data N
1. Total non-financial listed companies on the Indonesian Stock Exchange 315
2. Complete availability of financial reports from 1999 until 2008 146
3. Financial reports denominated in Rupiah 138
4. Complete financial data according to research operational definition per year 72
5. Total final observations from 2000 until 2008 (i.e. 72 firms x 9 years) 648
6. Total final observations based on firms’ age from 2003 until 2008 (i.e. 72 firms x 6 years) 432 Table 1. Summary of Sample Selection Procedure
PBVit = +1ROAit-1 +2SIZEit-1 +
PBV = Price to Book Value
= intercept
= coefficient
i = company indicator
t = year
ROA = return on assets
SIZE = logarithm of total assets ESTS = export sales per total assets LEV = long term debt per total assets “GNP = annual growth of GNP
INF = inflation rate AGE = firm age
ESTSSIZE = moderating variable, i.e. ex-port sales per total assets multiplied by firm’s size ESTSAGE = moderating variable, i.e.
ex-port sales per total assets multiplied by firm’s age DummyMI = dummy variable, coded as 1
for miscellaneous industries and zero (0) otherwise DummyTSI = dummy variable, coded as 1
for the trade, services and in-vestment industries and zero (0) otherwise
DummyBCI = dummy variable, coded as 1 for the basic and chemical industries and zero (0) oth-erwise
DummyMINE = dummy variable, coded as 1 for the mining industry and zero (0) otherwise
DummyCPI = dummy variable, coded as 1 for the consumer products industry and zero (0) other-wise
DummyAGR = dummy variable, coded as 1 for the agricultural industries and zero (0) otherwise DummyYears = dummy variable, coded as 1
for the years before 2007 and zero (0) otherwise
= error
Empirical Result
Descriptive Statistics
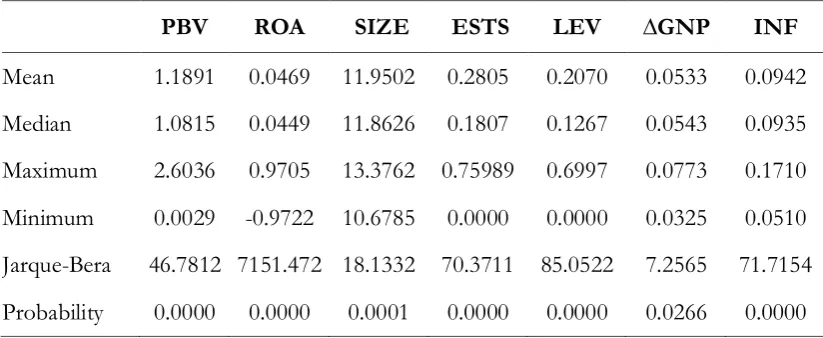
Table 2 provides descriptive statistics of the variables based on the Equation 1. The Normality Test showed that the PBV data does not have a normal distribution because Jarque-Bera was larger than 3, but consider-ing that our total observations are 648 (n>30) then the data fulfills the Central Limit Theo-rem and the data can be assumed to have a normal distribution.
20.70 percent, meaning that the major source of external financing came from equity.
The annual change in GNP (GNP) had an average value of 0.0533 or 5.33 per-cent and the average of the inflation rate (INF) was 0.0942 or 9.42 percent. Generally, the Indonesian government maintains the in-flation rate at under 10 percent, thus creat-ing a favorable environment for economic ac-tivities.
Statistical Result
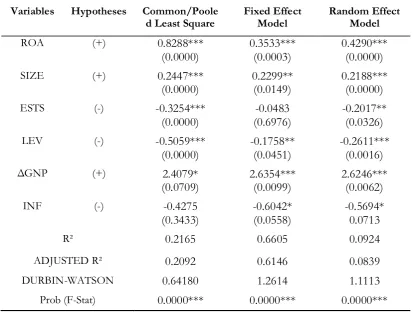
This study used a panel data, conse-quently we deployed 3 statistical models, i.e. the Common/Pooled Least Square (PLS), the Fixed Effect Model (FEM) and the Random Effects Model (REM). Table 3 below shows a summary of the results of the estimation coefficients and p-value of the first model.
Before we test the hypothesis, we have to test the best model from the 3 models shown above.4 The Chow Test is a statistical test that determines whether the Common/ Pooled Least Square method is used, or al-ternatively the Fixed Effect Model is em-ployed. The Chow Test result concluded that the most suitable method used for this regres-sion was the Fixed Effect Model. Further, to check if the Random Effects Model was a more appropriate model to use than the Fixed Effect Model, we ran the Hausman Test. The result from this test concluded that the Ran-dom Effects Model was the better statistical model because the p-value was not signifi-cant. Further observations from this study-i.e. that N (cross section) was greater than the sum of T (time series), showed that gen-erally, the Random Effects Model was more appropriate for this study.
Table 2. Descriptive Statistics
PBV ROA SIZE ESTS LEV ∆GNP INF
Mean 1.1891 0.0469 11.9502 0.2805 0.2070 0.0533 0.0942
Median 1.0815 0.0449 11.8626 0.1807 0.1267 0.0543 0.0935
Maximum 2.6036 0.9705 13.3762 0.75989 0.6997 0.0773 0.1710
Minimum 0.0029 -0.9722 10.6785 0.0000 0.0000 0.0325 0.0510
Jarque-Bera 46.7812 7151.472 18.1332 70.3711 85.0522 7.2565 71.7154
Probability 0.0000 0.0000 0.0001 0.0000 0.0000 0.0266 0.0000
4 We used the Chow Test and Hausman Test to decide the best prediction model. The Chow Test is a test to
determine whether PLS or FEM is better. The hypothesis is stated as follow: H0: Use Common / pooled model Least Square (PLS)
H1: Use the Fixed Effect Model (FEM)
The Hausman Test was used to determine whether the REM or FEM model was better. The hypothesis is stated as follow:
Table 3. Summary of Statistical Output of First Model
Variabel Dependent: PBV
Variables Hypotheses Common/Poole
d Least Square Fixed Effect Model Random Effect Model
ROA (+) 0.8288***
(0.0000) 0.3533*** (0.0003) 0.4290*** (0.0000)
SIZE (+) 0.2447***
(0.0000) 0.2299** (0.0149) 0.2188*** (0.0000)
ESTS (-) -0.3254***
(0.0000) (0.6976) -0.0483 -0.2017** (0.0326)
LEV (-) -0.5059***
(0.0000) -0.1758** (0.0451) -0.2611*** (0.0016)
ΔGNP (+) 2.4079*
(0.0709) 2.6354*** (0.0099) 2.6246*** (0.0062)
INF (-) -0.4275
(0.3433) -0.6042* (0.0558) -0.5694* 0.0713
R² 0.2165 0.6605 0.0924
ADJUSTED R² 0.2092 0.6146 0.0839
DURBIN-WATSON 0.64180 1.2614 1.1113
Prob (F-Stat) 0.0000*** 0.0000*** 0.0000***
*** significant at a level of 1 percent ** significant at a level of 5 percent * significant at a level of 10 percent
Redundant Fixed Effects Tests
Pool: FEM1
Test cross-section fixed effects
Effects Test Statistic d.f. Prob.
Cross-section F 10.4959 (71,570) 0.0000
Cross-section Chi-square 541.8024 71 0.0000
Correlated Random Effects - Hausman Test
Pool: REM1
Test cross-section random effects
Cross-section random 0.000000 6 1.0000
In general, the regression model output with the Random Effects method can be con-sidered as good. This was indicated by the significant value of Prob (F-statistic), which meant that the model was able to explain the relationship between the Investment Oppor-tunity Set as the dependent variable and the independent variables, namely profitability (ROA), firms’ size (SIZE), degree of inter-nationalization (ESTS), leverage (LEV), the annual GNP growth (ÄGNP) and the rate of inflation (INF).
We found that profitability (ROA) had a positive effect on the IOS. Hence, a greater firm profitability also shows a larger possi-bility of retained earnings for investment purposes (Riahi- Belkaoui and AlNajjar 2001; Riahi-Belkaoui 2002). We also found that the IOS was positively affected by a firm’s size (AlNajjar and Riahi-Belkaoui 2001). This finding supports that small companies often face limitations or difficulties in determining their choice and execution of new projects, or difficulties in restructuring existing assets. On the other hand, large companies and more established companies tend to be more ac-tive in increasing the value of their invest-ment in various ways, such as product differ-entiation to create barriers to entry, econo-mies of scale, and patents (Chung and Charoenwong 1991). Thus, large companies tend to dominate market positions in their industry.
Our result showed that the level of in-ternationalization (ESTS) negatively affected the IOS (Hasibuan 2007), so the level of in-ternationalization hampers the investment growth opportunities. This result corroborates the argument that companies face uncertainty and constraints relating to the environment at the international level (Delios and Henisz 2000). International trade regulation in the country where the company is expanding its
market will constrain the degree of interna-tionalization of the firm (Hill 2007).
Firm leverage (LEV) negatively affected the IOS (Smith and Watts 1992; Gaver and Gaver 1993; Gul 1999; AlNajjar and Riahi-Belkaoui 2001). The interest payments and principal of debt may increase the potential loss of investment because the interest and principal payments can be higher than the return on the investment. In addition, using leverage in the firm’s capital structure also limits the investment decisions due to the boundaries in debt covenants (negative cov-enants), where the lender imposes certain re-strictions to ensure repayment of the princi-pal and interest.
Finally, we found that macroeconomic variables influenced the IOS. The annual change of GNP (DGNP) had a positive in-fluence on the IOS, so our result supports the idea that a positive trend in GNP growth will create a favorable climate for investment (Riahi-Belkaoui 2002). Meanwhile, the infla-tion rate (INF) had a negative influence on the IOS. Therefore, the rate of inflation tends to reduce a company’s motivation to develop its economic activities. Investment by a firm is highly dependent on changes in the infla-tion rate because the inflainfla-tion rate determines the interest rates and consequently affects the costs of capital for investing firms. High in-flation rates will increase interest rates, which in turn will reduce investment (Ratnawati 2007).
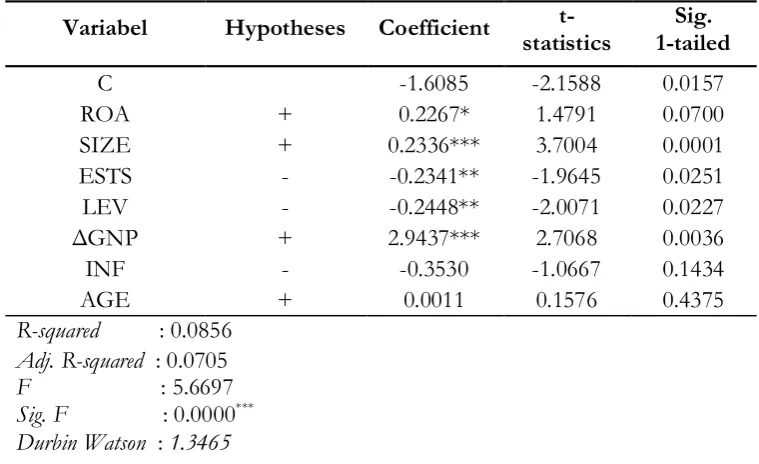
negatively affected by leverage and signifi-cant at 5 percent; (4) we failed to find the influences of inflation and firms’ age on the IOS. Therefore, the length of time a firm has existed in the industry does not increase its growth opportunities.
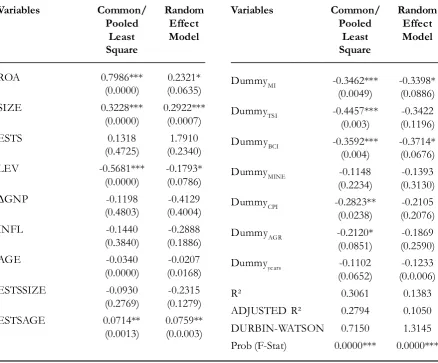
Nevertheless, when we tested the mod-erating effect of firms’ size and firms’ age on firms’ growth opportunities as shown in Table 65, we found that only a firm’s age had a mod-erating effect on the IOS. Thus, this result supports previous studies that find the nega-tive influence of internationalization is weak-ened by a firm’s age. Older fims are assumed: (1) to have a lower risk when conducting for-eign expansion plans because these firms tend to have abundant resources and experience (Fernandez and Nieto 2006; Claver et al. 2008; Shrader et al. 2000); (2) the degree of
risk aversion to enter a foreign market can be reduced by older firms (Singla and George 2013).
Next, Table 6 also shows that several industries have a lower IOS than other in-dustries, i.e. (a) miscellaneous industries (sig. at 1%); (b) trade, services and investment (sig. at 1%); (c) basic and chemical industries (sig. at 1%); (e) consumer products industries (sig. at 5%); and (f) the agricultural industries (sig. at 10%). Thus, we concluded that firms’ IOS was highly determined by the industry category.
We also found that the IOS had a posi-tive relationship on firms’ profitability and firms’ size, while leverage had a negative impact on IOS. Finally, our results failed to find the relationship between economic con-ditions and IOS.
5 We already test OLS, FEM, and REM but FEM cannot be tested because we have a near singular matrix
problem. Further, based on OLS and REM, we conclude that OLS is the best prediction model because it has greater R-squared.
Variabel Hypotheses Coefficient statistics t- 1-tailed Sig.
C -1.6085 -2.1588 0.0157
ROA + 0.2267* 1.4791 0.0700
SIZE + 0.2336*** 3.7004 0.0001
ESTS - -0.2341** -1.9645 0.0251
LEV - -0.2448** -2.0071 0.0227
ΔGNP + 2.9437*** 2.7068 0.0036
INF - -0.3530 -1.0667 0.1434
AGE + 0.0011 0.1576 0.4375
R-squared : 0.0856
Adj. R-squared : 0.0705
F : 5.6697 Sig. F : 0.0000***
Durbin Watson : 1.3465
Table 5. Summary of Statistical Output of Second Model
Variables Common/ Random
Pooled Effect
Least Model
Square
ROA 0.7986*** 0.2321*
(0.0000) (0.0635)
SIZE 0.3228*** 0.2922***
(0.0000) (0.0007)
ESTS 0.1318 1.7910
(0.4725) (0.2340)
LEV -0.5681*** -0.1793*
(0.0000) (0.0786)
GNP -0.1198 -0.4129
(0.4803) (0.4004)
INFL -0.1440 -0.2888
(0.3840) (0.1886)
AGE -0.0340 -0.0207
(0.0000) (0.0168)
ESTSSIZE -0.0930 -0.2315
(0.2769) (0.1279)
ESTSAGE 0.0714** 0.0759**
(0.0013) (0.0.003)
Variables Common/ Random
Pooled Effect
Least Model
Square
DummyMI -0.3462*** -0.3398* (0.0049) (0.0886) DummyTSI -0.4457*** -0.3422 (0.003) (0.1196) DummyBCI -0.3592*** -0.3714* (0.004) (0.0676) DummyMINE -0.1148 -0.1393 (0.2234) (0.3130) DummyCPI -0.2823** -0.2105 (0.0238) (0.2076) DummyAGR -0.2120* -0.1869 (0.0851) (0.2590) Dummyyears -0.1102 -0.1233 (0.0652) (0.0.006)
R² 0.3061 0.1383
ADJUSTED R² 0.2794 0.1050 DURBIN-WATSON 0.7150 1.3145 Prob (F-Stat) 0.0000*** 0.0000*** Table 6. Summary of Statistical Output of Third Model
Variabel Dependent: PBV
*** significant at the 1 percent level ** significant at the 5 percent level * significant at the 10 percent level
Conclusion
The aim of this study was to examine the impact of internal and external factors on firms’ Investment Opportunity Set. When we tested without the industry category and the moderating effects, the result showed that internal factors, i.e. profitability and firm size had a positive impact on the IOS, while firms’ leverage and their degree of internationaliza-tion had a negative influence on IOS.
firms’ IOS. Further, the IOS is also deter-mined by favorable macroeconomic condi-tions. Finally, when we investigated the in-dustry category and the moderating effects of firms’ size and age, we concluded that: (1) the negative relationship between the IOS and the degree of internationalization was weakened by the firms’ age; (2) certain in-dustries have lower growth than other indus-tries, i.e. miscellaneous indusindus-tries, trade,
ser-vices and investment, basic and chemical in-dustries, consumer products industries; and f) the agricultural industries. The implications from this result are: first, mature firms may conduct higher levels of internalization com-pared to newer firms because the negative impacts on firms’ IOS can be weakened. Sec-ond, several industries have a lower potential gain compared to other industries.
References
Adam, T., and V. K. Goyal. 2007. The Invesment Opportunity Set and It’s Proxy Variables. Hong Kong Univer-sity of Science and Technology.
AlNajjar, F. K., and A. Riahi-Belkaoui. 2001. Empirical validation of a general model of growth oppor-tunities. Managerial Finance 27: 72-90.
Angeline, I. 2007. Analisis pengaruh likuiditas saham, tingkat leverage dan risiko sistematik terhadap return saham (Survey pada perusahaan consumer goods yang terdaftar di BEJ). Thesis. Unpublished. Universitas Indonesia.
Bloodgood, J. M., H. J. Sapienza, and J. G. Almeida. 1996. The internationalization of new high-potential US venture: Antecedents and outcomes. Entrepreneurship Theory and Practice 20 (4): 61"76.
Bodie, Z., A. Kane, and A. J. Marcus. 2009. Investments (8th ed.). McGraw-Hill International Edition. Chung, K. H., and C. Charoenwong. 1991. Investment options, assets in place, and the risk of stocks. The
Financial Management Association International 20: 21-33.
Claver, E., L. Rienda, and D. Quer. 2008. Family firms’ risk perception: Empirical evidence on the internationalization process, Journal of Small Business and Enterprise Development 15 (3): 457–471. Delios, A, and W. J. Henisz. 2000. Japanese firms’ investment strategies in emerging economies. Academy of
Management Journal 43: 305-323.
Febriana, D. 2004. Analisis faktor-faktor yang mempengaruhi underpricing saham pada perusahaan go public di BEJ (2000-2002). Skripsi. Unpublished Yogyakarta.
Fernandez, Z., and M. J. Nieto. 2006. Impact of ownership on the international involvement of SMEs. Journal of International Business Studies 37 (3): 340–351.
Ferri, M. G., and W. H. Jones. 1979. Determinants of financial structure: A new methodological ap-proach. The Journal of Finance 34: 631-644.
Filatotchev, I., and J. Piesse. 2009. R&D, internationalization and growth of newly listed firms: European evidence. Journal of International Business Studies 40 (8): 1260-1276.
Gaver, J. J., and K. M. Gaver. 1993. Additional evidence on the association between investment opportu-nity set and corporate financing, dividend and compesation policies. Journal of Accounting and Eco-nomics 16: 125-160.
Hasibuan, E. 2007. Analisis hubungan profitabilitas, ukuran perusahaan, multinasionalitas, struktur keuangan, dan risiko sistematis dengan investment opportunity set pada perusahaan manufaktur periode 2003-2005. Skripsi. Unpublished, Universitas Indonesia.
Hill, C. W. L. 2007. International Business. New York: Mc Graw-Hill Inc.
Ho, S. S. M., C. K. Kevin Lam, and H, Sami. 2004. The investment opportunity set, director ownership, and corporate policies: Evidence from an emerging market. Journal of Corporate Finance 10: 383-408.
Hope, O., W. Thomas, and D. Vyas. 2011. The cost of pride: Why do firms from developing countries bid higher? Journal of International Business Studies 42: 128–151.
Kallapur, S., and M. A. Trombley. 1999. The association between investment opportunity set proxies and realized growth. Journal of Business Finance and Accounting 26: 505– 519.
Kallapur, S., and M. A. Trombley. 2001. The investment oportunity set: Determinants, consequences and measurement. Managerial Finance 27: 3-15.
Keown, A. J., J. D. Martin, J. W. Petty, and D. F. Scott. 2002). Financial Management Principles and Applications (9th ed.) Upper Saddle River York, NJ: Prentice Hall.
Kester, W. C. 1984. Today’s option for tomorrow’s growth. Harvard Business Review, (March/April): 153-160.
Kim, W. C., P. Hwang, and P. Burgers. 1989. Global diversification strategy and corporate performance, Strategic Management Journal 10, 45–57.
Lakonishok, J., A. Shleifer, and R. Vishny. 1994. Contrarian investment, extrapolation and risk. Journal of Finance 49: 1541-1578.
Mason, S. P., and R. C. 1985: The Role of Contingent Claims Analysis in Corporate Finance. In E. Altman, and M. Subrahmanyam, Recents Advances in Corporate Finance (p.: 7-54). Homewood, IL: Richard D. Irwin. Myers, S. C. 1977. Determinants of corporate borrowing, Journal of Financial Economics 5, 147-175. OECD. 2012. OECD Reviews of Regulatory Reform Indonesia: Market Openness. www.oecd.org/indonesia/
chap%204%20-%20market%20openness.pdf.
Ratnawati, T. 2007. Pengaruh langsung dan tidak langsung faktor ekstern, kesempatan investasi dan pertumbuhan asets terhadap keputusan pendanaan perusahaan yang terdaftar oada Bursa Efek Jakarta: Studi pada Industri Manufaktur Masa Sebelum Krisis dan Saat Krisis. Jurnal Akuntansi dan Keuangan 9: 65-75.
Riahi-Belkaoui, A. 2002. Profitability, multinationality and the investment opportunity set. Advances in Inter-national Accounting 15: 1-12.
Shrader, R. C., M. M. Oviatt, and P. P. McDougall. 2000. How new ventures exploit trade-offs among international risk factors: Lessons for the accelerated internationalization of the 21st century. The Academy of Management Journal 43(6):1227–1247.
Singla, C., and R. George. 2013. Internationalization and performance: A contextual analysis of Indian firms. Journal of Business Research 66: 2500-2506.
Smith, C. W. Jr., and R. L. Watts. 1992. The investment opportunity set and corporate financing, dividend, and compensation policies. Journal of Financial Economics 32: 263-292.
Sukirno, S. 2004. Makroekonomi: Teori Pengantar. Jakarta: PT RajaGrafindo Persada.
Sullivan, D. 1994. Measuring the degree of internationalization of a firm. Journal of International Business Studies 25: 325.
Tumpal, B., and H. Natalia. 2008. Analisa pengaruh kombinasi keunggulan dan keterbatasan perusahaan terhadap set kesempatan investasi (IOS): Studi kasus pada perusahaan manufaktur yang terdaftar di Bursa Efek Indonesia 2007. Skripsi. Unpublished.
Vogt, S. C. 1997. Cash flow and capital spending: Evidence from capital expenditure announcements. Financial Management 26: 44-57.
Wibowo, N., and R. Andiyani. 2008. Analisa variabel struktur aktiva, tingkat pertumbuhan penjualan, ukuran perusahaan, degree of operating leverage, dividend payout ratio, dan profitability yang mempengaruhi struktur keuangan pada perusahaan manufaktur yang terdaftar di Bursa Efek Indo-nesia. Skripsi. Surabaya.
Xiao, S.S., I. Jeong, J. J. Moon, C. C. Chung, and J. Chung. 2013. Internationalization and performance of firms in China: Moderating effects of governance structure and the degree of centralized control. Journal of International Management 19: 118-137.