Malaysian
Registry of
Intensive Care
Malaysian Registry of Intensive Care
Report for 2009
(Previously known as National Audit of Adult Intensive Care Units)
Prepared by
Technical Committee of
May 2010
© Malaysian Registry Of Intensive Care
Published by:
Malaysian Registry of Intensive Care
Clinical Research Centre
Ministry of Health Malaysia
Disclaimer:
This work may be reproduced in whole or part for study or training purposes, subject
to the inclusion of an acknowledgement of the source.
Suggested citation:
Jenny MG Tong, LL Tai, CC Tan, Ahmad S, Asniza, CH Lim
Malaysian Registry of Intensive Care 2009 report
Electronic version:
CONTENTS
Page
Contents………. 4
Report Summary………... 5
Acknowledgement……… 6
Foreword……… 7
MRIC Technical Committee 2009………. 8
Participating Hospitals……… 9
Categories of ICU ………. 10
Site Investigators and Source Data Providers 2009…..……… 11
Abbreviations……… 14
List of Tables………. 15
List of Figures……… 16
Introduction……….. 17
Results Section A General Information……… 19
Section B Patient Characteristics……… 24
Section C Interventions……… 40
Section D Complications………. 48
Section E Mortality Outcomes………... 57
Summary 64
REPORT SUMMARY
This is the report on all intensive care admissions to the 31 participating centres from 1 January to 31 December 2009.
The following are the main findings:
1. The total number of ICU beds in the 31 participating units was 330 with a bed occupancy rate of 87%.
2. The number of cases analysed was 21226, an increase of 12% over the previous year.
3. The overall reporting rate had been fairly constant at 89%.
4. The percentage of patients denied admission due to the unavailability of ICU beds had declined from 56.5% to 40.0% in the last four years.
5. The average age of the patients, excluding those below 18 years, was 50.3 years.
6. The average lengths of ICU and hospital stay were 4.4 and 14.4 days respectively.
7. In MOH hospitals, 62% of ICU admissions were non-operative patients.
8. Direct admissions to ICU from the emergency department had increased from 9% in 2004 to 21% in 2009.
9. 62% of ICU admissions had one or more organ failure within 24 hours of admission.
10. Head injury, sepsis and community-acquired pneumonia were the three most common diagnoses leading to ICU admission in MOH hospitals. This trend had remained the same over the past 7 years. The in-hospital mortality rates for this group of patients were 27.0%, 62.2% and 46.3% respectively.
11. The average SAPS II score was 35.8, which carries a predicted risk of in-hospital mortality of 28.0%.
12. In MOH hospitals, 79.3% of patients received invasive ventilation with an average duration of 4.3 days.
13. The percentage of patients who received non-invasive ventilation increased from 6.5% in 2003 to 13.3% in 2009.
14. The incidence of VAP decreased by more than half, from 28.0 to 11.6 per 1000 ventilator days, in the last seven years.
15. The crude in-ICU and in-hospital mortality rates were 21.2% and 29.7% respectively.
ACKNOWLEDGEMENT
The Malaysian Registry of Intensive Care would like to thank the following:
All site investigators and source data providers
The heads of Department of Anaesthesia and Intensive Care of participating ICUs
Staff of the participating ICUs
Quality of Health Care Section, Medical Development Division, Ministry of Health
Clinical Research Centre, Ministry of Health
and
FOREWORD
This is the 7th report of the intensive care database started in 2002, under the ambit of
National Audit of Adult Intensive Care Units (NAICU). Although there has been a re-structuring of the organisation and even a name change (now called Malaysian Registry of Intensive Care, MRIC), the activity of auditing the intensive care practice in Ministry of Health hospitals has continued to grow and this report is the culmination of that effort.
In the last two years, MRIC had faced uncertainties in funding and technical support. Thankfully the problem has been resolved. The Malaysian Society of Intensive Care (MSIC) is now the main sponsor of the activity while the Clinical Research Centre (CRC) provides the backend server support and the Quality Unit, Medical Development Division, the administrative assistance. This arrangement will undoubtedly provide a conducive environment for future development.
I would like to express my utmost appreciation to my colleagues in the National Technical Committee under the leadership of Dr. Jenny Tong, for their commitment and hard work during this trying period. Not only has the MRIC persevered, it has achieved remarkable success in migrating the electronic records from stand-alone units to a web-based programme. In these seven years, the number of centres recruited had grown from 14 to 31; the number of intensive care beds studied from 100 to 330 and the number of patients analysed from 7,000 to 22,000. This two to three-fold increase is testament of the strength and success of MRIC.
Clinicians’ support has been, and will remain, essential to the future of the registry. Ultimately, the purpose of the registry is to improve quality of care. The Anaesthetic and Intensive Care Service in Ministry of Health, with the support of the administrators and health managers has achieved improvement in access and patient outcome. The percentage of patients denied ICU admission and the incidence of ventilator-associated pneumonia have declined over the years. In the coming year, the focus will be on other quality improvement activities such as central venous catheter care bundle and skin care bundle. I am confident that similar trends in improving patient safety will continue.
Dr Ng Siew Hian National Advisor
TECHNICAL COMMITTEE
MALAYSIAN REGISTRY OF INTENSIVE CARE 2009
Advisor Dr. Hjh Kalsom Maskon
Deputy Director (Quality of Health Care Section) Medical Development Division, Ministry of Health
Dr. Ng Siew Hian
Consultant Anaesthesiologist and Head
Department of Anaesthesia and Intensive Care Hospital Kuala Lumpur
Principal Investigator Dr. Jenny Tong May Geok
Consultant Anaesthesiologist and Head Department of Anaesthesia and Intensive Care Hospital Tuanku Ja’afar Seremban
Co-Investigators Dr. Tai Li Ling
Consultant Intensivist
Department of Anaesthesia and Intensive Care Hospital Kuala Lumpur
Dr. Tan Cheng Cheng Consultant Intensivist
Department of Anaesthesia and Intensive Care Hospital Sultanah Aminah Johor Bahru
Dr. As-niza Abdul Shukor
Consultant Anaesthesiologist and Head Department of Anaesthesia and Intensive Care Hospital Taiping
Dr. Ahmad Shaltut Othman Consultant Intensivist
Department of Anaesthesia and Intensive Care Hospital Sultanah Bahiyah Alor Setar
Dr. Lim Chew Har Consultant Intensivist
Department of Anaesthesia and Intensive Care Hospital Pulau Pinang
Medical Development Division,
Ministry of Health
Dr. Paa Nasir Abdul Rahman Principal Assistant Director
Dr. Fakhruddin Amran Assistant Director
PARTICIPATING HOSPITALS
No. Name of hospital Abbreviation Sites since 2002
1. Hospital Sultanah Bahiyah Alor Setar AS
2. Hospital Pulau Pinang PP
3. Hospital Raja Permaisuri Bainun Ipoh IPH
4. Hospital Kuala Lumpur KL
5. Hospital Selayang SLG
6. Hospital Tengku Ampuan Rahimah Klang KLG
7. Hospital Tuanku Ja’afar Seremban SBN
8. Hospital Melaka MLK
9. Hospital Sultanah Aminah Johor Bahru JB
10. Hospital Tengku Ampuan Afzan Kuantan KTN
11. Hospital Sultanah Nur Zahirah Kuala Terengganu KT
12. Hospital Raja Perempuan Zainab II Kota Bharu KB
13. Hospital Umum Sarawak Kuching KCH
14. Hospital Queen Elizabeth Kota Kinabalu KK
Sites since 2005
15. Hospital Sultan Abdul Halim Sungai Petani SP
16. Hospital Putrajaya PJY
17. Hospital Pakar Sultanah Fatimah Muar MUR
18. Hospital Teluk Intan TI
19. Hospital Taiping TPG
20. Hospital Seberang Jaya SJ
21. Hospital Kajang KJG
22. Hospital Tuanku Fauziah Kangar KGR
Sites since 2006
23. Sime Darby Medical Centre Subang Jaya SDMC
24. Hospital Sultan Haji Ahmad Shah Temerloh TML
25. Hospital Tuanku Ampuan Najihah Kuala Pilah KP
CATEGORIES OF ICU
Based on the number of ICU beds (for the purpose of MRIC 2009 report)
Participating sites with 12 ICU beds or more (as of 30th June 2009) 1. Hospital Sultanah Bahiyah Alor Setar
2. Hospital Raja Permaisuri Bainun Ipoh
3. Hospital Taiping
4. Hospital Kuala Lumpur
5. Hospital Selayang
6. Hospital Tengku Ampuan Rahimah Klang
7. Hospital Melaka
8. Hospital Sultanah Aminah Johor Bahru
9. Hospital Sultanah Nur Zahirah Kuala Terengganu
10. Hospital Raja Perempuan Zainab II Kota Bharu
Participating sites with less than 12 ICU beds (as of 30th June 2009) 11. Hospital Tuanku Fauziah Kangar
12. Hospital Pulau Pinang
13 Hospital Tengku Ampuan Afzan Kuantan
14. Hospital Tuanku Ja’afar Seremban
15. Hospital Umum Sarawak Kuching
16. Hospital Queen Elizabeth Kota Kinabalu
17. Hospital Seberang Jaya
18. Hospital Sultan Abdul Halim Sungai Petani
19. Hospital Teluk Intan
20. Hospital Kajang
21. Hospital Pakar Sultanah Fatimah Muar
22. Hospital Putrajaya
23. Hospital Serdang
24. Hospital Sultan Haji Ahmad Shah Temerloh
25. Hospital Tuanku Ampuan Najihah Kuala Pilah
26. Hospital Sri Manjung
LIST OF SITE INVESTIGATORS AND SOURCE DATA COLLECTORS
January – December 2009
No Hospital Site investigator Data collectors
1 Sultanah Bahiyah Alor Setar
Dr Ahmad Shaltut Othman
SN Azura bte Che Don (Jan-Sept 2009)
SN Mazni bte Abas (Jan-Sept 2009) SN Hafisoh Ahmad (Oct-Dec 2009) SN Haslina Khalid (Oct-Dec 2009) Sr Teoh Shook Lian
SN Seniwati bt Salleh
2 Pulau Pinang Dr Lim Chew Har SN Khairulniza bt Razar
SN Rosmalizawati bt Ibrahim SN Siti Hazlina bt Bidin
3 Raja Permaisuri Bainun Ipoh
Dr Azlina Muhamad SN Khairiah bt Mat Daud
SN Saadiah bt Bidin
4 Kuala Lumpur Dr Tai Li Ling SN Prema Chitrasenan
SN Alice Nesamany Thangapandi (Jan-Sept 2009)
5 Selayang Dr Haslinda Abd Hashim
(Jan-Oct 2009) Dr Laila Kamariah (Oct-Dec 2009)
SN Norzaila bte Saad SN Noor Azawati bt Daud
6 Tengku Ampuan
Rahimah Klang
Dr Faezah bt Shaari SN Latifah bt Omar SN Norlaili bt Ismail
7 Tuanku Ja’afar Seremban Dr Jenny Tong May Geok Sr Chew Bee Ngoh SN Farawahida bt Ahmad
8 Melaka Dr Anita Alias SN Morni bt Omar
9 Sultanah Aminah Johor Bahru
Dr Tan Cheng Cheng SN Aisah bt Abu Bakar
AMO Mohd Zakuan bin Mohd Nor AMO Anuar bin Ismail
AMO Hairizam bin Zulkhifli
10 Tengku Ampuan Afzan
Kuantan
Dr Rusnah bte Ab. Rahman
SN Aminah bte Abd Hamid Sr Noorhani bt Kassim
11 Sultanah Nur Zahirah Kuala Terengganu
Dr Mohd Ridhwan bin Mohd Nor
SN Zauwiah bt Idris
SN Norhayati bt Abd Rosman
12 Raja Perempuan Zainab II Kota Bharu
Dr Mat Ariffin Saman (Jan-Oct 2009)
Dr Wan Nasrudin bin Wan Ismail
(Oct-Dec 2009)
13 Umum Sarawak Kuching Dr Intan Zarina bt Fakir SN Norelsa bt Daim SN Sabia Lew SN Rosmica Jiton
14 Queen Elizabeth Kota Kinabalu
Dr Khoo Tien Meng SN Doren Abel (Jan-Oct 2009) SN Jusim Lugu
SN Conny Chong Chiew Fah (Oct- Dec 2009)
15 Sultan Abdul Halim Sungai Petani
Dr Ahmad Zaini b Mohd Salleh
SN Halijah Hasim SN Rafiza Md Zuki Sr Puziah bt Yahya
16 Putrajaya Dr Fauziah bt Yusoff SN Noryasni bt Mahtrod @Ahamed
SN Latifah bt Mohd Korib Sr Noorainee bt Romi
17 Pakar Sultanah Fatimah Muar
Dr Yogabigai Balasundram
SN Ropeah bt Ahmad SN Roslina bt Othman
18 Teluk Intan Dr Khairudin bin Zainal
Abidin (Jan-Dec 2009) Dr Wang Shir Siong (Dec 2009)
SN Azliza bt Zakaria SN Rohayu Dalila bt Yusof AMO Mohd Najib bin Misbah
19 Taiping Dr As-niza Abdul Shukor SN Umi Khatijah bt Bani
SN Saleha bt Salleh
20 Seberang Jaya Dr Jainisda bt Zainuddin SN Zuraina bt Muhamad
SN Nooraslina bt Othman SN Noorazleena bt Hasim
21 Kajang Dr Wan Hafizah bt Wan
Tajul Ariffin
SN Faiza bt Mat Yusof
22 Tuanku Fauziah Kangar Dr Azilah bt Desa SN Zarina Mat Bistaman
SN Julaida bt Din SN Zulminarni bt Ariffin
23 Sime Darby Medical Center Subang jaya
Dr Alan Wong Ket Hiung SN Navjeet Kaur
SN Normazimah bt Mohamad Nazar
24 Sultan Haji Ahmad Shah Temerloh
Dr.Rahimah bt Haron SN Rakiah bt Mohd Noor
SN Zaiton bt Isa
25 Tuanku Ampuan Najihah Kuala Pilah
Dr.Sharuddin bin Musa (Jan-May 2009)
Dr Zalifah bt Nordin (May-Dec 2009)
SN Noormaisah bt Mohd Derus (Jan-May 2009)
26 Sri Manjung Dr.Tin Tin Myint Sr Rohana Ali
SN Hartini A.Rahman
27 Batu Pahat Dr.Azmiza bt Mahani
(Jan-July 2009) Dr Azizul Hisham b Bahari (July-Dec 2009)
SN Zaidah bt Othman (Jan-Aug 2009) SN Rosmawati bt Saimin
28 Tawau Dr.Kyaw Soe SN Lilybeth Feliciano Perez
SN Sarwah bt Isa
29 Miri Dr Noorhafizah bt
Ghazali
SN Norlida bt Daud SN Zurina bt Achim
30 Kulim Dr.Chua Kok Boon
Dr Loh Hoong Heng
SN Mohana bt Omar
SN Bahayah bt Mohamed Bakairi Sr Mahani bt Hassan
31 Serdang Dr.Mohd Yani Bahari SN Zamzurina bt Jahaya
ABBREVIATIONS
Adm. Admission
AMO Assistant medical officer
AOR At own risk
APACHE II Acute Physiologic and Chronic Health Evaluation (Version II)
CRRT Continuous renal replacement therapy
ED Emergency department
ENT Otorhinolaryngology
HD Haemodialysis
HDU High dependency unit
Hosp Hospital
ICU Intensive care unit
Int. Intensive
MOH Ministry of Health
MRIC Malaysian Registry of Intensive Care
MV Mechanical ventilation
NA Not available
NAICU National Audit on Adult Intensive Care Units
NIV Non-invasive ventilation
NHSN National Healthcare Safety Network
NNIS National Nosocomial Infection Surveillance
No. Number
O&G Obstetrics & Gynaecology
Refer. Referred
SAPS II Simplified Acute Physiologic Scoring System (Version II)
SD Standard deviation
SMR Standardised mortality ratio
SN Staff nurse
SOFA Sequential Organ Failure Assessment
Sr Sister
SPSS Statistical Package for Social Sciences
VAP Ventilator-associated pneumonia
VCB Ventilator care bundle
Yrs Years
LIST OF TABLES
Page
Table 1 ICU beds and ICU bed occupancy rate, by MOH hospitals 2007-2009……….. 19
Table 2 ICU admissions, by individual hospital 2004 – 2009……… 20
Table 3 Reporting rates, by individual hospital 2007 – 2009………. 22
Table 4 Intensive care referrals and refusal of admission, by individual hospital 2004 – 2009………... 23
Table 5 Gender 2004-2009………... 24
Table 6 Mean age 2004-2009……….. 24
Table 7 Ethnic groups 2009………. 26
Table 8 Length of ICU stay, by individual hospital 2004 – 2009………... 26
Table 9 Length of hospital stay, by individual hospital 2004 – 2009……… 27
Table 10 Referring units 2009 ……….. 28
Table 11 Category of patients 2009……….………. 29
Table 12 Category of patients in MOH hospitals 2004-2009 ………... 30
Table 13 Location before ICU admission, by hospitals 2009………... 31
Table 14 Location before ICU admission in MOH hospitals 2004 – 2009………. 31
Table 15 Indication for ICU admission 2009 ……….……….... 32
Table 16 Main organ failure on ICU admission 2009 ……….……….. 33
Table 17 Number of organ failure(s) on ICU admission 200……… 34
Table 18 Ten most common diagnoses leading to ICU admission 2009 ………... 35
Table 19 Ten most common diagnoses leading to ICU admission using APACHE II diagnostic category 2009 ………. 37
Table 20 SAPS II score, by individual hospital 2003 – 2009 ……… 38
Table 21 SOFA score, by individual hospital 2007 – 2009 ………... 39
Table 22 Invasive ventilation, non-invasive ventilation and reintubation 2009 ……….. 40
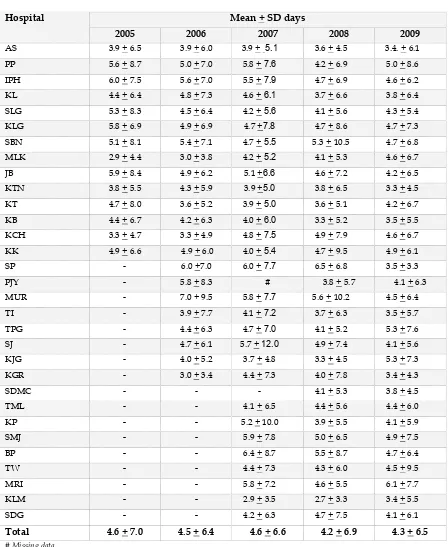
Table 23 Duration of invasive ventilation, by individual hospital 2005 – 2009 ……… 42
Table 24 Renal replacement therapy and modalities of therapy 2009………... 43
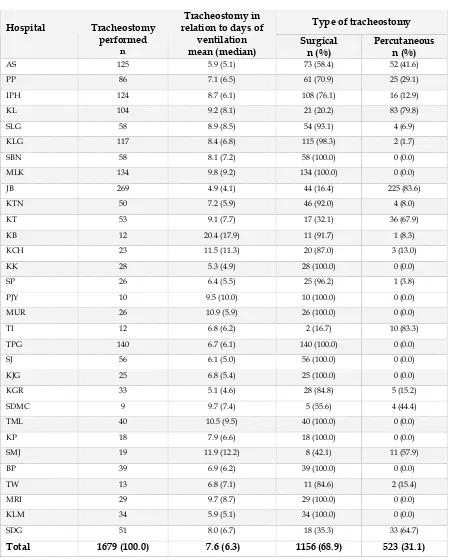
Table 25 Tracheostomy 2009 ………..………. 44
Table 26 Tracheotomy, by individual hospital 2009………. 45
Table 27 Tracheostomy, by individual hospital 2006-2009……….. 46
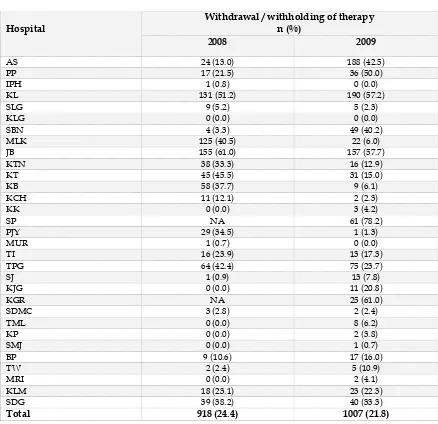
Table 28 Withdrawal /withholding of therapy, by individual hospital 2008-2009…………. 47
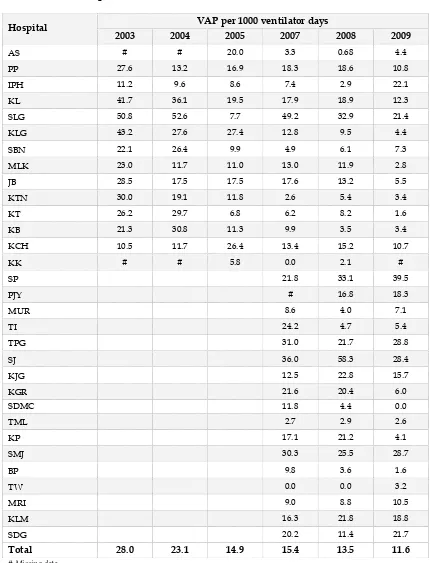
Table 29 Incidence of ventilator-associated pneumonia, by individual hospital 2003 –2009… 48 Table 30 Onset of VAP from initiation of invasive ventilation, by individual hospital 2007 2009………. 49
Table 31 Bacteriological cultures in VAP 2009 ………. 52
Table 32 Bacteriological cultures in VAP 2007 – 2009………. 52
Table 33 Unplanned extubation per 100 intubated days, by individual hospital 2003 – 2009… 54 Table 34 Pressure ulcer, by individual hospital 2009 ……… 56
Table 35 Hospital outcome 2009 ……… 57
Table 36 Crude in-ICU and in-hospital mortality rates, by individual hospital 2004 – 2009 58 Table 37 Ten most common diagnoses leading to ICU admission and observed in-hospital mortality in MOH hospitals 2009……… 61
Table 38 Interventions, complications and observed in-hospital mortality 2009………. 61
LIST OF FIGURES
Page
Figure 1 ICU admissions, by participating centres 2009 ……… 21
Figure 2 ICU admissions 2003 – 2009………. 21
Figure 8 Location before ICU admission, by hospitals 2009 ……… 31
Figure 9 Indication for ICU admission 2009 ……… 32
Figure 10 Main organ failure on ICU admission, by hospitals2009 ………... 33
Figure 11 Number of organ failure(s) on ICU admission, by hospitals 2009 ……… 36
Figure 12 Ten most common diagnoses leading to ICU admission in MOH hospitals 2009……… 37
Figure 13 Invasive ventilation, by hospitals 2009 ……… 40
Figure 14 Non-invasive ventilation, by hospitals 2009 ……… 40
Figure 15 Non-invasive ventilation, MOH hospitals 2003 – 2009 ……….. 41
Figure 16 Re-intubation, MOH hospitals 2003 – 2009……….. 41
Figure 17 Modalities of renal replacement therapy, by hospitals 2009 ……… 43
Figure 18 Techniques of tracheostomy, by hospitals 2009 ……… 44
Figure 19 VAP per 1000 ventilator days 2003 - 2009 ………. 50
Figure 20 VAP per 1000 ventilator days, by individual hospital 2009……….. 50
Figure 21 VCB compliance and VAP 2007 – 2009……….. 50
Figure 22 Bacteriological cultures in VAP 2009 ……… 53
Figure 23 Unplanned extubation, by individual hospital 2009……….. 55
Figure 24 Crude in-ICU and in-hospital mortality rates, by individual hospital 2009 59 Figure 25 Number of organ failure and mortality 2009 ……….. 59
Figure 26 SOFA score and observed in-hospital mortality 2009 ……… 60
Figure 27 Category of patients and observed in-hospital mortality 2009……….. 60
Figure 28 Main organ failure and observed in-hospital mortality 2009 ……… 60
INTRODUCTION
The National Audit on Adult Intensive Care Units (NAICU) was established in 2002 as a quality improvement initiative to systematically review the intensive care practices in Malaysia and where possible, to introduce remedial measures to improve outcome. To date, this audit had published six reports and introduced several quality measures such as ventilator care bundle, central venous care bundle and ICU networking.
In 2009, the NAICU underwent a major re-organisation and was renamed the Malaysian Registry of Intensive Care. This report is thus the second for MRIC, but seventh in the series. Following the change, MRIC has now become a member of the national registry under the purview of Clinical Research Centre, Ministry of Health.
The objectives of the MRIC are to:
1. Establish a database of patients admitted to the adult ICUs 2. Review the clinical practices of intensive care
3. Determine clinical outcome
4. Determine the resources and delivery of intensive care service
5. Evaluate the impact of quality improvement measures on patient care
6. Provide comparisons of performance of participating centres against national and international standards
7. Conduct healthcare research related to intensive care
This report describes the intensive care practices and outcomes in an ICU in a private hospital and 30 ICUs in MOH.
Data Collection and Verification
Data were collected prospectively in all 31 ICUs by trained nurses (source data providers) and specialists (site investigators) based on a written protocol. Data initially collected on a case report form for each patient was subsequently transferred
to a customised software called SyNapse.
.
At three monthly intervals, the data was‘burned’ into compact discs and sent to the coordinating centre in Hospital Kuala Lumpur for ‘data merging’.
All participating centres were to ensure “accuracy and completeness” of their individual databases before being uploaded and sent to the coordinating centre.
This report is based on all admissions into the 31 participating ICUs from 1 January to 31 December 2009. Those admitted during this period but were still in hospital on 31 January 2010, were excluded from the analysis. The total number of admissions in 2009 was 22,234, out of which 968 (4.4%) were readmissions. For patients with multiple ICU admissions, only the first admission was included in the analysis.
Due to missing and inconsistent data, the sum total of some variables shown in the tables may not add up to the actual number of admissions.
Data Limitations
Limitations to the registry data were mainly related to the data entry and collection process. Some of the participating ICUs experienced rapid turnover of their site investigators and source data providers resulting in data inconsistencies. Some centres encountered problems in accessing their local electronic database due to hardware problems. Due to logistical problems, the technical committee of the MRIC was unable to verify missing and inconsistent data with the specific participating centres and to perform site visits.
Format of Report
The format of this report follows the patient journey in four sections: demographics, interventions, complications and outcomes. Information is reported on a total of 21,266 ICU admissions.
In this report, information was provided for individual centres. Wherever appropriate, comparisons were made between categories of hospitals based on the number of ICU beds. In MOH hospitals the categories were centres with 12 beds or more and those with less than 12 beds. Where relevant, trends of certain variables over the years were reported.
The Future
SECTION A: GENERAL INFORMATION
Table 1: ICU beds and ICU bed occupancy rate, by MOH hospitals 2007 - 2009
Figure 1: ICU admissions, by participating centres 2009
Table 3: Reporting rates, by individual hospital 2007 – 2009 reported to the MRIC and to the national census (collected by Anaesthetic program head). The total number reported to the MRIC was slightly less than that to the national census, as patients who were still in hospital on 31 January 2010 were excluded in the analysis.
Table 4: Intensive care referrals and refusal of admission, by individual hospital 2004 - 2009
2004 2005 2006 2007 2008 2009
Table 7: Ethnic groups 2009
Ethnic group n %
Malay 12339 58.0
Chinese 4427 20.9
Indian 2361 11.1
Foreigner 1006 4.7
Bumiputra Sabah/Sarawak 755 2.6
Other Malaysian 363 1.7
Orang Asli 152 0.7
Unknown 43 0.2
Total 21266 100
Figure 4: Ethnic groups 2009
Table 9: Length of hospital stay, by individual hospital 2004 – 2009
Table 10: Referring units 2009
Figure 5: Referring units 2009
Table 11: Category of patients 2009
Hospitals Category of patients Beds ≥ 12
n (%)
Beds < 12 n (%)
Private n (%)
Total
Non-operative 6656 (60.8) 4953 (60.4) 1488 (71.5) 13097 (61.7) Elective operative 1238 (11.3) 1020 (12.4) 466 (22.4) 2724 (12.8) Emergency operative 3055 (27.9) 2226 (27.1) 128 (6.1) 5409 (25.5)
Total 10949 (100) 8199 (100) 2082 (100) 21230 (100)
Non-operative; Refers to patients in whom no surgery was done out within 7 days before ICU admission or during the first 24 hours after ICU admission
Operative elective: Refers to patients in whom surgery was done within 7 days before ICU admission or during the first 24 hours after ICU admission on a scheduled basis
Operative-emergency: Refers to patients in whom surgery was done within 7 days before ICU admission or during the first 24 hours after ICU admission on an unscheduled basis
Figure 6: Category of patients 2009
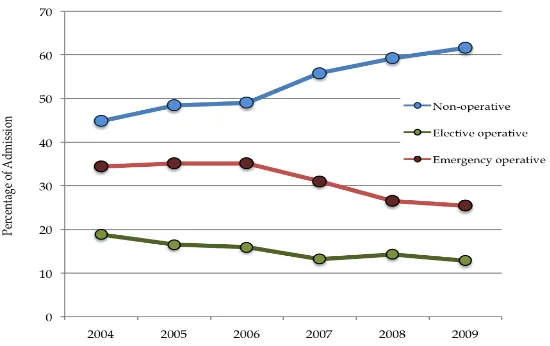
Table 12: Category of patients in MOH hospitals 2004 - 2009
Category of patients 2004 (%)
2005 (%)
2006 (%)
2007 (%)
2008 (%)
2009 (%)
Non-operative 44.8 48.4 49.0 55.8 59.2 61.6
Elective operative 18.8 16.5 15.9 13.2 14.3 12.8
Emergency operative 34.4 35.1 35.1 31.0 26.5 25.4
Figure 7: Category of patients 2004 - 2009
Table 13: Location before ICU admission, by hospitals 2009
Figure 8: Location before ICU admission, by hospitals 2009
Table 14: Location before ICU admission in MOH hospitals 2004 - 2009
Table 15: Indication for ICU admission 2009
Hospitals
Indication Beds > 12
n (%)
Planned admission: The decision for admission was made before the induction of anaesthesia. Unplanned admission: The decision for admission was made after induction of anaesthesia.
Figure 9: Indication for ICU admission 2009
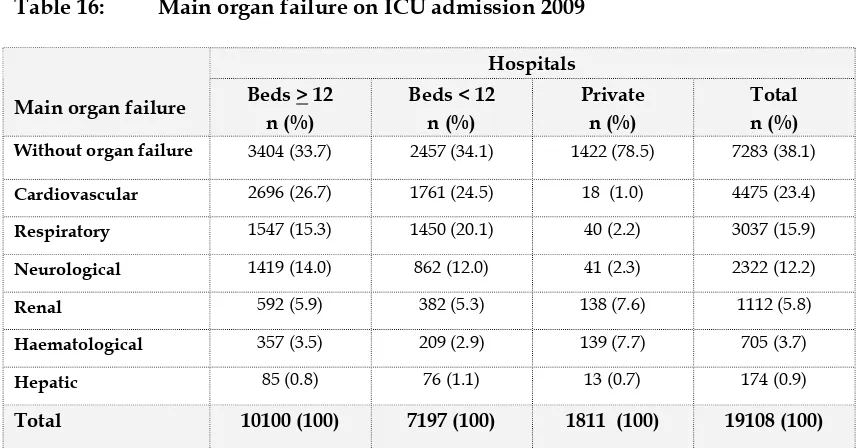
Table 16: Main organ failure on ICU admission 2009
Hospitals
Main organ failure Beds > 12 n (%)
The definition of organ failure is based on the Sequential Organ Failure Assessment (SOFA) [1]
Figure 10: Main organ failure on ICU admission, by hospitals 2009
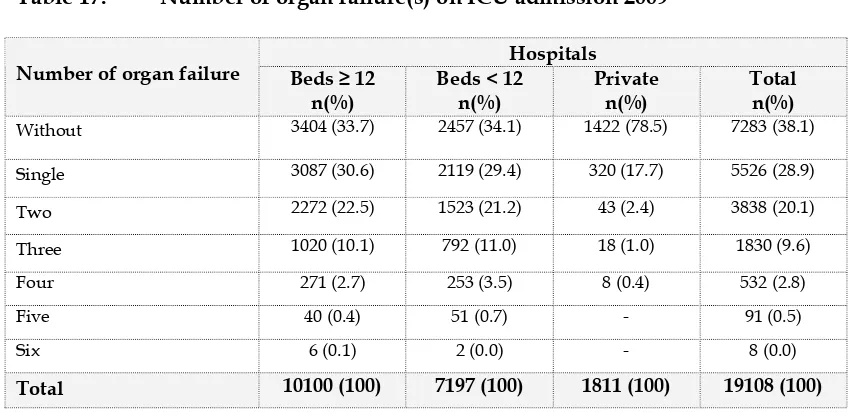
Table 17: Number of organ failure(s) on ICU admission 2009
Hospitals Number of organ failure Beds ≥ 12
n(%)
Beds < 12 n(%)
Private n(%)
Total n(%)
Without 3404 (33.7) 2457 (34.1) 1422 (78.5) 7283 (38.1)
Single 3087 (30.6) 2119 (29.4) 320 (17.7) 5526 (28.9)
Two 2272 (22.5) 1523 (21.2) 43 (2.4) 3838 (20.1)
Three 1020 (10.1) 792 (11.0) 18 (1.0) 1830 (9.6)
Four 271 (2.7) 253 (3.5) 8 (0.4) 532 (2.8)
Five 40 (0.4) 51 (0.7) - 91 (0.5)
Six 6 (0.1) 2 (0.0) - 8 (0.0)
Total 10100 (100) 7197 (100) 1811 (100) 19108 (100)
Figure 11: Number of organ failure(s) on ICU admission 2009
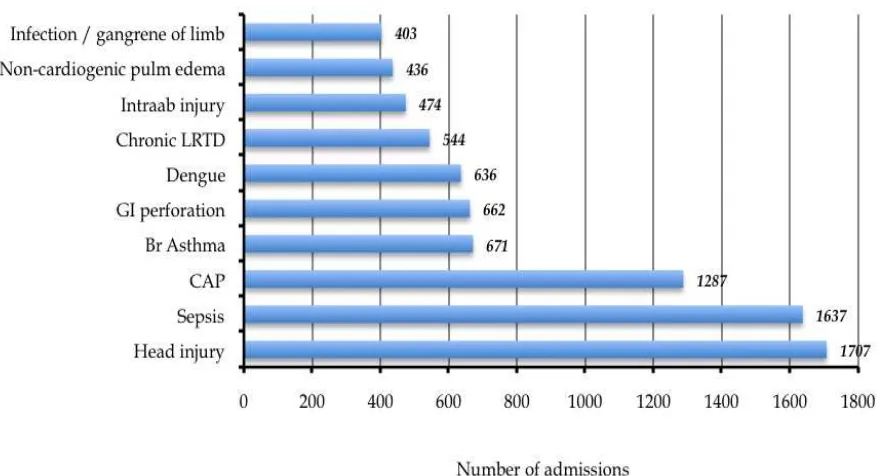
Table 18: Ten most common diagnoses leading to ICU admission 2009
Diagnosis n %
Hospitals with ICU beds ≥ 12
Head Injury 1120 10.2
Sepsis 848 7.7
Community acquired pneumonia 739 6.7
Gastrointestinal perforation (including anastomotic leak) 393 3.6
Dengue 388 3.5
Bronchial asthma 379 3.5
Chronic lower respiratory disease 321 2.9
Intraabdominal injury 285 2.6
Non-cardiogenic pulmonary oedema 257 2.3
Infection / gangrene of limb (including osteomyelitis,
necrotizing fascitis)
251 2.3
Hospitals with ICU beds < 12
Sepsis 806 9.8
Head injury 617 7.5
Community acquired pneumonia 572 7.0
Bronchial asthma 307 3.7
Gastrointestinal perforation ( including anastomotic leak) 281 3.4
Dengue 253 3.1
Chronic lower respiratory disease 240 2.9
Other abdominal / pelvic conditions 216 2.6
Gastrointestinal bleeding 210 2.6
Intraabdominal injury 200 2.4
Private Hospital
Cerebrovascular disease 167 8.0
Ischaemic heart disease/ acute coronary syndrome 153 7.3
Dengue 150 7.2
Epilepsy 105 5.0
Gastrointestinal bleeding 104 5.0
Other CNS condition 97 4.7
Other disorders of the musculoskeletal system 96 4.6
Other abdominal/ pelvic conditions 95 4.6
Other renal / genito-urinary conditions 78 3.7
Figure 12: Ten most common diagnoses leading to ICU admission in MOH hospitals 2009
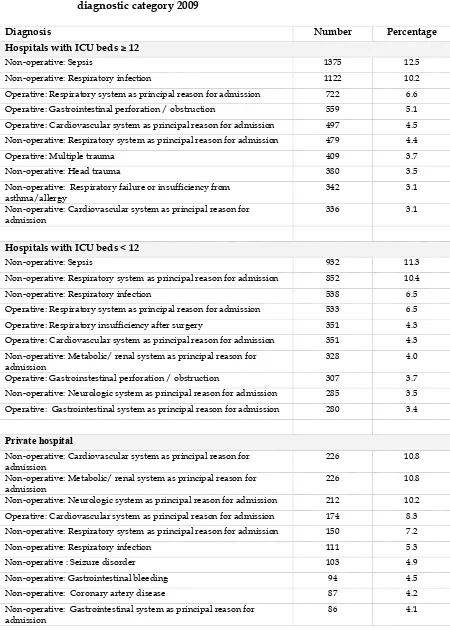
Table 19: Ten most common diagnoses leading to ICU admission using APACHE II diagnostic category 2009
Diagnosis Number Percentage
Hospitals with ICU beds ≥ 12
Non-operative: Sepsis 1375 12.5
Non-operative: Respiratory infection 1122 10.2
Operative: Respiratory system as principal reason for admission 722 6.6
Operative: Gastrointestinal perforation / obstruction 559 5.1
Operative: Cardiovascular system as principal reason for admission 497 4.5
Non-operative: Respiratory system as principal reason for admission 479 4.4
Operative: Multiple trauma 409 3.7
Non-operative: Head trauma 380 3.5
Non-operative: Respiratory failure or insufficiency from asthma/allergy
342 3.1
Non-operative: Cardiovascular system as principal reason for admission
336 3.1
Hospitals with ICU beds < 12
Non-operative: Sepsis 932 11.3
Non-operative: Respiratory system as principal reason for admission 852 10.4
Non-operative: Respiratory infection 538 6.5
Operative: Respiratory system as principal reason for admission 533 6.5
Operative: Respiratory insufficiency after surgery 351 4.3
Operative: Cardiovascular system as principal reason for admission 351 4.3
Non-operative: Metabolic/ renal system as principal reason for admission
328 4.0
Operative: Gastroinstestinal perforation / obstruction 307 3.7
Non-operative: Neurologic system as principal reason for admission 285 3.5
Operative: Gastrointestinal system as principal reason for admission 280 3.4
Private hospital
Non-operative: Cardiovascular system as principal reason for admission
226 10.8
Non-operative: Metabolic/ renal system as principal reason for admission
226 10.8
Non-operative: Neurologic system as principal reason for admission 212 10.2
Operative: Cardiovascular system as principal reason for admission 174 8.3
Non-operative: Respiratory system as principal reason for admission 150 7.2
Non-operative: Respiratory infection 111 5.3
Non-operative : Seizure disorder 103 4.9
Non-operative: Gastrointestinal bleeding 94 4.5
Non-operative: Coronary artery disease 87 4.2
Non-operative: Gastrointestinal system as principal reason for admission
Table 20: SAPS II [1] score, by individual hospital 2004 - 2009
Table 21: Sequential Organ Failure Assessment (SOFA) [2] by individual hospital 2007 - 2009
SOFA score
SECTION C:
INTERVENTIONS
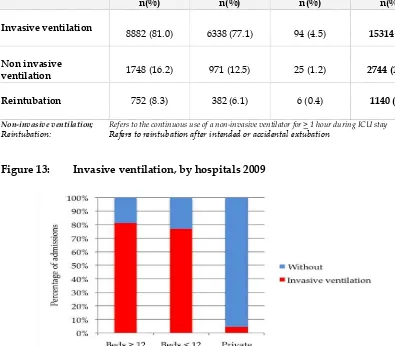
Table 22:
Invasive ventilation,
non-invasive ventilationand
reintubation 2009Hospitals Beds ≥ 12
n(%)
Beds < 12 n(%)
Private n(%)
Total n(%)
Invasive ventilation
8882 (81.0) 6338 (77.1) 94 (4.5) 15314 (72)
Non invasive
ventilation 1748 (16.2) 971 (12.5) 25 (1.2) 2744 (13.3)
Reintubation
752 (8.3) 382 (6.1) 6 (0.4) 1140 (6.7)
Non-invasive ventilation; Refers to the continuous use of a non-invasive ventilator for > 1 hour during ICU stay
Reintubation: Refers to reintubation after intended or accidental extubation
Figure 13: Invasive ventilation, by hospitals 2009
79% of ICU admissions to MOH hospitals received invasive ventilation, which was similar to the previous years. In contrast, a vast majority of patients in the private hospital were not mechanically ventilated.
Figure 15: Non-invasive ventilation, MOH hospitals 2003 - 2009
Patients on
non-invasive ventilation had doubled from 6.5% in 2003 to 13.3% in 2009Figure 16: Reintubation, MOH hospitals 2003 - 2009
Table 23: Duration of invasive mechanical ventilation, by individual hospital ventilation (3.3 days) while Hospital MRI had the longest at 6.1 days.
Table 24: Renal replacement therapy and modalities of therapy 2009
Figure 17: Modalities of renal replacement therapy, by hospitals 2009
In MOH ICUs, 11.1% of admissions received renal replacement therapy.
Table 25: Tracheostomy 2009
Hospitals Beds > 12
n (%)
Beds < 12 n (%)
Private hospital n (%)
Total n (%)
Tracheostomy 1136 (13.0) 676 (11.4) 9 (9.6) 1821 (12.3)
Tracheotomy technique
Surgical 717 (63.1) 582 (86.1) 5 (55.6) 1304 (71.6)
Percutaneous 419 (36.9) 94 (13.9) 4 (44.4) 517 (28.4)
Tracheostomy: Refers to the procedure done during ICU stay
Table 26: Tracheostomy, by individual hospital 2009 relation to days of
ventilation
Among the invasively ventilated patients, 12.3% had tracheostomies performed compared to 12.8% in the previous year.
Table 27: Tracheostomy, by individual hospital 2006 - 2009
Total tracheostomy (% percutaneous) n (%)
Table 28: Withdrawal / withholding therapy, by individual hospital 2008 - 2009
Withdrawal / withholding of therapy n (%)
Withdrawal or withholding of therapy refers to discontinuation / not initiating any of the following: vasoactive drugs, renal replacement therapy, mechanical ventilation, surgery, cardiopulmonary resuscitation
SECTION D:
COMPLICATIONS
Table 29: Incidence of ventilator-associated pneumonia, by individual hospital 2003 - 2009
VAP per 1000 ventilator days Hospital
Table 30: Onset of VAP from initiation of invasive ventilation, by individual hospital 2007 - 2009
Figure 19: VAP per 1000 ventilator days 2003 - 2009
Figure 20: VAP per 1000 ventilator days, by individual hospital 2009
National Healthcare Safety Network (NHSN) report, data summary for 2006 - 2008
VAP per 1000 ventilator days
Percentile Types of ICU Ventilator
utilisation contributed to this decrease as illustrated in Figure 21. Since 2008, VCB compliance is one of the key performance indicators of the Anaesthetic Programme.
The mean rate of VAP (11.6 per 1000 ventilator days) in our ICUs was higher when benchmarked with that of US National Healthcare Safety Network (NHSN) (5); formerly known as National Nosocomial Infection Surveillance system (NNIS) as shown in the table above. The definition for VAP by NHSN has a more stringent inclusion criterion (resulting in fewer cases being defined as VAP) compared to ours. However, the rate of VAP in our ICUs compared favourably with the pooled VAP rate of 13.6 per 1000 ventilator days as reported by Rosenthal et. al. (6) in ICUs in 25 countries in Latin America, Asia, Africa and Europe using the definition of VAP by NHSN.
Ventilator usage is a significant risk factor for developing VAP and the exposure to this risk is measured by ventilator utilisation ratio, which is calculated by dividing the number of ventilator days to number of patient days. Ventilator utilisation ratio in our ICUs of 0.69 was much higher than the ICUs in US.
Table 31: Bacteriological cultures in VAP 2009 Stenotrophomonas maltophilia 11 (2.8) 9 (3.0) 20 (2.9)
Other gram negative bacteria 6 (1.5) 1 (0.3) 7 (1.0)
Fungi 3 (0.8) 3 (1.0) 6 (0.9)
MRO isolated 148 (44.7) 106 (39.8) 254 (42.5)
Table 32: Bacteriological cultures in VAP 2007 – 2009
2007 2008 2009 Stenotrophomonas maltophilia 23 (2.7) 25 (3.2) 20 (2.9)
Other gram negative bacteria 21 (2.4) 16 (2.0) 7 (1.0)
Fungi 68 (7.9) 11 (1.4) 6 (0.9)
Coagulase negative Staphylococcus
Figure 22: Bacteriological cultures in VAP 2009
In 2009, Gram-negative organisms accounted for more than three quarter (77.2%) of the causative organisms in VAP. Over the last 7 years, the most common organisms were
Acinetobacter spp., Klebsiella spp. and Pseudomonas spp. The percentage of Acinetobacter spp. had significantly increased over the years.
Table 33: Unplanned extubation per 100 intubated days by individual hospital 2003 - 2009
Figure 23: Unplanned extubation, by individual hospital 2009
Table 34: Pressure ulcer, by individual hospital2007 - 2009
Pressure ulcer per 1000 ICU days
Hospital 2008 2009
SECTION E:
MORTALITY OUTCOMES
Crude mortality rates are convenient measures of outcome. However, they are poor indicators of performance of intensive care as they do not take into account variations in patient characteristics such as case mix and the severity of illness.
A better measure of ICU performance is standardised mortality ratio (SMR). SMR is the ratio, comparing the observed to the predicted mortality, using a severity scoring system. It may be used to compare the performance of ICUs between units, within certain limitations.
Table 35: Hospital outcome 2009
Table 36: Crude in-ICU and in-hospital mortality rate, by individual hospital 2004 - 2009
Figure 24: Crude in-ICU and in-hospital mortality rates, by individual hospital 2009
The in-ICU and in-hospital mortality rates in MOH hospitals were 21.2% and 29.7% respectively. These rates had remained almost the same over the last five years.
Figure 25: Number of organ failure and observed in-hospital mortality 2009
The in-hospital mortality rates increased correspondingly with the number of organ failure within the first 24 hours of ICU admission: 6.8% in those without any organ failure, 23.7% in single organ, 47.1% in two, 65.8% in three, 78.9% in 4 and 80.4% in five organ failure.
Figure 26: SOFA score and observed in-hospital mortality 2009
A SOFA score of 10 demonstrated an observed mortality of 50%. The national median SOFA score of 5 had an observed mortality rate of 13.8%.
Figure 27: Category of patient and observed in-hospital mortality 2009
Non-operative patients had a higher in-hospital mortality compared with operative patients.
Table 37: Ten most common diagnoses leading to ICU admission in MOH hospitals and observed in-hospital mortality 2009
Diagnosis Mortality (%)
Head Injury 27.0
Sepsis 62.2
Community acquired pneumonia 46.3
Bronchial asthma 10.4
Gastrointestinal perforation (including anastomotic leak) 36.3
Dengue 10.4
Chronic lower respiratory disease 32.4
Intra-abdominal injury 22.4
Non-cardiogenic pulmonary oedema 25.9
Infection / gangrene of limb (including osteomyelitis, necrotising fascitis)
39.2
Patients with sepsis had a high in-hospital mortality of 62.2%. Bronchial asthma and dengue infection carries an in-hospital mortality of 10.4%
Table 38: Interventions, complications,and observed in-hospital mortality 2009
Observed mortality (%) Interventions / Complications
With Without
Invasive ventilation 37.7 5.6
Renal replacement therapy 56.5 27.7
Tracheostomy 40.6 30.3
Reintubation 41.8 30.4
Ventilator-associated pneumonia (all) 48.8 30.7
Table 39: Standardised mortality ratio by individual hospital 2004 - 2009
Standardised mortality ratio (95% CI)
Hospital 2004 2005 2007 2008 2009
Figure 29: Standardised mortality ratio by individual hospital, 2009
The above figure shows the funnel plot for standardised mortality rates (SMR) in MOH hospitals. We use 2 standard deviations (SD) from the mean (inner curves) to highlight units that might be different and 3 SD from the mean (outer curves) to highlight units that are different. There are many reasons that could explain statistical outliers, from mere chance, differences in resources or standard of care.
SUMMARY
1. The total number of ICU beds in the 31 participating units was 330.
2. The number of cases analysed for year 2009 was 21,226, an increase of 12% over the previous year.
3. The overall reporting rate had been fairly constant at 89%.
4. The average age of patients excluding those below 18 years was 50.3 years.
5. In MOH hospitals, foreigners constituted 4.7% of all ICU admissions.
6. The average lengths of ICU and hospital stays were 4.4 and 14.4 days respectively.
7. In MOH hospitals, 62% of admissions were non-operative patients, an increase of 17% in the last six years.
8. Direct admission to ICU from the emergency department had increased from 9% in 2004 to 21% in 2009.
9. Inter-hospital ICU admissions doubled from 2.8% to 5.5% in the last six years.
10. 62% of admissions had one or more organ failure within 24 hours of ICU admission.
11. Cardiovascular failure (23.4%) was the most common among those with organ failure.
12. Head injury, sepsis and community-acquired pneumonia were the three most common diagnoses leading to ICU admission, in MOH hospitals and this trend had remained the same over the last seven years. The in-hospital mortality for this group of patients was 27.0%, 62.2% and 46.3% respectively.
13. The average SAPS II score was 35.8, which carries a predicted risk of in-hospital mortality of 28.0%.
14. In MOH hospitals, 79.3% of patients received invasive ventilation with an average duration of 4.3 days. 4.5% of ICU admissions in the private hospital were mechanically ventilated with average duration of 3.8 days.
15. The percentage of patients who received non-invasive ventilation increased from 6.5% in 2003 to 13.3% in 2009.
16. In MOH hospitals, 11% of ICU admissions had renal replacement therapy, with intermittent haemodialysis being the most common modality of therapy.
17. Among patients who were invasively ventilated, 12.3% of them had tracheostomy performed, with the average time from initiation of ventilation to tracheostomy being 6.3 days.
19. The incidence of VAP had decreased by more than half from 28.0 to 11.6 per 1000 ventilator days within the last six years.
20. The majority (77%) of the organisms causing VAP were Gram-negative.
Acinetobacter spp., Pseudomonas spp. and Klebsiella spp. remained the 3 most common organisms causing VAP over the last 7 years in MOH ICUs. 42% of organisms causing VAP were multi-drug resistant.
21. The crude in-ICU and in-hospital mortality rates were 21.2% and 29.7% respectively.
REFERENCES
1. Vincent JL, Moreno R, Takala J, et al. The SOFA (Sepsis-related Organ
Failure Assessment) score to describe organ dysfunction/failure. Intensive Care Med 1996;22:707-710
2. Le Gall JR, Lemeshow S, Saulnier F. A New Simplified Acute Physiology Score (SAPS II) based on a European/North American Multi-centre Study JAMA 1993;270(24):2957-2963
3. Tai LL et al . Validation and recustomisation of Simplified Acute Physiologic score II (SAPS II) in patients in Malaysian ICU. Poster presentation at the 13th Western Pacific Association of Critical Care Medicine
Conference, Seoul 2004
4. Prendergast TJ, Claessens MT, Luce JM: A national survey of end-of-life care for critically ill patients. Am J Respir Crit Care Med 1998, 158:1163-1167.
5. Edwards JR, Peterson KD, Mu Y et al. National Healthcare Safety Network (NHSN) report, data summary for 2006 through 2008, issued December 2009. Am J Infect Control 2009; 37:783-805