GEOMETRICAL CORRELATION AND MATCHING OF 2D IMAGE SHAPES
Yu. V. Vizilter*, S. Yu. Zheltov
State Research Institute of Aviation Systems (GosNIIAS), 125319, 7, Viktorenko str., Moscow, Russia – (viz, zhl)@gosniias.ru
Commission III, WG III/3
KEYWORDS: Image Matching, Image Comparison, Geometric Correlation, Mathematics
ABSTRACT:
The problem of image correspondence measure selection for image comparison and matching is addressed. Many practical applications require image matching “just by shape” with no dependence on the concrete intensity or color values. Most popular technique for image shape comparison utilizes the mutual information measure based on probabilistic reasoning and information theory background. Another approach was proposed by Pytiev (so called “Pytiev morphology”) based on geometrical and algebraic reasoning. In this framework images are considered as piecewise-constant 2D functions, tessellation of image frame by the set of non-intersected connected regions determines the “shape” of image and the projection of image onto the shape of other image is determined. Morphological image comparison is performed using the normalized morphological correlation coefficients. These coefficients estimate the closeness of one image to the shape of other image. Such image analysis technique can be characterized as an “intensity -to-geometry” matching. This paper generalizes the Pytiev morphological approach for obtaining the pure “geometry-to-geometry” matching techniques. The generalized intensity-geometrical correlation coefficient is proposed including the linear correlation coefficient and the square of Pytiev correlation coefficient as its partial cases. The morphological shape correlation coefficient is proposed based on the statistical averaging of images with the same shape. Centered morphological correlation coefficient is obtained under the condition of intensity centering of averaged images. Two types of symmetric geometrical normalized correlation coefficients are proposed for comparison of shape-tessellations. The technique for correlation and matching of shapes with ordered intensities is proposed with correlation measures invariant to monotonous intensity transformations. The quality of proposed geometrical correlation measures is experimentally estimated in the task of visual (TV) and infrared (IR) image matching. First experimental results demonstrate competitive quality and better computational performance relative to state-of-art mutual information measure.
1. INTRODUCTION*
Image matching is one of actual problems in remote sensing and machine vision. The selection of image matching procedure for some practical application depends on different aspects of the whole matching algorithm. Some of these aspects concern with discontinuities in object space and perspective distortions of compared images. Other aspects deal with sub-pixel precision and computational cost of matching. Many researchers have explored these aspects. We have investigated them too in our previous works (Zheltov, Sibiryakov, 1997; Zheltov, Vizilter, 2004). This paper concerns the other aspect of matching procedure – the measure of image fragments similarity (or dissimilarity) to be utilized in matching algorithm.
In some practical cases the final quality and performance of image matching procedure essentially depends on quality and performance of image comparison function. So, there are some special functions for comparison of binary, grayscale, colored, multispectral and other types of images. This paper devoted to the problem of image matching “just by shape” with no dependence on the concrete intensity or radiometric pixel values. For example, one can compare images of one scene captured at different seasons, different time of day, in different weather and lighting conditions, in different spectral ranges and so on. The most popular technique for such image shape comparison utilizes the mutual information measure based on probabilistic reasoning and information theory background (Maes, 1997). The other approach was proposed by Pytiev (so called “Pytiev morphology”) based on geometrical and algebraic reasoning (Pytiev, 1993). This paper develops the ideas of this geometrical approach.
* Corresponding author.
In the framework of Pytiev morphology images are considered as piecewise-constant 2D functions. The tessellation of image frame by the set of non-intersected connected regions with constant intensities determines the “shape-tessellation” or simply “shape” of the image. Morphological image comparison is performed using the normalized “morphological” correlation coefficients.
The motivation of reported theoretical research is following. In Pytiev approach one supposes that the “shape” Fof some “class sample” f is given by supervisor, and one needs to determine whether any observed image g belongs to this class. This scheme presumes that the shape of f is more believable than the shape of g. But in practice it is not always reasonable. A lot of applications require estimating the closeness or difference between two images with the same belief of shape. So, one needs to suppose that both f and g are randomly selected from their “shape sets” F and G correspondingly. In such case they should be compared either as images (“intensity comparison” like in linear correlation) or as pure shapes (“geometrical comparison”). The intermediate “intensity-geometrical” comparison like Pytiev correlation is not reasonable here. Besides, the geometrical shape comparison could provide the possibility of image matching for images segmented not only by intensity, but by other features, for example, by texture. Finally, it is useful to design some symmetric image comparison measures invariant to shape preserving intensity transforms. According to this motivation some new correlation tools for geometrical comparison and matching of shape-tessellations will be proposed based on generalization of Pytiev morphological correlation. Destination and properties of proposed geometrical correlation tools will be comparable and competitive with those of mutual information.
2. IMAGE COMPARISON PROBLEM AND RELATED WORKS
Let image is represented by 2D intensity function f(x,y): R,
R2, where is a frame region of bounded size, R– set of real numbers, R2 – 2D plane of image. The operation of “comparison” of images f(x,y) and g(x,y) presumes the estimation of their “similarity” or, conversely, “dissimilarity”. Numerical estimation of “similarity” is usually performed by such similarity measures as correlation coefficients. “Dissimilarity ” is estimated by distances in some metrics. The proper formulas of such coefficients and distances are determined by image models and image spaces we use.
Classical approach to image comparison considers images as elements of Hilbert space L2() with scalar product (f,g), Euclidean norm || f ||2=(f,f) and Euclidean distance dE(f,g) = || f –g||. But photographic linear transforms of image intensity can essentially change the distance between images and even the pair of very similar images will seem to be very “far”. So, for image comparison invariant relative to linear intensity transform the following normalized linear correlation coefficient is applied
|| |||| ||
) , ( ) , (
g f
g f g f
KN .
In this formula images are usually centered, i.e. decreased by their constant average values.
Such approach is well-known in photogrammetry as a least squares matching (Gruen, Baltsavias, 1985).
But even the normalized linear correlation is not invariant relative to more complex (nonlinear) intensity transforms occurred in practice. For image comparison under such complex and unknown intensity transforms the mutual information approach was proposed (Maes, 1997). Mutual information I(A,B) estimates the dependence of two random variables A and B by measuring the distance between the joint distribution pAB(a,b) and the distribution of complete independence pA(a)pB(b) by means of following expressions
I(A,B) = H(A) + H(B)– H(A,B), H(A) = –apA(a) log pA(a), H(B) = –bpB(b) log pB(b),
H(A,B) = –a bpAB(a,b) log pAB(a,b),
where H(A) is an entropy of A, H(B) is an entropy of B, and H(A,B) is their joint entropy. For two image intensity values a and b of a pair of corresponding pixels in the two images, required empirical estimations for the joint and marginal distributions can be obtained by normalization of the joint (2D) and marginal (1D) histograms of compared image fragments. Maximal I(A,B) value corresponds to the best geometrical matching of image fragments.
This approach is based on probabilistic reasoning. It provides the robust tool for matching of images with different intensities based on their joint 2D histograms. But these histograms can not explain the geometrical idea of image “shape” in some evident form. Such mathematical “shape” formalism is given in evident form in the so-called “morphological” approach for image comparison proposed by Pytiev (Pytiev, 1993).
In the framework of this approach images are considered as piecewise-constant 2D functions
f(x,y) = i=1,..,nfiFi(x,y),
where n – number of non-intersected connected regions of tessellation F of the frame , F={F1,…,Fn}; f=(f1,…,fn) – corresponding vector of real-valued region intensities;
Fi(x,y){0,1} – characteristic (support) function of i-th region:
. ,
0
; ) , ( , 1 ) , (
otherwise F y x if y
x i
Fi
Set of images with the same tessellation F is a convex and close subspace FL2() called shape-tessellation or simply shape:
F = { f(x,y) = i=1,..,nfi Fi(x,y), fRn}.
For any image g(x,y)L2() the projection onto the shape F is determined as
gF(x,y) = PFg(x,y) = i=1,..,ngFii(x,y), gFi = (Fi,g) / || Fi ||2, i=1,…,n.
Here PF is a projective operator called projector to F. Let’s note that for any image f(x,y) the description of its “shape” by a set of frame tessellation regions F={Fi}, by corresponding vector subspace F and by corresponding projection operator (“shape projector”) PF are practically equivalent.
Pytiev morphological comparison of images f(x,y) and g(x,y) is performed using the normalized morphological correlation coefficients of the following form
, || ||
|| || ) , (
g g P F g
K F
M .
|| ||
|| || ) , (
f f P G f
K G
M
The first formula estimates the closeness of image g to the “shape” of image f. Second formula measures the closeness of image f to the “shape” of image f. In general KM(g,F) is not equal to KM(f,G). So, this morphological image matching score is asymmetric in contrary to symmetric linear correlation coefficient KN(f,g).
3. GENERALIZED INTENSITY-GEOMETRICAL CORRELATION
While the linear correlation coefficient KN(f,g) compares images just as intensity functions (“intensity-to-intensity” matching), morphological coefficient KM(f,G) compares the intensity distribution of f(x,y) with geometrical shape of g(x,y) (“intensity-to-geometry” matching). In other words, there are different types of image correlation: intensity and intensity-geometrical correlation. Are these correlation techniques principally independent or could be united in some more generic correlation frame work? In this section the answer will be given.
Let some images f and g are given and some shape W is considered. Then one can measure the angle (fW gW). The value
(fW,gW) characterizes the similarity of images g and frelative to shapeW. In particular, if cos(fW gW)=0, then images f and g are orthogonal or independentrelative to shapeW.
This allows introducing the normalized linear correlation coefficient of images g and frelative to shapeW:
Following expressions are satisfied:
);
So, the generalized intensity-geometrical correlation coefficient KN(f,g,W) includes both the linear correlation coefficient and the square of Pytiev correlation coefficient as its partial cases. It means that the intensity-geometrical (morphological) correlation is more generic relative to intensity (linear) correlation and includes it as a part of its own framework. Note that in this generic form KN(f,g) “structurally corresponds” to the square of morphological coefficient KM2(f,G). Hence, if one needs to compare the sensitivity of different correlation techniques, one should compare KN with KM2,but not with KM.
4. GEOMETRICAL SHAPE COMPARISON BASED ON STATISTICAL AVERAGING OF PROJECTED IMAGES
If one fixes some shape G and takes some different images f from shape F, there will be different values of KM2(f,G). Nevertheless, one can try to average these values over a set of images from F and obtain some “average effective” morphological correlation coefficient for comparison of shapes F and G. Let f(x,y) form F is a piecewise-constant 2D function described above (in section 2). Image g(x,y) from G is an analogous 2D function with m as a number of tessellation regions G={G1,…,Gm}; g=(g1,…,gm) – vector of intensity values; Gj(x,y){0,1} – support function of j-th region. Let’s introduce following additional set of “S-variables”:
S– area of the whole frame ; correspond to following marginal and joint probabilities: pF(fi) = Si /S, pG(gj) = Sj /S, pFG(fi,gj) = Sij /S.
With account of these S-variables
|| f||2= i=1,..,nfi2 Si, || fG||2= j=1,..,mfGj2 Sj,
where fGj = (i=1,..,nfi Sij)/Sj, j=1,..,m.
Additionally introduce the following assumptions about the distributions of probability densities for intensity values f1,…,fn: 1) p(f1,…,fn) = p(f1)…p(fn) – values f1,…,fn are independent in general;
2) p(f1) = … = p(fn) – values f1,…,fn are equally distributed; 3) i=1,..,n: p(fi) = p(–fi) – values f1,…,fn are distributed symmetrically relative to 0.
Consequently, the expectation of all intensity values in this
Let’s determine the mean square effective morphological correlation coefficient (MSEMCC) for shapes F and G as
After evident substitutions MSEMCC takes the following form
However there is one important problem with MSEMCC (1). It can not take in account the “independence” of shapes in a Pytiev sense. For such independent shapes F and G for any centered images fF, gG: KM(g,F) = KM(f,G) = 0, but MSEMCC can not provide the property KM(F,G) = KM(G,F) = 0 due to the fact that intensity of images in our reasoning above was not supposed to be centered.
Let’s start from the centered Pytiev morphological coefficient
, Introduce the mean square centered morphological correlation coefficient (MSCMCC) for shapes F and G as
After some substitutions MSCMCC takes the following form
.
Expression (2) is not so compact as (1), but due to relation
This property describes the independence of shapes in a Pytiev sense (Pytiev, Chulichkov, 2010).
5. SYMMETRIC GEOMETRICAL SHAPE CORRELATION COEFFICIENTS
Let’s try to construct symmetric modification of MSEMCC (1). Symmetric pair correlation coefficient for regions Fi and Gj can be defined as follows:
,
Then modifying the expression (1) one can obtain the following symmetric geometrical correlation coefficient (SGCC):
SGCC satisfies both properties of (1) and symmetry property
KMS(F,G)=KMS(G,F).
The other symmetric modification of geometric correlation (1) can be proposed based on the linear normalized pair correlation coefficient for regions Fi and Gj:
Properties of GLCC are the same as the SGCC properties.
6. COMPARISON OF SHAPES WITH ORDERED INTENSITIES
Finally let’s consider the problem of comparison of shapes with ordered intensities. This case corresponds to the class of monotonous intensity transforms. For simplicity we suppose that there are no equal values in intensity vectors f and g. For each region Fi one can define the relative intensity function
The similarity of ordered intensity sequences in “ordered shapes” F+ and G+ related to pair of regions Fi and Gj can be described by pair relative intensity correlation coefficient
. proposed geometrical correlation coefficients (1), (3) and (4) in order to take in account the ordering of intensity values. For example, the modified geometrical linear correlation coefficient (MGLCC) will have a form
KN+(F+,G+) = j=1,..,mi=1,..,nK(Fi,Gj) KN(Gj,Fi) K(Fi,Gj).
Following properties of MGLCC are satisfied:
KN +
(F+,G+) [-1,1]; KN+(F+,F+) = 1; KN+(-F+,F+) = -1; KN+(F+,G+)=KN+(G+,F+).
Here “-F+”
means the shape with the same frame tessellation as F+, but inverse order of region intensities. In analogous way the correlation coefficients (1) and (3) can be modified too for obtaining their intensity ordering sensitive modifications.
7. EXPERIMENTAL RESULTS
Proposed geometrical correlation techniques were implemented in software and tested over a set of real images including remote sensing and multispectral images. The quality of proposed geometrical correlation measures was investigated relative to the quality of mutual information measure and Pytiev correlation coefficient in the task of TV (visual band) and IR (infrared band) image matching. TV and IR images were geometrically co-registered. Then some fragments of TV image were compared with all equal-sized fragments of corresponding IR image. For increasing of matching robustness the histograms of these TV and IR fragments were segmented with n=m=4 levels using least square optimal segmentation procedure. For segmented image fragments f (TV) and g (IR) at each fragment g position (x,y) following similarity measures were calculated: - mutual information MI = I(F,G);
- square of centered Pytiev morphological coefficient Kp = KM
2 (f – f0,G);
- square of MSEMCC Km = KM2(F,G) (1); - square of MSCMCC Kmc = KMC
2
(F,G) (2); - SGCC Kms = KMS(F,G) (3);
- SLCC Kn = KN(F,G) (4).
The quality of these measures was estimated by following statistics of 2D correlation function С(x,y) – SNR ( signal-to-noise ratio) and E (exceeding of first maximum to second one):
, | |
| | ; | |
2 1 1
C C E C SNR
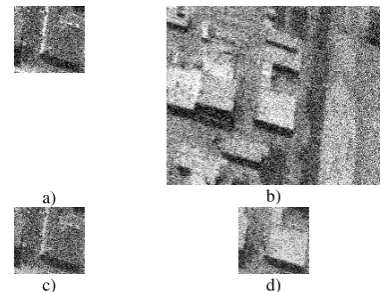
where C1– global maximum of correlation value; C2– second global maximum of correlation value out of some small neighborhood of first global maximum; μ – mean value of correlation function; σ– dispersion of correlation function. Figure 1 demonstrates the example (Example 1) of experimental TV-IR data corrupted by Gaussian noise. Figure 2 demonstrates 2D-graphs (correlation fields) of different correlation measures for matching of TV etalon and IR image (for Example 1). Corresponding numerical data are listed in Table 1. Example 2 (Figures 3, 4; Table 2) presents the other TV-IR image pair corrupted by Gaussian noise with smaller size of etalon fragment.
Analysis of these and other analogous TV-IR matching examples allows making following conclusions:
1. In case of relatively large fragment matching for clear and noisy images both Pytiev morphological coefficient and all proposed geometrical correlation measures (1)-(4) provide SNR and E values close to mutual information characteristics (a little bit worse or better).
2. In case of relatively small fragment matching both for clear and noisy images proposed asymmetrical geometrical correlation measures (1)-(2) provide SNR and E values slightly better than Pytiev morphological coefficient and mutual
information characteristics. But proposed symmetrical geometrical correlation measures (3)-(4) with small fragment and essential noise provide SNR and E values essentially worse than other tested measures and even can fail in global peak position (like in Example 2). These measures are not robust enough relative to noise and fragment size.
3. Both shapes of correlation fields and SNR and E values for proposed measures (1) and (2) are exactly equal in all experiments due to the linear relation pointed in section 4 (but they will be not equal in case of inverse order of etalon and test shape arguments).
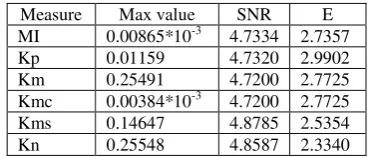
Measure Max value SNR E
MI 0.00865*10-3 4.7334 2.7357
Kp 0.01159 4.7320 2.9902
Km 0.25491 4.7200 2.7725
Kmc 0.00384*10-3 4.7200 2.7725
Kms 0.14647 4.8785 2.5354
Kn 0.25548 4.8587 2.3340
Table 1. Numeric data for TV-IR matching (Example 1).
Measure Max value SNR E
MI 0.03613 9.2157 1.7512
Kp 0.04361 8.9576 1.6643
Km 0.28774 10.3510 1.8913
Kmc 0.00159*10-3 10.3510 1.8913
Kms 0.1599 4.6429 1.2303
Kn 0.27794 4.1009 1.2635
Table 2. Numeric data for TV-IR matching (Example 2).
Totally, we can resume first experimental results as follows. Proposed MSEMCC and MSCMCC measures are very close to mutual information by matching characteristics and shape of correlation field. In our experiments these measures are usually a little bit better than MI (not statistically proved). But, taking in account the computational simplicity of expression (1) relative to MI and MSCMCC formulas, one can conclude that MSEMCC is the best geometrical correlation measure for practical applications with matching of different band images.
a) b)
c) d)
Figure 1. Example 1: a) etalon TV fragment; b) test IR image; c) segmented TV fragment; d) corresponding segmented IR
fragment.
Figure 2. Correlation fields for TV-IR matching (Example 1).
a) b)
c) d)
Figure 3. Example 2: a) etalon TV; b) test IR; c) segmented TV fragment; d) corresponding segmented IR fragment.
CONCLUSION
This paper generalizes some results of Pytiev morphological image analysis (Pytiev, Chulichkov, 2010).
Following theoretical results of this paper are new and original: - The generalized intensity-geometrical correlation coefficient is proposed that includes the linear correlation coefficient and the square of Pytiev correlation coefficient as its partial cases. - The mean square effective morphological correlation coefficient (MSEMCC) is proposed based on the statistical averaging of projected images with the same shape. Mean square centered morphological correlation coefficient (MSCMCC) is obtained under centering for projected images. - Two types of symmetric geometrical normalized correlation coefficients are proposed based on the form of MSEMCC. - The technique for correlation and matching of shapes with ordered intensities is proposed too. It is invariant just relative to monotonous intensity transformations.
Figure 4. Correlation fields for TV-IR matching (Example 2).
First experimental testing of proposed similarity measures is performed for TV and IR image matching task. Based on these experiments, MSEMCC seems to be competitive in quality and better in computational performance relative to the state-of-art mutual information measure. But proposed symmetric correlation measures are not stable enough relative to noise and should be improved.
Further research will include the design of more robust symmetric geometrical correlation coefficients and massive experimental exploration of precision and robustness for all described shape correlation techniques.
REFERENCES
Gruen A., Baltsavias E., 1985. Adaptive Least Squares Correlation with Geometrical Constraints. SPIE, vol. 595.
Maes F., Collignon A., Vandermeulen D., Marchal G., and Suetens P., 1997. Multimodality Image Registration by Maximization of Mutual Information. IEEE Transactions on Medical Imaging, Vol. 16, No. 2, April, pp.187-198.
Pyt’ev Yu., 1993. Morphological Image Analysis. Pattern Recognition and Image Analysis. V.3. No 1, pp. 19-28.
Pyt’ev Yu., Chulichkov A., 2010. Methods of Morphological Image Analysis. Fizmatlit, Moscow, 336 p. (in Russian)
Zheltov S., Sibiryakov А.1997. Adaptive Subpixel Cross-Correlation in a Point Correspondence Problem // Optical 3D Measurement Techniques. Zurich, 29 IX – 2 X.
Zheltov S., Vizilter Yu., 2004. Development of effective procedures for automatic stereo matching. // International Archives of the Photogrammetry, Remote Sensing and Spatial Information Sciences Proceedings. V.XXXV. Part B3. pp.720-723.