Full Terms & Conditions of access and use can be found at
http://www.tandfonline.com/action/journalInformation?journalCode=cbie20
Download by: [Universitas Maritim Raja Ali Haji] Date: 17 January 2016, At: 23:13
Bulletin of Indonesian Economic Studies
ISSN: 0007-4918 (Print) 1472-7234 (Online) Journal homepage: http://www.tandfonline.com/loi/cbie20
SURVEY OF RECENT DEVELOPMENTS
Yuri Sato & Arie Damayanti
To cite this article: Yuri Sato & Arie Damayanti (2015) SURVEY OF RECENT DEVELOPMENTS, Bulletin of Indonesian Economic Studies, 51:2, 165-188, DOI: 10.1080/00074918.2015.1061909 To link to this article: http://dx.doi.org/10.1080/00074918.2015.1061909
Published online: 24 Aug 2015.
Submit your article to this journal
Article views: 227
View related articles
ISSN 0007-4918 print/ISSN 1472-7234 online/15/000165-24 © 2015 Indonesia Project ANU http://dx.doi.org/10.1080/00074918.2015.1061909
* We thank interviewees in Jakarta and Tokyo for insightful information; representatives of Badan Pusat Statistik (BPS), Indonesia’s central statistics agency, for the latest detailed data on exports and a useful explanation of changes to its GDP statistics; and members of the Indonesia Study Group at ANU for helpful comments.
SURVEY OF RECENT DEVELOPMENTS
Yuri Sato* Arie Damayanti*
Institute of Developing Economies, Chiba University of Indonesia
SUMMARY
Managing the Indonesian economy in 2015 has proved challenging for the admin -istration of Joko Widodo (Jokowi). In a irst quarter plagued by external adver -sity—especially a sharp drop in exports to China—coupled with internal political paralysis and the delayed disbursement of iscal spending, the economy recorded its lowest rate of growth since 2009. Observing relatively stable inlation, Bank Indonesia (BI), the central bank, eased its policy rate in February by 25 basis points, to 7.5%. The bank also adjusted its macroprudential measures to counter declining bank lending. On the iscal side, the expected stimulus from fuel-subsidy realloca -tion and aggressive public-capital spending did not arrive. Meanwhile, tax revenue made slow progress towards its ambitious target, which it seems unlikely to attain. Increases in supply costs made it dificult for the government to align domestic fuel prices more closely to the market. Major commodity exports fell signiicantly, but some manufactured exports showed hints of an upturn. The depreciation of the rupiah, the global strategies of leading investors, and the introduction of tax-exemption policies that have been tested in neighbouring countries may have contributed to this trend. To further broaden the base of export diversiication, the priorities should be to reduce business costs and enhance competition rather than enforce mandatory regulations. Jokowi has stressed that his focus on maritime development, part of a broader development strategy, includes reducing logistics costs.
The second quarter of 2015 saw the start of several projects in Jokowi’s lagship ‘sea toll’ program to improve maritime connectivity. There is a concern, however, that the predominance of state-owned enterprises (SOEs) in strategic port opera-tions will continue to limit competition and reduce eficiency. Jokowi’s development strategy also focuses on reducing inequality. His government has implemented sev-eral distribution and redistribution policies, including the national social-security system initiated by the previous administration. The system suffered inancially in its irst year from low participation among those in the informal sector.
Keywords: export diversiication, maritime development, social security JEL classiication: E62, H53, H54, H55, I13, O11, O24, O25, O53
POLITICAL DEVELOPMENTS
In the last several months, the drama of Indonesian politics under Jokowi moved from its irst act to its second. The irst act featured a parliamentary rivalry between Jokowi’s Great Indonesia Coalition (KIH), which holds government, and Prabowo Subianto’s opposing Red-and-White Coalition (KMP), which controls the most seats. As this rivalry eased, discord between Jokowi and his supporting party—the theme of the second act—intensiied in proportion.
The parliamentary rivalry stemmed from a rollback operation led by the Prabowo camp, which lost the 2014 presidential election. After blocking parlia -ment for a couple of months, the rivalry began to dissipate. Splits in two KMP member parties—Golkar and the United Development Party (PPP)—saw the new faction join the governing coalition, while the presidential chief of staff, Luhut Panjaitan, actively mediated between Jokowi and KMP leaders, particularly Prabowo (Tempo, 29 Mar. 2015). Prabowo visited Jokowi at Bogor Palace at the
end of January, for their irst one-on-one talk since Jokowi’s inauguration, and expressed his support. Parliamentary proceedings became smoother from March. Nevertheless, the rivalry left its mark: the parliamentary standstill delayed a budget revision, postponing iscal spending and worsening the economic slow -down in the irst quarter.
In May, Jokowi and Prabowo displayed their apparent camaraderie to the pub -lic during the national congress of the National Mandate Party (PAN), which is a member party of KMP but serves as an interface between the two camps. The Democratic Party, led by the previous president Susilo Bambang Yudhoyono and once a member of KMP, eventually made its pro-government stance clear at its national congress later that month.
The creeping discord between Jokowi and his supporting party, the Indonesian Democratic Party of Struggle (PDI–P), came to a head over the party’s push to appoint Budi Gunawan, an ex-adjutant of PDI–P leader Megawati Sukarnoputri, as chief of police. It was reported that PDI–P wanted Budi in the position because the Corruption Eradication Commission (KPK) was preparing to investigate Megawati over the issuing of central-bank loans during her presidency (Kompas, 27 Jan. 2015).
Jokowi nominated Budi, even though Budi was alleged to have a larger-than-expected bank balance (Tempo, 25 Jan. 2015). When the KPK named Budi as a cor-ruption suspect, Jokowi cancelled the nomination. Soon afterwards, the police arrested KPK commissioners on suspicion of unrelated misconduct. Jokowi organ -ised Team 9, an independent expert panel, and, in line with the team’s recom -mendations, decided to place responsibility on both the police and the KPK: he dropped Budi and appointed a vice-chief, Badrodin Haiti, as chief of police, sus-pended the arrested KPK commissioners, and appointed acting commissioners. Although Jokowi ordered the appointees to reconcile the police with the KPK, the police and PDI–P were not about to give up: Budi became a vice-chief in April, his subordinates were promoted, and the police continued to arrest KPK investigators. Indonesia’s power elites seem to want to defang KPK in order to protect their interests. In May, Jokowi set up a committee to select KPK commissioners, appointing nine politically disinterested academics. The public are watching to see whether Jokowi and the committee can strengthen KPK by selecting compe -tent leaders.
Another event that demonstrated the discord within PDI–P was Megawati’s humbling message to Jokowi during the party’s national congress, where Megawati was re-elected as general chair for a fourth time and Jokowi was not given a chance to speak. In her speech, Megawati said that ‘Indonesia’s system of democracy regulates that the president and the vice-president naturally enforce a political party’s policy line. The president is a party oficial’. The media subse -quently questioned whether Jokowi belonged to the people or to PDI–P (Jakarta Post, 13 Apr. 2015). Megawati also criticised external ‘opportunists’ who were
attempting to distance Jokowi from the governing party. These ‘opportunists’ were reported to be Luhut Panjaitan; Andi Widjajanto, the cabinet secretary; and Rini Soemarno, the minister of SOEs, who had been part of Jokowi’s transition team (Kompas, 10 Apr. 2015).
The disharmony in the government’s inner circle is one of the reasons that some inancial institutions have revised down their forecasts for Indonesia’s growth. Given that Jokowi is the irst Indonesian president not to lead his own political party, the tug of war between him and his party looks set to be a persistent struc -tural problem (Kompas, 21 Feb. 2015). More broadly, relations between Indonesia’s
irst commoner president and the power elites will most likely continue to suffer from vertical conlicts of interest.
MACROECONOMIC DEVELOPMENTS Economic Growth
In the irst quarter, external adversity and evolving and yet-to-be-implemented domestic policies harmed Indonesia’s attempts to boost its economy. The contin -ued slowdown in China’s growth, the unexpectedly low growth in the United States, and the prolonged contraction of Japan’s economy all affected demand for Indonesia’s exports: these countries received about a third of Indonesia’s exports in 2014 (BI 2015a, tables V.10 and V.11). Exports to China fell the most. Declines in the prices of coal, palm oil, natural gas, and rubber commodities, which account for more than a third of Indonesia’s exports, contributed to the disappointing result.
On the domestic side, the economy has yet to see a signiicant result from the increased iscal spending allocated in the 2015 revised state budget, especially for material and capital items. The revised state budget only received its parliamen -tary approval in February and its implementing regulations in March,1 giving
the government little time to disburse signiicant non-transfer and non-subsidy expenditure in the irst quarter.
The government’s spending capacity, typically smaller in the irst quarter than in subsequent ones, was additionally restricted this year by the ongoing reorgani -sation of a number of ministries, in line with the president’s reform agenda (table 1). This may explain the low level of government consumption growth in the irst quarter. Fortunately, private consumption, which accounted for more than half of GDP, continued to grow at 5% year on year, a trend that has persisted over the last four quarters. This prevented overall consumption growth from declining
1. Law 3/2015 on Budget Revision and Presidential Regulation 36/2015 on Details of the 2015 Budget.
TABLE 1 Reformed Ministries and Establishing Regulations, 2015
Ministries and establishing regulations Changes
Coordinating Ministry for Political, Legal, and Security Affairs (Presidential Regulation 43/2015, April)
Jurisdiction change
Coordinating Ministry for the Economy (Presidential Regulation 8/2015, January)
Jurisdiction change
Coordinating Ministry for Human and Cultural Development (Presidential Regulation 9/2015, January)
Previously the Coordinating Ministry for People’s Welfare
Coordinating Ministry for the Maritime Sector (Presidential Regulation 10/2015, January)
New ministry
Ministry of Home Affairs
(Presidential Regulation 11/2015, January)
Villages portfolio separated from this ministry and moved to the Ministry of Villages, Disadvantaged Regions, and Transmigration Ministry of Education and Culture
(Presidential Regulation 14/2015, January)
Higher-education portfolio separated from this ministry and moved to the Ministry of Research, Technology, and Higher Education
Ministry of Research, Technology, and Higher Education (Presidential Regulation 13/2015, January)
Now includes the higher-education portfolio
Ministry of Labour
(Presidential Regulation 18/2015, January) Transmigration portfolio separated from this ministry and moved to the Ministry of Villages, Disadvantaged Regions, and Transmigration Ministry of Public Works and Public Housing
(Presidential Regulation 15/2015, January)
Created by a merger between the Ministry of Public Works and the Ministry of Public Housing
Ministry of Environment and Forestry (Presidential Regulation 16/2015, January)
Created by a merger between the Ministry of Environment and the Ministry of Forestry
Ministry of Villlages, Disadvantaged Regions, and Transmigration (Presidential Regulation 12/2015, January)
Previously included only the development of disadvantaged-regions portfolio. Current jurisdiction includes villages and transmigration Ministry of Land and Land Use Planning / National Land Agency
(Presidential Regulations 17/2015 and 20/2015, January)
Created by a merger between the land-use portfolio from the Ministry Public Works and the National Land Agency
Ministry of Tourism
(Presidential Regulation 19/2015, January)
Creative-economy portfolio separated from this ministry and moved to a non-ministerial body
substantially.2 In addition, despite the greatly increased allocation for capital
items in the revised state budget, made possible by the bold cuts to subsidies, the government could not take advantage of it. Capital-spending realisation in the irst quarter of 2015 was lower than in the same period in 2014, even in nominal rupiah.
By industrial origin, the slowdown in GDP growth was led by mining and manufacturing (see box 1). The mining sector seemed to be severely discouraged by the drop in commodity prices and by weaker external demand. The contin -ued depreciation of the rupiah in bilateral and effective terms should encourage exports, but it may also discourage imports of capital goods needed for manufac -turing. In the non-tradable sector, the delay in government capital spending in the irst quarter may be behind the marked drop in construction.
Under these circumstances, Indonesia’s GDP growth slowed to 4.7% in the irst quarter (table 2), adding to pessimism about whether it could reach the rate of 5.7% assumed in the revised budget. The ministry of inance revised the igure to 5.4% in May and 5.2% in July (Kompas, 4 July 2015). In addition, BI lowered its growth projection for 2015 to 5.0%–5.4% (BI 2015b).
Inlation, Exchange Rates, and Interest Rates
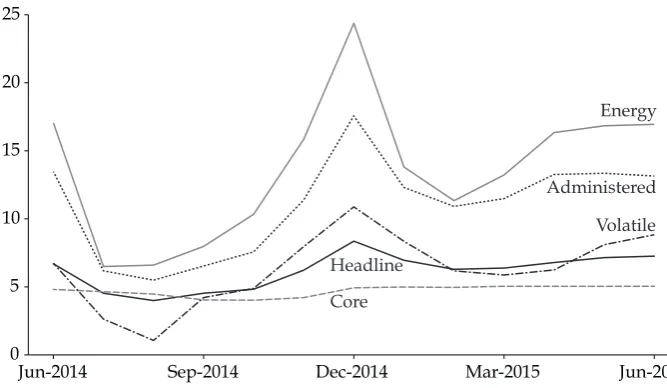
Headline inlation was fairly steady in the irst quarter, at less than 7% year on year, but still above the target range of 3%–5% (igure 1). Recent data, however, underscored a tendency for headline inlation to accelerate gradually. The admin -istered component of inlation rose in March and April, after the government increased low-octane premium petrol and diesel prices.3 Also in April, an increase
in the price of three-kilogram cylinders of liqueied petroleum gas contributed to administered inlation. In May, a volatile food component pushed headline inla -tion to 7.2%, while core inla-tion was stable at 5.0%.
On 1 January, the government partially removed the fuel subsidy and intro -duced a more market-based policy of price adjustment, making retail fuel prices and the administered component of inlation more responsive to changes in oil prices and the exchange rate. The current mechanism calculates the retail price of fuel by adding the basic cost to the costs of distribution and warehousing, as well as adding taxes and margins.4 The basic cost is determined by an oil-price index
(the Mean of Platts Singapore) and the nominal exchange rate between the rupiah and the US dollar, so the basic cost will be lower when oil prices decrease or when the rupiah appreciates, and vice versa. In January, for example, fuel prices dropped twice because of a steep decline in oil prices.
2. The period also saw an abrupt drop in the consumption of non-proit institutions serv-ing households, owserv-ing to a temporary increase in political-party spendserv-ing durserv-ing the 2014 general election. However, the share of this type of consumption in GDP was quite mar-ginal—only 1%—so its effect on overall consumption was insigniicant.
3. Pertamina’s per-litre price for premium petrol (RON 88) increased from Rp 6,700 to Rp 6,800 on 1 March and then to Rp 7,300 on 28 March. The per-litre price of diesel in-creased from Rp 6,400 to Rp 6,900 on 28 March.
4. See Presidential Regulation 191/2014, Minister of Energy Regulation 39/2014, and Minister of Energy Regulation 4/2015.
When oil prices increase and the rupiah depreciates, there will be pressure on the government not to raise the retail prices of fuel. After having increased prices twice in March, the government now seems hesitant to increase them again. In mid-May, it declined a proposal from Pertamina, the state-owned oil company, to raise premium petrol and diesel prices (Kompas, 15 May 2015). In June, it kept the prices of premium petrol and diesel unchanged, at Rp 7,300 per litre and Rp 6,900 per litre, even though oil prices rose in April and May (Jakarta Post, 31 May
2015) and the rupiah continued to weaken. In addition, the minister of energy, after a discussion with parliament, was reported to have considered changing
BOX 1 Rebasing GDP and Adopting the System Of National Accounts 2008
The GDP statistics released by Badan Pusat Statistik (BPS), Indonesia’s central statis-tics agency, on 5 February 2015 included two signiicant changes. BPS had rebased the benchmark year from 2000 to 2010—as it had done in 2004, from 1993 to 2000 (Van der Eng 2005). It had also adopted aspects of the United Nations’ System of National Accounts 2008 (2008 SNA) instead of continuing to use the 1993 SNA. Indonesia had adopted the 2008 SNA ahead of most of Asian countries, supported by the Australian Bureau of Statistics (the earliest adopter, in 2009).
As a result of these changes, the measured size of Indonesia’s GDP increased. At current prices in 2010, GDP estimated with the new methodology (Rp 6,864 trillion) was Rp 417 trillion, or 6.5%, larger than that using the old methodology (Rp 6,447 tril-lion). Accordingly, key indicators presented as a percentage of GDP decreased slightly. Of the difference, 4.1% more value added was captured by the new statistical benchmark surveys, and 2.4% was incorporated by changing methodology to the 2008 SNA (BPS 2015). The increase in GDP from using the new benchmark surveys was due to an upward revision of value added in the sectors that have developed the most in the last decade, such as information and technology, trade, transport, tourism, inance, insurance, and real estate. Services sectors generally account for a larger share of GDP under the new estimates. Meanwhile, the increase of GDP from the change to the 2008 SNA was due mainly to the introduction of new concepts. Agricultural output, for instance, which covered only harvested output in the previ-ous methodology, now covers harvested output and the value of immature plants and animals. A part of expenditure on mineral exploration that used to be included in intermediate consumption is now categorised under gross ixed capital formation.
The new methodology also introduces some changes in classiication. On the expenditure side, a part of government consumption expenditure (weapons) is clas-siied as part of gross ixed capital formation, while a part of household consumption expenditure is classiied as expenditure of non-proit institutions that provide goods or services to households. (Most of the expenditure is by political parties, but the classiication also includes foundations, NGOs, and religious organisations, among others.)
On the output side, the industrial classiication increases in number, from 9 to 17, and is reorganised in accordance with the change from Revision 2 to Revision 4 of the International Standard Industrial Classiication. Recycling and waste management, for example, are separated from manufacturing and move into water supply and sewerage; a part of the printing industry moves to information and communication; and sewing moves from services to manufacturing. With the new methodology, more detailed sectoral data are available by which to measure the evolving economy (see World Bank 2015b, box 1).
price adjustments to a three-monthly schedule (AntaraNews.com, 13 May 2015). These developments suggest that the fuel-price adjustment may become less lex -ible than intended. Some sort of subsidy will emerge when the government keeps retail prices below the cost of supply. Political interest is often behind such subsi -dies, even though accommodating it in economic policy is often ineficient.
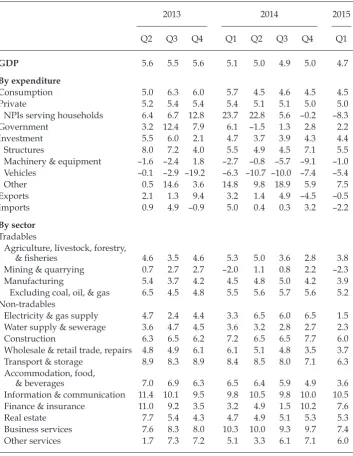
TABLE 2 Components of GDP Growth, 2013–15 (% year on year)
2013 2014 2015
Q2 Q3 Q4 Q1 Q2 Q3 Q4 Q1
GDP 5.6 5.5 5.6 5.1 5.0 4.9 5.0 4.7
By expenditure
Consumption 5.0 6.3 6.0 5.7 4.5 4.6 4.5 4.5
Private 5.2 5.4 5.4 5.4 5.1 5.1 5.0 5.0
NPIs serving households 6.4 6.7 12.8 23.7 22.8 5.6 –0.2 –8.3
Government 3.2 12.4 7.9 6.1 –1.5 1.3 2.8 2.2
Investment 5.5 6.0 2.1 4.7 3.7 3.9 4.3 4.4
Structures 8.0 7.2 4.0 5.5 4.9 4.5 7.1 5.5
Machinery & equipment –1.6 –2.4 1.8 –2.7 –0.8 –5.7 –9.1 –1.0
Vehicles –0.1 –2.9 –19.2 –6.3 –10.7 –10.0 –7.4 –5.4
Other 0.5 14.6 3.6 14.8 9.8 18.9 5.9 7.5
Exports 2.1 1.3 9.4 3.2 1.4 4.9 –4.5 –0.5
Imports 0.9 4.9 –0.9 5.0 0.4 0.3 3.2 –2.2
By sector
Tradables
Agriculture, livestock, forestry,
& isheries 4.6 3.5 4.6 5.3 5.0 3.6 2.8 3.8
Mining & quarrying 0.7 2.7 2.7 –2.0 1.1 0.8 2.2 –2.3
Manufacturing 5.4 3.7 4.2 4.5 4.8 5.0 4.2 3.9
Excluding coal, oil, & gas 6.5 4.5 4.8 5.5 5.6 5.7 5.6 5.2 Non-tradables
Electricity & gas supply 4.7 2.4 4.4 3.3 6.5 6.0 6.5 1.5 Water supply & sewerage 3.6 4.7 4.5 3.6 3.2 2.8 2.7 2.3
Construction 6.3 6.5 6.2 7.2 6.5 6.5 7.7 6.0
Wholesale & retail trade, repairs 4.8 4.9 6.1 6.1 5.1 4.8 3.5 3.7 Transport & storage 8.9 8.3 8.9 8.4 8.5 8.0 7.1 6.3 Accommodation, food,
& beverages 7.0 6.9 6.3 6.5 6.4 5.9 4.9 3.6
Information & communication 11.4 10.1 9.5 9.8 10.5 9.8 10.0 10.5 Finance & insurance 11.0 9.2 3.5 3.2 4.9 1.5 10.2 7.6
Real estate 7.7 5.4 4.3 4.7 4.9 5.1 5.3 5.3
Business services 7.6 8.3 8.0 10.3 10.0 9.3 9.7 7.4
Other services 1.7 7.3 7.2 5.1 3.3 6.1 7.1 6.0
Source: CEIC Indonesia Premium Database.
Note: Calculated on the basis of GDP at 2010 constant prices. NPIs = Non-proit institutions.
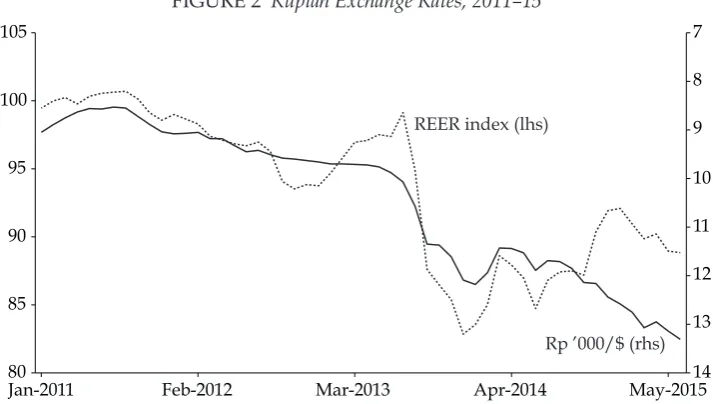
The rupiah continued to weaken in the irst half of 2015. On 17 June, the US dollar was trading at Rp 13,367 (at BI’s rupiah-buying rate), the lowest level since 1998. Comparing the last trading day of 2014 with mid-June 2015, point to point, the rupiah, in nominal terms, fell by 7% against the dollar. The rupiah also weak -ened in real effective terms between January and June 2015—unlike in 2014, when the rupiah’s weakening against the dollar was accompanied by its appreciating in effective terms (igure 2).
The depreciation of the rupiah in effective terms should increase the competi-tiveness of Indonesia’s exports, particularly when inlation in Indonesia is higher than in destination countries. BI indicated in March that the rupiah needed to fall in order to improve the trade deicit (Wall Street Journal, 13 Mar. 2015). Yet
Indonesia’s export performance in the irst quarter of 2015 remained poor, with a marked drop in non–oil and gas exports. The falling rupiah has, however, reduced imports and subsequently decreased the current account deicit despite the decline in exports (see ‘Balance of Payments’).
The stability of the rupiah may also be threatened by the large outstanding external debt held by corporate borrowers. At the end of the irst quarter, this debt amounted to $298 billion, of which 56% was held by the private sector (Ministry of Finance and BI 2015). To mitigate the risk, BI issued a regulation requiring that non-bank corporate borrowers adopt some prudential principles in manag -ing their external debt.5 From January 2015, corporate borrowers holding external
debt (other than trade credit) must satisfy three requirements: a minimum hedg -ing ratio, to mitigate currency risk; a minimum foreign-exchange liquidity ratio, to mitigate liquidity risk; and a minimum credit rating, to mitigate overleverage risk (BI press release, 30 Oct. 2014).
5. BI Regulation 16/20/PBI/2014, later improved by BI Regulation 216/21/PBI/2014 and External Circulation 16/24/DKEM.
FIGURE 1 Inlation of the Consumer Price Index, 2014–15 (%)
Jun-2014 Sep-2014 Dec-2014 Mar-2015 Jun-2015 0
5 10 15 20 25
Core Headline
Volatile Administered Energy
Source: CEIC Indonesia Premium Database.
It is dificult to determine whether the regulation’s administrative sanctions will ensure that private companies adhere to it. Yet some SOEs acted promptly. In April 2015, electricity company PLN was reported to have set up a $950 million hedging facility with three state banks, while airline Garuda Indonesia signed a hedging-facility agreement worth Rp 1 trillion with four private banks (Jakarta Post, 11 and 15 Apr. 2015). Oil company Pertamina followed in May, with a hedg -ing deal worth $2.5 billion with three state banks (CNNIndonesia.com, 13 May 2015). Minister Soemarno indicated that all SOEs will be required to have hedging facilities (SuaraMerdeka.com, 7 Mar. 2015).
With core inlation relatively under control, in February BI cut its benchmark rate by 25 basis points to 7.5% (the rate it was before the increase in November 2014), seemingly to encourage growth. BI has since maintained this rate. A slight monetary easing was apparent from the one-week interbank call-money rate, whose daily average declined from 6.0% in January to 5.8% in June. Yet perhaps as a consequence of tightened monetary policy in November 2014—coupled with slowing economic growth in the irst quarter—non-performing loans for working-capital lending rose from 2.5% in December 2014 to 2.9% in April 2015. For con -sumption lending, non-performing loans remained low at 1.6% from January 2015 (Financial Services Authority 2015, table 4.9.a).
BI’s lowering its benchmark rate in February had little effect on bank lending, which continued to moderate (especially lending for working capital). In March, loans increased by just over 11% year on year, the lowest rate since 2010 and well below BI’s initial target for 2015 of 15%–17%. Consequently, introducing more conducive monetary policy may be warranted to support growth; BI is more likely to adjust its macroprudential measures than cut its benchmark rate further. In June, BI revised its regulations on calculating statutory reserves for loan-to-deposit ratios and on determining loan-to-value ratios for home loans and
FIGURE 2 Rupiah Exchange Rates, 2011–15
Jan-2011 Feb-2012 Mar-2013 Apr-2014 May-2015 80
85 90 95 100 105
14 13 12 11 10 9 8 7
REER index (lhs)
Rp ’000/$ (rhs)
Source: CEIC Global Database.
Note: The right-hand axis is inverted. REER = real effective exchange rate.
downpayments for vehicle loans.6 The term ‘deposit’, in relation to loan-to-deposit
ratios, was revised to include not only third-party funds but also securities with certain speciied conditions, such as investment-grade securities issued through public offerings. The term ‘loan-to-deposit ratio’ was changed to ‘loan-to-funding ratio’. The amended regulations give banks incentives to lend to micro, small, and medium enterprises, by increasing the upper bound of the loan-to-funding ratio from 92% to 94%. Loan-to-value ratios for home loans were increased by 10% and downpayments for vehicle loans were reduced by 5%; a bank will be able to raise these ratios only if its proportion of non-performing loans is below 5%.
BI’s macroprudential measures are limited in that they address only consump -tion lending, which composes only 28% of bank lending. It remains to be seen whether these measures alone will encourage banks to lend, particularly during this period of weak domestic sentiment.
Fiscal Policy
The structural improvement in the state budget from subsidy cuts earned a posi -tive evaluation from ratings agency Standard & Poor’s, which in May changed its outlook for Indonesia from stable to positive. Nevertheless, the government’s ambitious spending plan requires revenue from other sources. Accordingly, the government aimed to increase overall tax revenue by 30%, income tax by 24%, and value-added tax (VAT) by 42% from their realisations in 2014, in response to a revised assumption about oil prices that reduces natural-resource revenues and overall non-tax revenues. Tax-revenue targets have often been missed in the past, and VAT targets more so than income-tax targets. Income-tax collection in nominal terms in the irst half of 2015 improved slightly compared with the same period last year, while VAT changed little (table 3). Both were further from their revenue targets than they were at this time in 2014. It is therefore curious that the minister of inance removed VAT on some luxury goods (Jakarta Post, 11 June 2015). This policy may be good for consumption spending, but it will make the tax target harder to reach. Perhaps the government itself knows that its tax-revenue targets are unrealistic.
Under Minister of Finance Regulation 91/2015, the Directorate General of Taxes reduced or eliminated penalties for underestimation or late payment of income taxes in previous years. Known as the ‘sunset policy’, these measures were also taken in 2008 and succeeded in increasing domestic tax collection beyond the target. The authority also considered again implementing a tax amnesty, which would aim to induce Indonesian citizens to repatriate offshore funds. The unsuc-cessful tax amnesties that Indonesia implemented in 1964 and 1985 were thought to have failed because of a lack of necessary prerequisites, notably law enforce -ment (Liputan6.com, 22 Apr. 2015).
Government spending increased by Rp 207 trillion (about $16 billion) in 2015 but was disbursed slowly in the irst half of the year—capital and material spending more so than personnel spending, subsidies, and regional transfers. The decision to redirect subsidy spending to infrastructure has created an expenditure problem for the government, because infrastructure spending is harder to disburse than subsidy spending. Further, assuming that the government will spend 90% of its
6. BI Regulation 17/11/PBI/2015 and BI Regulation 17/10/PBI/2015.
budget (as in the past), the budget deicit is unlikely to stay at 1.9% of GDP. The government would need to reach 98% of its tax-revenue target, which is hard to imagine. The minister of inance stated that the deicit may increase to 2.3% of GDP unless economic circumstances improve (CNNIndonesia.com, 4 May 2015).
Another reason for the low level of central-government spending was the new government’s renaming and reorganising of 13 ministries (table 1). Almost
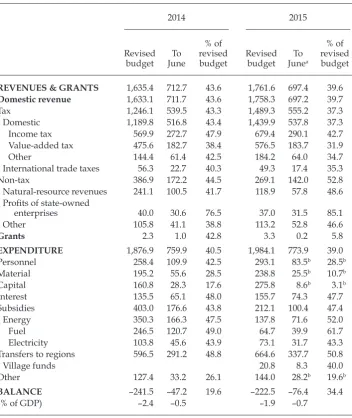
TABLE 3 Mid-Year Budget Progress, 2014 and 2015 (Rp trillion)
2014 2015
Revised budget JuneTo
% of revised
budget Revised budget JuneTo a
% of revised budget
REVENUES & GRANTS 1,635.4 712.7 43.6 1,761.6 697.4 39.6
Domestic revenue 1,633.1 711.7 43.6 1,758.3 697.2 39.7
Tax 1,246.1 539.5 43.3 1,489.3 555.2 37.3
Domestic 1,189.8 516.8 43.4 1,439.9 537.8 37.3
Income tax 569.9 272.7 47.9 679.4 290.1 42.7
Value-added tax 475.6 182.7 38.4 576.5 183.7 31.9
Other 144.4 61.4 42.5 184.2 64.0 34.7
International trade taxes 56.3 22.7 40.3 49.3 17.4 35.3
Non-tax 386.9 172.2 44.5 269.1 142.0 52.8
Natural-resource revenues 241.1 100.5 41.7 118.9 57.8 48.6 Proits of state-owned
enterprises 40.0 30.6 76.5 37.0 31.5 85.1
Other 105.8 41.1 38.8 113.2 52.8 46.6
Grants 2.3 1.0 42.8 3.3 0.2 5.8
EXPENDITURE 1,876.9 759.9 40.5 1,984.1 773.9 39.0
Personnel 258.4 109.9 42.5 293.1 83.5b 28.5b
Material 195.2 55.6 28.5 238.8 25.5b 10.7b
Capital 160.8 28.3 17.6 275.8 8.6b 3.1b
Interest 135.5 65.1 48.0 155.7 74.3 47.7
Subsidies 403.0 176.6 43.8 212.1 100.4 47.4
Energy 350.3 166.3 47.5 137.8 71.6 52.0
Fuel 246.5 120.7 49.0 64.7 39.9 61.7
Electricity 103.8 45.6 43.9 73.1 31.7 43.3
Transfers to regions 596.5 291.2 48.8 664.6 337.7 50.8
Village funds 20.8 8.3 40.0
Other 127.4 33.2 26.1 144.0 28.2b 19.6b
BALANCE –241.5 –47.2 19.6 –222.5 –76.4 34.4
(% of GDP) –2.4 –0.5 –1.9 –0.7
Source: Data from the Ministry of Finance (2015).
Note: Discrepancies are due to rounding.
a Includes Ministry of Finance projections for the last week of June 2015.
b To 30 April 2015.
all corresponding presidential regulations were issued in late January 2015; but many top-level appointments within these reformed ministries had yet to be com -pleted by late February, prompting Jokowi to issue a presidential instruction on illing senior government positions. The problem has delayed many government programs and activities.
Balance of Payments
In the irst quarter of 2015, the current account deicit dropped to 1.8% of GDP (table 4), owing to an increase in the trade surplus and to a smaller deicit in the trade of services than in the fourth quarter of 2014. Falling oil prices combined with fuel-subsidy reform reduced the deicit in the oil and gas trade balance. The increased trade surplus, however, masked the poor performance of Indonesia’s goods exports; imports contracted owing to weakening domestic demand and falling oil prices.
TABLE 4 Balance of Payments, 2014–15 ($ billion)
2014 2015
Q1 Q2 Q3 Q4 Total Q1
Current account –4.1 –8.8 –6.9 –5.7 –25.4 –3.8
Goods 3.3 –0.4 1.6 2.4 7.0 3.1
Exports 43.9 44.5 43.6 43.2 175.3 37.8
Non–oil & gas 35.8 36.7 36.0 36.6 145.0 33.1
Oil & gas 7.6 7.5 7.3 6.4 28.8 4.4
Other goods 0.5 0.3 0.4 0.3 1.5 0.4
Imports –40.6 –44.9 –42.0 –40.8 –168.3 –34.7
Non–oil & gas –30.2 –34.2 –31.6 –31.6 –127.7 –29.1
Oil & gas –10.3 –10.7 –10.4 –9.2 –40.6 –5.6
Other goods 0.0 0.0 0.0 0.0 0.0 0.0
Services –2.1 –2.8 –2.5 –2.6 –10.0 –1.9
Exports 5.9 5.7 5.7 6.2 23.5 5.6
Imports –8.0 –8.6 –8.2 –8.8 –33.5 –7.4
Primary income –6.4 –7.1 –7.1 –7.0 –27.6 –6.5
Secondary income 1.1 1.5 1.2 1.4 5.2 1.4
Capital & inancial account 7.1 13.7 14.7 8.9 44.4 5.9
Direct investment 3.2 3.4 5.9 3.0 15.5 2.3
Portfolio investment 8.7 8.0 7.4 1.9 26.1 8.9
Financial derivatives & other –4.8 2.2 1.3 4.0 2.8 –5.2
Errors & omissions –0.9 –0.6 –1.3 –0.8 –3.7 –0.8
Overall balance (change in reserves) 2.1 4.3 6.5 2.4 15.2 1.3
Foreign reserves 102.6 107.7 111.2 111.9 111.9 111.6
Current account (% of GDP) –1.9 –3.9 –3.0 –2.6 –2.9 –1.8
Source: CEIC Indonesia Premium Database.
Note: Discrepancies are due to rounding.
Direct investment decreased. The slowdown in foreign investment was con-irmed by data from BI and the Investment Coordinating Board, with manufac -turing and mining slowing the most.7 Portfolio investment resumed, after having dropped sharply in the fourth quarter of 2014. The increase came largely from foreign net buying of government securities. Lower surpluses in the capital and inancial accounts suggest, however, that the government has found it increas -ingly dificult to maintain global investor conidence.
EXPORTS: CHALLENGES TO DIVERSIFICATION
Indonesia’s total export value has continued to fall since 2012, in contrast to its continuous double-digit growth from 2004 to its peak in 2011 (except during 2009, owing to the global inancial crisis). This reversal owes much to the end of the commodity boom that had been driven chiely by increased demand in China. From mid-2011, Indonesia’s export price index edged downwards. In 2014, as prices continued to weaken, the quantity of exports dropped too, by 21.5%, its largest fall since the 1960s.8 The drop was due partly to a decreased demand
for commodities and partly to a ban on exports of raw minerals, implemented in January 2014 under Law 4/2009 on Mineral and Coal Mining. After having enjoyed a dramatic expansion of commodity exports during the boom, Indonesia is again facing the challenge of diversifying its exports, just as it did in the mid-1980s after the oil boom ended.
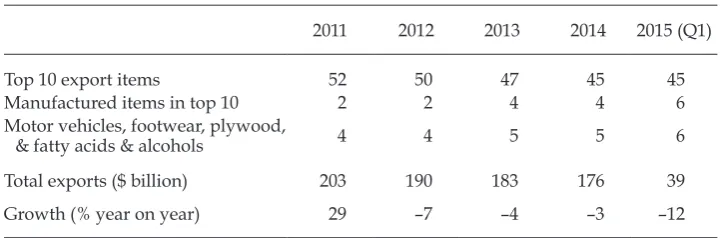
Tables 5 and 6 show the transition in Indonesia’s main exports since the end of the commodity boom, sorting export items by four-digit Harmonized System codes.9 In 2011, all top-10 items were natural resources, including two
manufactured goods (reined copper and tin).10 Since 2012, other manufactured goods have entered the top 10, including motor vehicles, footwear, plywood, and fatty acids and alcohols (that is, oleo-chemical products processed from palm oil). Figure 3 shows the upward trend of these four items in the 2010s, while the major commodities have declined steeply (igure 4). Even though the magnitude is quite small, this trend appears to show the initial moves towards export diversiication. The trend seems to have continued in 2015, which has seen another large drop in total export value (table 6).
This falling trend in commodities exports, coupled with signs of an upturn in some manufactured goods, is evident in Indonesia’s exports to its three main
7. BI and the Investment Coordinating Board measure foreign direct investment in differ-ent ways (Lindblad and Thee 2007, box 1).
8. The fall in export volumes in 2014 was larger than the fall of 20.9% in 1962, according to consecutive data from BPS on export volumes since 1958.
9. The World Customs Organization’s Harmonized System is a standardised classiication of traded goods. It is used widely in trade statistics. The four-digit level of this classiica-tion is useful for distinguishing between major items (such as mineral fuels and coal). 10. To identify manufactured goods, we combined Harmonized System codes with the United Nations’ Standard International Trade Classiication (SITC), which is more suit-able for economic and industrial analysis. ‘Manufactured goods’ here refer to four-digit Harmonized System items in SITC sections 5–8: chemicals and related products, manu-factured goods (classiied chiely by material), machinery and transport equipment, and miscellaneous manufactured articles.
TABLE 5 Transition of Indonesia’s Top 10 Export Items, 2011–15
2011 2012 2013 2014 2015 (Q1)
1 Coal Coal Coal Coal Coal
2 Natural gas Natural gas Natural gas Palm oil Palm oil
3 Palm oil Palm oil Palm oil Natural gas Natural gas
4 Petroleum oil Petroleum oil Petroleum oil Petroleum oil Petroleum oil 5 Natural rubber Natural rubber Natural rubber Natural rubber Jewellerya 6 Copper ore Copper ore Copper ore Motor vehiclesa Natural rubber 7 Palm-kernel oil Palm-kernel oil Petroleum coke Palm-kernel oil Palm-kernel oil 8 Petroleum-oil
products
Petroleum coke Footweara Plywooda Motor vehiclesa
9 Coppera Motor vehiclesa Plywooda Fatty acids & alcoholsa
Plywooda
10 Unwrought tina Footweara Motor vehiclesa Petroleum coke Copper ore
Sources: Data from the World Trade Atlas and Badan Pusat Statistik (BPS).
Note: Items are deined using four-digit Harmonized System codes.
aManufactured items.
TABLE 6 Share of Indonesia’s Total Exports, 2011–15 (%)
2011 2012 2013 2014 2015 (Q1)
Top 10 export items 52 50 47 45 45
Manufactured items in top 10 2 2 4 4 6
Motor vehicles, footwear, plywood,
& fatty acids & alcohols 4 4 5 5 6
Total exports ($ billion) 203 190 183 176 39
Growth (% year on year) 29 –7 –4 –3 –12
Sources: Data from the World Trade Atlas and Badan Pusat Statistik (BPS).
Note: Items are deined using four-digit Harmonized System codes.
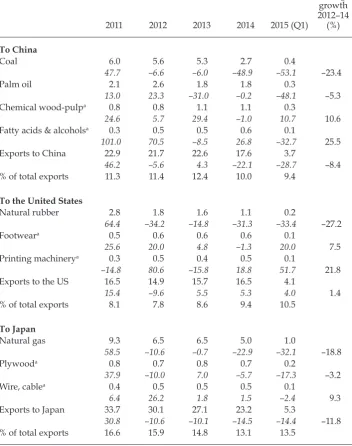
destinations: China, the United States, and Japan (table 7). Exports to China have been relatively dynamic. The two leading commodities during the boom—coal and palm oil—have declined quickly, having been replaced gradually by resource-based manufactured goods. Exports to the United States are relatively diversiied into manufactured goods and are increasing, unlike those to China and Japan. The largest item, natural rubber, is shrinking drastically, whereas footwear (one of the typical conventional items) and printing machinery (an export category since 2007) are growing. The total value of exports to Japan, which remains Indonesia’s largest export destination, continues to decrease, as does the value of natural gas, while the values of manufactured items show a weaker upward trend than in exports to China and the United States.
after the Commodities Boom, 2000–2014 ($ billion)
2000 2002 2004 2006 2008 2010 2012 2014 0.0
0.5 1.0 1.5 2.0 2.5 3.0
Fatty acids & alcohols Motor vehicles
Footwear
Plywood
Source: Data from the World Trade Atlas.
FIGURE 4 Trends in Major Commodities before and after the Commodities Boom, 2000–2014 ($ billion)
2000 2002 2004 2006 2008 2010 2012 2014 0
5 10 15 20 25 30
Coal
Natural rubber
Copper ore
Source: Data from the World Trade Atlas.
($ billion and % year on year)
2011 2012 2013 2014 2015 (Q1)
Average growth 2012–14
(%)
To China
Coal 6.0 5.6 5.3 2.7 0.4
47.7 –6.6 –6.0 –48.9 –53.1 –23.4
Palm oil 2.1 2.6 1.8 1.8 0.3
13.0 23.3 –31.0 –0.2 –48.1 –5.3
Chemical wood-pulpa 0.8 0.8 1.1 1.1 0.3
24.6 5.7 29.4 –1.0 10.7 10.6
Fatty acids & alcoholsa 0.3 0.5 0.5 0.6 0.1
101.0 70.5 –8.5 26.8 –32.7 25.5
Exports to China 22.9 21.7 22.6 17.6 3.7
46.2 –5.6 4.3 –22.1 –28.7 –8.4
% of total exports 11.3 11.4 12.4 10.0 9.4
To the United States
Natural rubber 2.8 1.8 1.6 1.1 0.2
64.4 –34.2 –14.8 –31.3 –33.4 –27.2
Footweara 0.5 0.6 0.6 0.6 0.1
25.6 20.0 4.8 –1.3 20.0 7.5
Printing machinerya 0.3 0.5 0.4 0.5 0.1
–14.8 80.6 –15.8 18.8 51.7 21.8
Exports to the US 16.5 14.9 15.7 16.5 4.1
15.4 –9.6 5.5 5.3 4.0 1.4
% of total exports 8.1 7.8 8.6 9.4 10.5
To Japan
Natural gas 9.3 6.5 6.5 5.0 1.0
58.5 –10.6 –0.7 –22.9 –32.1 –18.8
Plywooda 0.8 0.7 0.8 0.7 0.2
37.9 –10.0 7.0 –5.7 –17.3 –3.2
Wire, cablea 0.4 0.5 0.5 0.5 0.1
6.4 26.2 1.8 1.5 –2.4 9.3
Exports to Japan 33.7 30.1 27.1 23.2 5.3
30.8 –10.6 –10.1 –14.5 –14.4 –11.8
% of total exports 16.6 15.9 14.8 13.1 13.5
Sources: Data from the World Trade Atlas and Badan Pusat Statistik (BPS).
Note: Year-on-year growth rates are italicised.
aManufactured items.
This upward trend in the export value of some manufactured goods (igure 3), should it continue, is likely to be complex. The real effective depreciation of the rupiah should help manufactured exports with fewer imported inputs to regain their price competitiveness. The depreciation may not have such a decisive effect on more broad-based export diversiication, however, considering that the index of the real effective exchange rate has not reached the level it was before the boom (83, in 2004).11
The corporate strategy of leading investors may be another key factor. Automotive manufacturer Toyota Motor and its afiliate Daihatsu, for example, positioned Indonesia in 2003 as one of the production bases for their emerging-market models. Amid the Japanese investment boom in Indonesia, which began in 2010, most Japanese automotive manufacturers invested in strategic vehicle models and by 2014 began exporting. Inluencing their decision were Indonesia’s fundamental advantages—a large population and a large demographic dividend, an emerging middle class, its economies of scale as a production and export base, its location, and its political stability—rather than particular policies (authors’ interviews with Japanese manufacturers; Natsuda, Otsuka, and Thoburn 2015).
Indeed, Indonesia has no direct policies on the export of motor vehicles, although its Low-Cost Green Car (LCGC) program, planned in 2009 and enacted in 2013, gives manufacturers incentives to produce small, affordable, fuel-eficient passen -ger vehicles, and may have increased exports indirectly. If a produced model meets certain requirements of displacement, fuel eficiency, price, and the use of local components, the government will exempt luxury tax, import duty for machinery, and 30% of income tax. The prototype was Thailand’s Eco-Car program, intro -duced in 2007; seeing its success, the Philippines and Indonesia followed. While the LCGC program is designed to stimulate the domestic market, at least three manufacturers have LCGCs as their central models for export from Indonesia.
Another case is palm oil. During 2011–14, exports of processed palm oil increased (along with those of fatty acids and alcohols), expanding their share of total palm-oil exports from 49% to 76%, while exports of crude palm oil decreased by more than half. This transformation may have had to do with the introduc -tion, in 2011, of a progressive export-tax exemption system that imposed higher tax rates on crude oils and lower tax rates on processed oils and oleo-chemicals. Malaysia introduced a similar system in 1976 and found it effective in replacing crude exports with processed exports (Rasiah 2006). On one hand, export substi -tution, or upgrading primary exports to higher-value-added, processed exports, has been seen as a promising course of development for Southeast Asian countries rich in agrarian resources (Myint 1970; Suehiro 2008); on the other hand, all trade regulations have costs in a broader sense, including impacts on domestic supply, price formation, net jobs, and resource and environmental management (Burke and Resosudarmo 2012). If Indonesia has learnt from its export success in the post-oil-boom period and wants again to achieve broad-based diversiication, the most signiicant task would be to revitalise its industrial and trade performance through deregulation, competition, and lower logistics costs (World Bank 2013a).
11. During the oil boom, the 1986 devaluation of the rupiah—but not the 1978 or 1983 de-valuations—pushed the real exchange rate below pre-boom levels and accelerated non-oil exports (Sanjoto and Mihira 1990).
NEW FOCUS OF INDONESIA’S DEVELOPMENT STRATEGY
Having inherited the basic premise of Indonesia’s development strategy—to sus -tain growth on the basis of decentralised democracy—the Jokowi government has added new areas of focus, including reducing inequality and accelerating mari-time development.
After the Yudhoyono decade, Indonesia’s greatest problems are not only pov -erty, which can be overcome by economic growth, but also inequality, which can increase in association with economic growth. During 2004–14, Indonesia achieved growth of 6% in some years; the poverty headcount ratio decreased from 17% to 11%, but the Gini coeficient, a measure of inequality, rose from 0.32 to 0.41. In the National Medium-Term Development Plan 2015–2019, the Jokowi government emphasises income equity (focusing on the bottom 40% of the popu -lation by income) and spatial equity (focusing on villages, remote areas, eastern Indonesia, and other areas outside Java). The basic approach, according to the plan, is to improve the target population’s access to public services and to means of production, such as inancial services; information and telecommunications; a minimum area of land (two hectares per household); seeds, seedlings, and breed -ing stock for agriculture, forestry, ishery and husbandry; markets; and train-ing opportunities (Republic of Indonesia 2015). The major tools for the redistribution policy in the plan are iscal allocation to local governments—including village funds introduced by Law 6/2014 on Villages—and the national social-security system that started in January 2014.
While the focus on reducing inequality is no doubt heading in the right direc -tion, similar comprehensive plans have been announced in the past but have made limited progress. It remains to be seen which parts of the plan will have the most tangible effects.
Jokowi and his strategists have promoted his maritime focus since before the presidential election. In November 2014, after his inauguration, Jokowi announced that his vision of Indonesia as a global maritime fulcrum (poros mar-itim dunia) has ive doctrines. The irst, the rediscovering of Indonesia’s maritime culture, aims to restore Indonesia identity as a maritime nation. The second and third, on maritime resource management and maritime infrastructure, relate to economic development. The fourth and ifth, on maritime diplomacy and mari -time defence, relate to the country’s external strategy. The diplomacy doctrine puts much weight on stopping illegal ishing in order to increase Indonesia’s ish catch. The government has created a new coordinating ministry for mari -time affairs and placed four ministries under its jurisdiction: transport, mari-time affairs and isheries, tourism, and energy and mineral resources. The emphasis on economic aspects is clear.
The government’s maritime focus is not new (Cribb and Ford 2009). Its origins can be traced back to 1957, when Prime Minister Djuanda declared Indonesia an archipelagic state and deined ‘archipelagic waters’ as a territory over which the state had sovereignty. Twenty-ive years later, in 1982, the concept was approved during the United Nations Convention on the Law of the Sea. The Djuanda cabinet also established Indonesia’s irst maritime-related ministry. The practice was followed by Sukarno’s cabinets during 1959–67. During the Soeharto era of ‘development’, however, maritime-related ministries were abolished over three decades; Soeharto’s development centred on land. The irst president to pay
attention to the sea in the context of economic development was Abdurrahman Wahid. He established a ministry of sea exploration in 1999, which constituted an institutional starting point for administering maritime development in Indonesia. A new element of the Jokowi government would lie in focusing on the sea in the design of economic development and connectivity (Bappenas 2015, 21), and in promoting it more actively than previous administrations.
Maritime Development
On the morning of 22 May 2015, Jokowi opened the Teluk Lamong terminal of Tanjung Perak port in Surabaya, East Java, and, in the afternoon, broke ground for a new port in Makassar, South Sulawesi. He stressed that ‘we have forgotten and need to remind [ourselves] that two-thirds of Indonesian territory is sea. By revitalising and connecting ports across the country, transport and logistics costs could be lowered by one-third or 50%’ (Tempo, 23 May 2015). These two ports
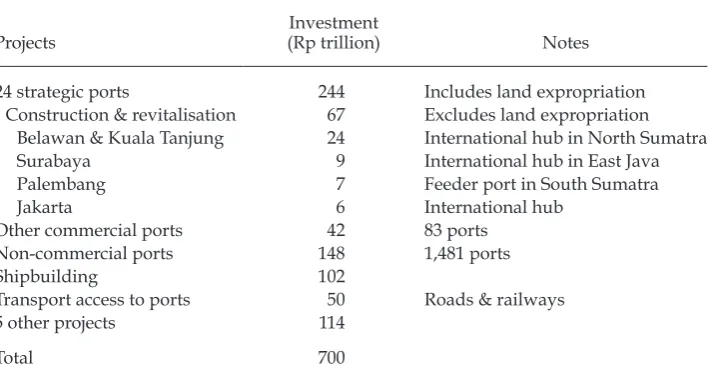
are vital components of the proposed ‘sea toll’, the government’s lagship mari -time development. The ‘sea toll’, according to Bappenas (2015, 25), the National Development Planning Agency, refers to a transit corridor featuring ‘effective maritime connectivity equipped with routine and regular shipping services between western and eastern Indonesia’. The government estimates that the total investment for the program from all sources over the next ive years will be Rp 700 trillion ($54 billion) (table 8). The main projects involve the development of 24 strategic ports, consisting of 5 international hub ports (including Tanjung Perak, a new port in Makassar), and 19 feeder ports. Of a total Rp 244 trillion ($19 billion), Rp 67 trillion will fund port construction and revitalisation. The rest, Rp 177 tril-lion ($14 biltril-lion), is presumably required for land expropriation, though it is not explicitly documented. Land expropriation could be a source of uncertainty that directly affects the program’s costs and timeline.
A salient feature of the ‘sea toll’ program is the leading role of SOEs. Indonesian Port Corporations, Pelindo I to IV, will be the sole operator of all 24 strategic ports and a sole investor in 18 ports. Private participation will be limited to six ports. Other SOEs, such as shipping company Pelni, ferry operator ASDP, and three shipbuilding companies, are also major players in the program. These SOEs obtain funds from the state budget and receive injections of state capital, but most investment funding is subject to the procurement of SOEs themselves (through sources such as state bank loans, external syndicate loans, and global bonds).
Law 17/2008 on Shipping dismantled the long-held legislated monopoly of Pelindo in port services and was expected to increase competition by encourag -ing private participation and reduc-ing port costs and dwell times (Ray 2009). However, the ‘sea toll’ program demonstrates the persistent predominance of Pelindo. The program itself is a renewed version of the Archipelagic Pendulum, a national port development program designed in 2012 by Pelindo II, the operator of Jakarta’s Tanjung Priok port. During Jokowi’s surprise visit to Tanjung Priok in June, the port’s dwell time was found to be 5.5 days, longer than the target of 4.7 days and not much improved from 6.0 days in 2013 (Jakarta Post, 23 June 2015). Pelindo II ascribed the ineficiency to the fact that eight ministries were involved in processing documents in the port. The main culprit would have been the absence of a responsible administrator to coordinate and simplify complex port procedures.
The largest project involving private participation is a port in Surabaya, where Pelindo III and AKR Corporindo Tbk are jointly developing the 2,500-hectare Java Integrated Industrial and Ports Estate. The AKR group has specialised in chemical trading since the 1960s but began to focus on logistics infrastructure in 2011, after selling its blue-chip sorbitol business to US multinational Cargill for around $300 million (authors’ interview with the CEO of AKR Corporindo, Jakarta, 17 March 2014). In shipping, a private local company in Lampung, South Sumatra, opened a new regular route of 1.5 round trips (of 36–40 hours one way) a week between Lampung and Surabaya, becoming the irst short-sea shipping operator in the ‘sea toll’ program (AntaraNews.com, 7 May 2015).12 Tsuneishi Holdings, a major
Japanese shipbuilder, announced that it was investing $40 million to set up a joint venture in South Sulawesi for ship repairing, in the irst phase, and shipbuild -ing, in the second phase (Jakarta Globe, 26 May 2015). This was the irst Japanese
investment in the Indonesian shipbuilding industry.
While the entry of competent private players is expected to improve the per-formance of Indonesia’s shipping industry, further private participation remains uncertain. This state-controlled sector still has many virtual barriers to entry, even after the enactment of the 2008 shipping law. To make Indonesia’s sea-transport system more competitive, the regulatory environment must allow private players to revitalise potential markets and compete with incumbent SOEs. The eficient and clean management of ports would be the linchpin of logistics operations and the export diversiication strategy. SOEs that play central roles in maritime devel -opment, such as Pelindo, should go public. This would not only enable them to raise investment funds; it would also make them more accountable. Given that the
12. Short-sea shipping refers to coastal shipping using roll-on, roll-off vessels. The gov-ernment is encouraging active private entry into this mode of shipping, particularly in western Indonesia.
TABLE 8 Projects of the ‘Sea Toll’ Program
Projects
Investment
(Rp trillion) Notes
24 strategic ports 244 Includes land expropriation
Construction & revitalisation 67 Excludes land expropriation Belawan & Kuala Tanjung 24 International hub in North Sumatra
Surabaya 9 International hub in East Java
Palembang 7 Feeder port in South Sumatra
Jakarta 6 International hub
Other commercial ports 42 83 ports
Non-commercial ports 148 1,481 ports
Shipbuilding 102
Transport access to ports 50 Roads & railways
5 other projects 114
Total 700
Source: Compiled using information from Bappenas (2015).
OECD (2014) refocused on managing risk among SOEs in its latest peer review of its Principles of Corporate Governance, SOEs should follow a similar level of governance practices as listed companies; this is often not the case, however, since SOEs are subject to separate oversight. In Indonesia, ensuring that the SOE ministry provides effective and non-politicised oversight will be challenging. In addition, the authorities are required to identify the inancial risk of SOEs ex ante, given SOEs’ increasing demands for external funding.
HEALTH SOCIAL-SECURITY SYSTEM
Indonesia’s national social-security system receives much attention as the centre -piece of the Jokowi government’s challenging redistribution policy, even though the system was initiated in 2000 under then president Abdurrahman Wahid. On 1 January 2014, after the passing of Law 40/2004 on the National Social Security System and Law 24/2011 on the Social Security Agency, Indonesia’s health social-security system began, overseen by BPJS Kesehatan (the Health Care and Social Security Agency). While few may doubt the beneits that national health insur -ance will bring to Indonesia’s population, especially to the poor and vulnerable, after a year of its implementation the system started to expose some critical inan -cial shortcomings that may threaten its sustainability.
The health social-security system combines inancial assistance for the poor and a health-insurance scheme. It covers two broad categories of participants (table 9). Non-contributory participants are fully subsidised by the state, includ -ing the poorest and the near-poor—previously covered by Jamkesmas (the gov -ernment subsidised health-care scheme)—and some of the population covered by Jamkesda (local-government health care). Contributory participants, whether in the formal or the informal sector, must pay a monthly premium. Contributors in the formal sector include public-sector workers previously covered by state-owned insurers PT Askes or PT Jamsostek, and workers covered by private health care. Contributors in the informal sector include non-poor non-wage workers and non-poor non-workers.
Law 40/2014 on insurance makes social-security participation mandatory. The system’s implementation has been gradual, however, with informal-sector partic -ipation voluntary until January 2019. The coverage of the informal sector in 2014 was therefore very low and prompted questions about the iscal sustainability of the system. The claim ratio in the informal sector was reported to be extremely high, reaching 1,380% in August 2014 before moderating to 600% in December 2014, while it was only 88% across all other sectors.13 The problem of adverse
self-selection in informal-sector participation is evident: those at higher risk are more likely to register with the scheme.14 Many participants from the informal sector
join the scheme after being diagnosed with a chronic illness. They receive com -prehensive medical treatment and pay only a small contribution. It was therefore
13. The claim ratio is the relation between the agency’s health-services expenditure and the premiums collected by the agency.
14. An interviewee in Jakarta revealed that around 23% of participants in the informal sector had used the scheme’s beneits, compared with less than 4% of those in the formal sector and the non-contributory category.
not surprising that the Health Care and Social Security Agency was reported to have incurred a loss of Rp 2 trillion in 2014, despite having collected contribution payments of Rp 40.9 trillion (Liputan6.com, 2 May 2015).
The agency’s inancial circumstances have had iscal implications. The govern -ment set aside up to Rp 5 trillion of added iscal support for it in the revised 2015 budget, increasing health spending as a share of total public expenditure to 3.7% in 2015 (or approximately $5.7 billion). Compared with the share of total public spending allocated to education, infrastructure, and food security, health spend-ing is not a priority. With the coverage target increasspend-ing to 168 million by the end of 2015, it is very likely that the deicit will increase. Yet at only 1.2% of GDP, public-health spending in Indonesia is among the lowest in ASEAN (World Bank 2013b). From this perspective, iscal inancing of the loss incurred by the health social-security system is to some extent justiiable.
The inancial burden would shrink if participation could be expanded to healthy individuals in the informal sector. The experience of other countries in East Asia and the Paciic suggests that it is dificult to expand voluntary partici -pation in the informal sector, even if the health-care scheme provides partial sub -sidies or inancial assistance for enrolling (World Bank 2015a, 67). Higher rates of informal-sector enrolment in Thailand, China, and the Philippines come with substantial contribution subsidies. Thailand, for example, has had universal cov -erage since 2002, but the government fully subsidises contributions (WHO 2010). In Indonesia, Presidential Decree 111/2014 does not allow full subsidies to be given to the non-poor. Further, the system has never had a strategy for expanding informal-sector enrolment (Simmonds and Hort 2013) and the agency has no way of enforcing participation.
TABLE 9 Health Social-Security Coverage in Indonesia, 2014
Type of participant
The poorest and the near poor (previously covered
by Jamkesmas) 19,225 (paid by the government)
86.4
Those covered by local-government health care 7.9
Contributory
Formal sector
Public-sector workers & military police; private- sector workers & other wage workers
(dependents included for all)
5% of monthly wage, shared by employer & worker
23.7
Informal sector
Non-poor non-wage worker, non-poor non-worker (dependents included for all)
59,500 (Class I) 42,500 (Class II) 25,500 (Class III)
10.9
Total 128.9
Sources: Compiled using information from BPJS Kesehatan (the Health Care and Social Security
Agency). Coverage igures are from Bappenas (2014, table 3.17).
The agency was reported to have proposed a number of measures to contain the loss in 2015, including raising premiums in the informal sector, reducing the grace period to less than six months, and introducing a waiting period of 14 days before a new participant is eligible for beneits. It was also reported to have sug -gested raising premiums for new participants in the non-contributory category (Tempo, 4 Mar. 2015). These proposals need to be considered more carefully. Raising premiums in the informal sector would only deter healthy individuals who are already reluctant to join the scheme, while raising premiums in the non-contributory category has no justiication, given the claim ratio in that category is already manageable. Overall, the proposed changes would do little to reduce the inancial burden.
In an ironic twist, Indonesia’s health social-security system risks undermining a main focus of Jokowi’s development strategy unless it improves the distributional aspect of health facilities and practitioners, which is highly biased against dificult areas and adds to spatial inequity. If this situation persists, people in developed and accessible areas will continue to beneit more from the health social-security system than those elsewhere, depressing levels of self-enrolment in the informal sector. A lack of accessible health care reduces the value of health insurance, and hence the demand for it.
REFERENCES
Bappenas (National Development Planning Agency). 2014. Rencana Pembangunan Jangka Menengah Nasional (RPJMN) 2015–2019, buku II: Agenda pembangunan bidang [National Medium-Term Development Plan (RPJMN) 2015–2019, book II: Field development agenda]. Jakarta: Bappenas.
———. 2015. Pengembangan tol laut dalam RPJMN 2015-2019 dan implementasi 2015
[Devel-opment of the sea toll in the National Medium-Term Devel[Devel-opment Plan 2015–2019 and its implementation in 2015]. Jakarta: Bappenas.
BI (Bank Indonesia). 2015a. Statistik ekonomi dan keuangan Indonesia (SEKI) [Indonesian inancial statistics]. http://www.bi.go.id/en/statistik/seki.
———. 2015b. Tinjauan kebijakan moneter Juni 2015 [Monetary policy review, June 2015]. Jakarta: BI.
BPS (Badan Pusat Statistik). 2015. Sosialisasi kegiatan BPS: Perubahan tahun dasar PDB berba-sis SNA 2008 [Socialisation of BPS activities: Change of the GDP base year on the basis of the 2008 SNA]. Jakarta: BPS.
Burke, Paul J., and Budy P. Resosudarmo. 2012. ‘Survey of Recent Developments’. Bulletin of Indonesian Economic Studies 48 (3): 299–324.
Cribb, Robert, and Michele Ford (eds). 2009. Indonesia beyond the Water’s Edge: Managing an Archipelagic State. Singapore: Institute of Southeast Asian Studies.
Financial Services Authority. 2015. Statistik perbankan Indonesia: April 2015 [Indone-sian banking statistics: April 2015]. http://www.bi.go.id/id/statistik/perbankan/ indonesia/Documents/SPI_0415.pdf.
Lindblad, J. Thomas, and Thee Kian Wie. 2007. ‘Survey of Recent Developments’. Bulletin of Indonesian Economic Studies 43 (1): 7–33.
Ministry of Finance. 2015. ‘Realisasi anggaran pendapatan dan belanja negara’ [Realisation of the state budget]. http://www.kemenkeu.go.id/katalogdata?page=1.
Ministry of Finance, and BI (Bank Indonesia). 2015. Statistik utang luar negeri Indonesia: External Debt Statistics of Indonesia, vol. VI. May. Jakarta: Ministry of Finance and BI. Myint, Hla. 1972. Southeast Asia’s Economy: Development Policies in the 1970s. New York:
Praeger.
Natsuda, Kaoru, Kozo Otsuka, and John Thoburn. 2015. ‘Dawn of Industrialisation? The Indonesian Automotive Industry’. Bulletin of Indonesian Economic Studies 51 (1): 47–68. OECD. 2014. Risk Management and Corporate Governance. Corporate Governance. Paris:
OECD Publishing. http://dx.doi.org/10.1787/9789264208636-en.
Rasiah, Rajah. 2006. ‘Explaining Malaysia’s Export Expansion in Palm Oil and Related Products’. In Technology, Adaptation, and Exports: How Some Developing Countries Got It Right, edited by Vandana Chandra, 163–92. Washington, DC: World Bank.
Ray, David. 2009. ‘Indonesian Port Sector Reform and the 2008 Shipping Law’. In Indonesia beyond the Water’s Edge: Managing an Archipelagic State, edited by Robert Cribb and Michele Ford, 99–116. Singapore: Institute of Southeast Asian Studies.
Republic of Indonesia. 2015. ‘Peraturan Presiden Republik Indonesia nomor 2 tahun 2015 tentang Rencana Pembangunan Jangka Menengah Nasional (RPJMN) 2015–2019’ [Presidential Regulation 2/2015 on the National Medium-Term Development Plan (RPJMN) 2015–2019]. Jakarta: Republic of Indonesia.
Sanjoto, Sastromihardjo, and Norio Mihira (eds). 1990. Indonesia’s Non-oil Exports: Perfor-mance and Prospects. Tokyo: Institute of Developing Economies.
Simmonds, Amanda, and Krishna Hort. 2013. ‘Institutional Analysis of Indonesia’s Pro-posed Road Map to Universal Health Coverage’. Nossal Institute for Global Health Working Paper 33, The University of Melbourne.
Suehiro, Akira. 2008. Catch-Up Industrialization: The Trajectory and Prospects of East Asian Economies. Singapore: NUS Press.
Van der Eng, Pierre. 2005. ‘Indonesia’s New National Accounts’. Bulletin of Indonesian Eco-nomic Studies 41 (2): 243–52.
WHO (World Health Organization). 2010. Bulletin of the World Health Organization 88 (2): February: 81–160.
World Bank. 2013a. State of Logistics Indonesia 2013. Jakarta: World Bank.
———. 2013b. World Development Indicators. Washington, DC: World Bank.
———. 2015a. Adjusting to a Changing World. East Asia and Paciic Economic Update. April.
Washington, DC: World Bank.
———. 2015b. High Expectations. Indonesian Economic Quarterly. March. Jakarta: World Bank.