May 2010
Consumer Confidence Index (CCI) in May 2010 remains
optimistic, although scantly declined from 110.7 in April
2010 to 109.9. The condition was driven by lowering
consumer’s confidence of economic conditions expectation
over the next 6 months.
Prices on goods and services in the next 3 and 6 months
were predicted to rise, related to fasting month and Eid-ul
Fitr.
Consumer Confidence Index
Consumer Confidence Index in May 2010 settled at the
optimistic level, although slightly reduced from previous month.
Following the upward trend for consecutive 3 months, CCI in May 2010
stayed at the level of 109.9, trimmed down
by
0.8 point. The downward index
was predominantly triggered by lower respondent’s optimism on economic
condition, income, and job availability in the next 6 months.
Graph 1. Consumer Confidence Index
60.0
70.0
80.0
90.0
100.0
110.0
120.0
130.0
140.0
1 2 3 4 5 6 7 8 9 10 11 12 1 2 3 4 5 6 7 8 9 10 11 12 1 2 3 4 5
2008 2009 2010
(Index)
Current Economic Condition Index
Consumer Expectation Index
Consumer Confidence Index
Optimistic
Pessimistic
Fuels Hike
Global Economic
Crisis
CONSUMER SURVEY
Consumers Confidence Index
remains in optimistic area
Methodology
Consumer Survey-Bank Indonesia (CS-BI) is a monthly survey that has been conducted since October 1999. Since January
2007, the survey is done to more or less than 4,600 households as respondents
(stratified
random sampling)
in 18 cities: Jakarta,
Bandung, Semarang, Surabaya, Medan, Makassar, BandarLampung, Palembang, Banjarmasin, Padang, Pontianak, Samarinda,
Manado, Denpasar, Mataram, Pangkal Pinang, Ambon, and Banten. By significance level of 99%, the sample has sampling error of
2%. Data canvassing run through interviews by phone and direct visits in particular cities based on rotated system. Balance Score
Nonetheless, although economic conditions and inflation rates are in favors,
lower expectations on amount of deposits for 6 months ahead and pressures
on prices that seemingly increase in the next 3 and 6 months were deemed to
the declining consumer’s optimism.
Nevertheless, consumers cited that economic conditions in
current time are better than in the same period of a year ago.
This is
reflected on CCI which climbed from 105.9 in May 2009 to 109.9. The
upward index was due to respondent’s confidence on current economic
condition which substantially rose by 9.0 points.
Current Economic Condition Index
Current economic condition is moderately better over previous
month.
The Current Economic Condition Index (CECI) in May 2010 reached
the level of 100.0, gained 0.4 point from previous month. Based on the
survey, despite their current income is not as much as previous month,
consumers stated that current time is the right time to consume durable
goods. Moreover, respondents also deemed that job prospect is getting
better.
Compared to the same period in the previous year, consumers
also believed that current economic conditions are expanded as the
CECI rose 9.0 points.
The condition was due to respondent’s deeper
conviction to consume durable goods and rising job availability as the index
rose by 15.1 and 10.6 points respectively. Additionally, current income index
also climbed over the same period in the previous year.
Graph 2. Current Economic Condition Index (CECI)
0.0 20.0 40.0 60.0 80.0 100.0 120.0 140.0
1 2 3 4 5 6 7 8 9 10 11 12 1 2 3 4 5 6 7 8 9 10 11 12 1 2 3 4 5
2008 2009 2010
Index
Current Economic Conditions Index Current Incomes Buying Durable Goods Conditions Job Availability
Consumer Expectation Index
Consumer Expectation Index (CEI) in May 2010 continued to
stay at the optimistic level, although slightly slumped from the
previous month.
Weakening respondent’s optimism was reflected on
declining index by 1.9 points as respondent’s optimism on income in the next
6 months deteriorated. Furthermore, even though respondents were still
optimistic on economic condition and job prospect, the respondents’
expectation indexes were 2.7 and 1.1 points lower compared to the previous
month.
Graph. 3
Consumer Expectation Index (CEI)
0.0 20.0 40.0 60.0 80.0 100.0 120.0 140.0 160.0
1 2 3 4 5 6 7 8 9 10 11 12 1 2 3 4 5 6 7 8 9 10 11 12 1 2 3 4 5
2008 2009 2010
Index
Consumer Expectation Index Incomes Expectation
Economic Expectation Job Availability Expectation
Respondent’s expectation also was weaker than the same
period on the previous year.
The downward was seen on economic
condition expectation which dropped 7.1 points and income expectations
which lost 1.7 points. On the other side, respondents tend to be more
optimistic over job availability in the next 6 months.
Income Expectations
Consumers estimated that their income in the next 6 months
will escalate, although the optimism was lower than previous month.
The expectation measured by income expectation index remained high, i.e.
above the 100 level of 134.7. However, the index dropped 2 points over
previous month. Based on expenditures, consumers who expense more than
Rp 5 million per month envisaged most that their income will be lower.
Meanwhile, based on education background, consumers who were post
graduated also predicted an impressive decline on their income in the next 6
months.
Consumers optimism over
economic condition in the
next 6 months was modesty
lower
Price Expectations
Pressure on prices was predicted to reach its peak on 3 months
ahead.
This was reflected on price expectation index which excessive from
158.6 in April 2010 to 164.3 or touched the highest point during 19 months.
The escalating index to the top of history level due to fasting month and Eid-ul
Fitr with the highest leap was on clothing and transportation, recreation &
sport. Moreover, respondents envisaged a cornered goods availability due to
high demand on the occasion of Eid-ul Fitr celebration. This was reflected on
goods availability index which down from 138.3 for expectation in July 2010 to
134.2 for expectations in August 2010.
Graph 4.
Price Expectation Index for the next 3 and 6 months
‐1.00 0.00 1.00 2.00 3.00 4.00 5.00 6.00
130.0 140.0 150.0 160.0 170.0 180.0 190.0 200.0
1 2 3 4 5 6 7 8 9 101112 1 2 3 4 5 6 7 8 9 101112 1 2 3 4 5 6 7 8 9 1011
2008 2009 2010
Price Expectation Index 3 months ahead Price Expectation Index 6 months ahead Cummulative Inflations in 3 months
Index
Notes
: Index = 100 indicates that consumer expect prices will still be stable, index > 100 indicates
consumer expect prices will increase, and index < 100 indicates consumer expect prices will decrease
In the meantime, prices on goods/services in the next 6 months
(November 2010) was predicted to rise after decreasing for 2
consecutive months due to Eid-ul Fitr
. Clothing and food, beverages &
tobacco were the two groups which predicted would experience the highest
price hike. The index rose by 4.9 and 3.5 points respectively. Although
respondents optimism on goods availability were moved higher in November
2010, welcoming Christmas and New Year celebration prices could incite the
price on those two groups to accelerate.
Expectations of Savings and Interest Rates
Although interest rates expectation index in the next 6 months
was deemed to get higher, household saving index went down.
Interest
rates expectation index strengthened 0.9 point while amount of saving
expectation index were 2.0 points below. The down beating on amount of
Pressure on prices for the
next 3 months was
believed to reach the top
deposit index was in sequence with the lowering expectation on income for
the next 6 months, mostly by those who expense more than Rp 5 million per
month.
Graph. 5
Expectation Indexes on Interest Rates and Total Savings in the next 6 months
0 5 10 15 20 25
90 100 110 120 130 140
1 2 3 4 5 6 7 8 9 10 11 12 1 2 3 4 5 6 7 8 9 10 11 12 1 2 3 4 5 6 7 8 9 10 11
2008 2009 2010
Savings Growth in 6 months
Interest Rates Expectation Index in 6 months ahead Savings Expectation Index in 6 months ahead
Index
(%)
Notes
: Index = 100 indicates that consumer expect saving deposit and interest rate will still be
stable, index > 100 indicates consumer expect saving deposit and interest rate will increase, and
index < 100 indicates consumer expect saving deposit and interest rate will decrease
Expectations on Economic Conditions
Respondent’s expectation on economic condition in the next 6
months was still in optimistic area although it was lower than previous
month.
After expanding in 2 consecutive months, respondent’s expectation
on economic condition dropped 2.7 points to 119.5 in this reporting month.
The downward index was primarily driven by weakening expectations of those
with bachelor degree educational background.
Economic condition
Table 1. Consumer Confidence, Price Expectations, Consumption Plans, and Economic Indicators (Index)
Apr May Jun Jul Aug Sep Oct Nov Dec Jan Feb Mar Apr May
A Consumer Confidence Index (CCI) 102.5 105.9 109.1 115.4 114.3 110.8 110.0 111.0 108.7 110.5 105.3 107.4 110.7 109.9
Present Situation (CECI) 88.2 91.0 94.5 98.6 100.5 96.6 96.8 97.7 96.7 98.4 94.7 96.4 99.6 100.0
Expectations (CEI) 116.8 120.9 123.7 132.3 128.2 125.1 123.2 124.3 120.7 122.6 115.9 118.5 121.7 119.8
Appraisal of Present Situation
Current Incomes 121.1 123.2 124.2 129.5 127.5 124.0 124.9 124.1 123.1 125.5 118.6 121.7 126.1 124.4
Buying durable goods Conditions 73.0 74.5 78.0 83.7 87.6 81.3 82.2 84.9 81.1 85.2 87.3 85.3 87.5 89.6
Employment Conditions 70.5 75.3 81.2 82.5 86.3 84.5 83.2 84.1 85.8 84.5 78.0 82.1 85.3 85.9
(before Oct 2004: Unemployment Condition)
Expectations for 6 Months Hence of
Incomes 130.9 136.4 135.2 142.9 138.3 138.5 137.3 139.3 136.8 141.1 132.5 135.3 136.7 134.7
Economic Conditions 120.7 126.6 130.5 138.9 135.4 130.4 127.3 128.8 122.1 122.7 114.4 117.7 122.2 119.5
Employment Conditions 98.7 99.7 105.2 115.1 110.7 106.4 105.1 104.8 103.1 103.9 100.8 102.4 106.3 105.2
(before Oct 2004: Unemployment Expectation)
B Price Expectations for 3 Months Hence of
Prices 148.1 150.5 154.5 154.8 163.8 165.2 158.8 159.9 161.0 160.6 160.2 155.1 158.6 164.3
Foodstuff 148.1 152.0 156.5 158.2 168.2 167.0 160.8 160.6 163.0 163.5 163.4 156.0 159.6 164.2
Food, beverages, cigarettes and tobacco 144.3 147.8 151.8 151.3 161.0 161.0 154.9 155.8 157.2 156.4 155.0 149.9 153.5 156.5
Housing, electricity, gas and fuel 136.2 141.0 141.5 141.6 148.8 155.2 156.0 156.6 156.3 152.0 151.5 148.1 155.3 158.1
Clothing 130.7 134.2 139.5 142.5 152.7 150.2 138.6 139.3 138.0 135.5 136.4 131.2 133.7 142.1
Health 132.0 134.0 135.5 132.1 139.6 140.6 135.4 136.6 137.9 135.9 136.1 133.9 133.6 138.8
Transportations, communications and financial services 126.9 132.3 135.5 136.7 145.6 146.9 142.6 142.2 141.4 137.5 137.9 134.3 136.4 142.0
Education, recreation, and sports 133.3 134.8 138.4 135.3 141.1 141.3 137.3 139.0 140.0 138.0 137.2 138.2 141.4 145.9
C Price Expectations for 6 Months Hence of
Prices 152.6 154.0 154.5 152.2 156.5 156.9 156.2 157.9 158.8 161.2 164.3 161.1 159.3 162.5
Foodstuff 151.9 155.9 154.9 154.2 160.0 158.2 158.4 158.4 160.5 162.1 166.0 161.7 160.5 163.0
Food, beverages, cigarettes and tobacco 149.4 152.3 152.1 149.9 155.0 153.4 154.3 154.4 154.9 156.9 158.9 156.7 154.5 158.0
Housing, electricity, gas and fuel 143.0 144.1 144.5 142.0 148.5 150.8 154.3 155.7 155.4 153.2 153.1 148.6 154.1 157.3
Clothing 136.6 140.8 141.9 139.0 144.0 141.7 137.4 140.5 139.9 140.1 144.4 143.1 140.3 145.2
Health 135.4 137.7 136.6 132.5 139.0 140.2 136.7 138.1 138.9 140.0 140.8 136.7 137.2 139.1
Transportations, communications and financial services 133.7 138.0 138.9 136.9 143.2 143.4 143.9 142.6 143.9 142.8 145.5 143.6 144.9 147.3
Education, recreation, and sports 139.0 139.0 139.8 134.9 139.8 141.0 138.6 143.1 144.7 146.2 147.7 145.3 144.2 146.1
D Economic Indicator within 6 Months
Avaibility of Goods & Services 123.7 130.9 134.0 137.2 140.0 138.6 136.4 132.7 133.5 138.3 134.2 135.5 137.6 138.7
Interest Rate 112.3 110.6 114.2 115.8 117.7 115.2 113.3 115.4 116.3 117.9 114.9 117.0 116.2 117.1
Current savings 98.1 101.0 103.0 107.5 107.8 104.4 104.7 106.6 105.9 106.4 105.2 106.9 105.0 105.8
Savings for 6 months hence 118.8 121.0 121.6 129.9 127.6 125.0 125.9 128.2 126.7 129.8 125.6 126.2 127.0 125.0
2010
Descriptions 2009
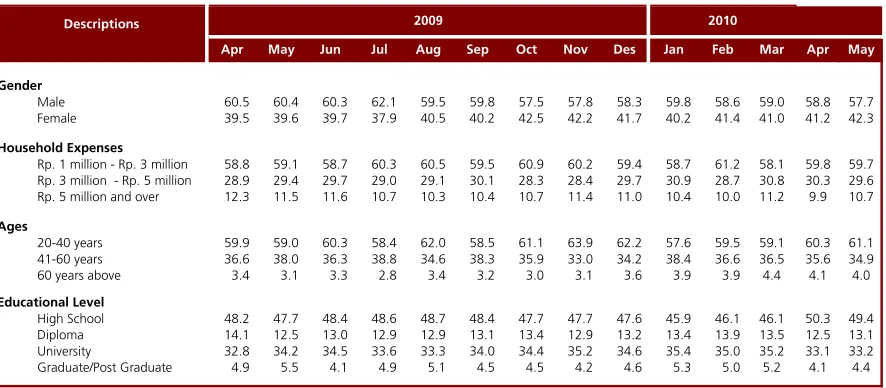
Table 2. Respondent Figures (percentages)
Apr
May
Jun
Jul
Aug
Sep
Oct
Nov
Des
Jan
Feb
Mar
Apr
May
Gender
Male
60.5
60.4
60.3
62.1
59.5
59.8
57.5
57.8
58.3
59.8
58.6
59.0
58.8
57.7
Female
39.5
39.6
39.7
37.9
40.5
40.2
42.5
42.2
41.7
40.2
41.4
41.0
41.2
42.3
Household Expenses
Rp. 1 million - Rp. 3 million
58.8
59.1
58.7
60.3
60.5
59.5
60.9
60.2
59.4
58.7
61.2
58.1
59.8
59.7
Rp. 3 million - Rp. 5 million
28.9
29.4
29.7
29.0
29.1
30.1
28.3
28.4
29.7
30.9
28.7
30.8
30.3
29.6
Rp. 5 million and over
12.3
11.5
11.6
10.7
10.3
10.4
10.7
11.4
11.0
10.4
10.0
11.2
9.9
10.7
Ages
20-40 years
59.9
59.0
60.3
58.4
62.0
58.5
61.1
63.9
62.2
57.6
59.5
59.1
60.3
61.1
41-60 years
36.6
38.0
36.3
38.8
34.6
38.3
35.9
33.0
34.2
38.4
36.6
36.5
35.6
34.9
60 years above
3.4
3.1
3.3
2.8
3.4
3.2
3.0
3.1
3.6
3.9
3.9
4.4
4.1
4.0
Educational Level
High School
48.2
47.7
48.4
48.6
48.7
48.4
47.7
47.7
47.6
45.9
46.1
46.1
50.3
49.4
Diploma
14.1
12.5
13.0
12.9
12.9
13.1
13.4
12.9
13.2
13.4
13.9
13.5
12.5
13.1
University
32.8
34.2
34.5
33.6
33.3
34.0
34.4
35.2
34.6
35.4
35.0
35.2
33.1
33.2
Graduate/Post Graduate
4.9
5.5
4.1
4.9
5.1
4.5
4.5
4.2
4.6
5.3
5.0
5.2
4.1
4.4
2010
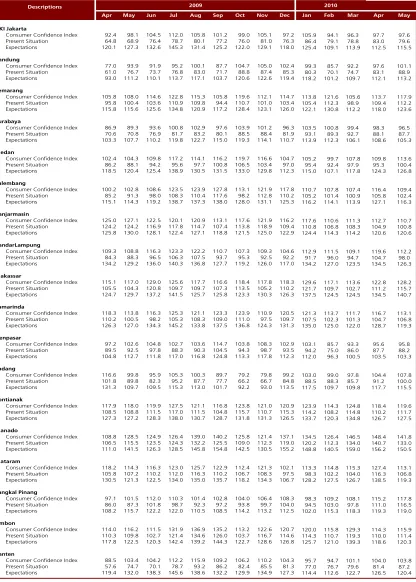
Table 3. Consumer Confidence by Region (Index)
Apr May Jun Jul Aug Sep Oct Nov Dec Jan Feb Mar Apr May
DKI Jakarta
Consumer Confidence Index 92.4 98.1 104.5 112.0 105.8 101.2 99.0 105.1 97.2 105.9 94.1 96.3 97.7 97.6
Present Situation 64.8 68.9 76.4 78.7 80.1 77.2 76.0 81.0 76.3 86.4 79.1 78.8 83.0 79.6
Expectations 120.1 127.3 132.6 145.3 131.4 125.2 122.0 129.1 118.0 125.4 109.1 113.9 112.5 115.5
Bandung
Consumer Confidence Index 77.0 93.9 91.9 95.2 100.1 87.7 104.7 105.0 102.4 99.3 85.7 92.2 97.6 101.1
Present Situation 61.0 76.7 73.7 76.8 83.0 71.7 88.8 87.4 85.3 80.3 70.1 74.7 83.1 88.9
Expectations 93.0 111.2 110.1 113.7 117.1 103.7 120.6 122.6 119.4 118.2 101.2 109.7 112.1 113.2
Semarang
Consumer Confidence Index 105.8 108.0 114.6 122.8 115.3 105.8 119.6 112.1 114.7 113.8 121.6 105.6 113.7 117.9
Present Situation 95.8 100.4 103.6 110.9 109.8 94.4 110.7 101.0 103.4 105.4 112.3 98.9 109.4 112.2
Expectations 115.8 115.6 125.6 134.8 120.9 117.2 128.4 123.1 126.0 122.1 130.8 112.2 118.0 123.6
Surabaya
Consumer Confidence Index 86.9 89.3 93.6 100.8 102.9 97.6 103.9 101.2 96.3 103.5 100.8 99.4 98.3 96.5
Present Situation 70.6 70.8 76.9 81.7 83.2 80.1 88.5 88.4 81.9 93.1 89.3 92.7 88.1 87.7
Expectations 103.3 107.7 110.2 119.8 122.7 115.0 119.3 114.1 110.7 113.9 112.3 106.1 108.6 105.3
Medan
Consumer Confidence Index 102.4 104.3 109.8 117.2 114.1 116.2 119.7 116.6 104.7 105.2 99.7 107.8 109.8 113.6
Present Situation 86.2 88.1 94.2 95.6 97.7 100.8 106.5 103.4 97.0 95.4 92.4 97.9 95.3 100.4
Expectations 118.5 120.4 125.4 138.9 130.5 131.5 133.0 129.8 112.3 115.0 107.1 117.8 124.3 126.8
Palembang
Consumer Confidence Index 100.2 102.8 108.6 123.5 123.9 127.8 113.1 121.9 117.8 110.7 107.8 107.4 116.4 109.4
Present Situation 85.2 91.3 98.0 108.3 110.4 117.6 98.2 112.8 110.2 105.2 101.4 100.9 105.8 102.4
Expectations 115.1 114.3 119.2 138.7 137.3 138.0 128.0 131.1 125.3 116.2 114.1 113.9 127.1 116.3
Banjarmasin
Consumer Confidence Index 125.0 127.1 122.5 120.1 120.9 113.1 117.6 121.9 116.2 117.6 110.6 111.3 112.7 110.7
Present Situation 124.2 124.2 116.9 117.8 114.7 107.4 113.8 118.9 109.4 110.8 106.8 108.3 104.9 100.8
Expectations 125.8 130.0 128.1 122.4 127.1 118.8 121.5 125.0 122.9 124.4 114.3 114.2 120.6 120.6
BandarLampung
Consumer Confidence Index 109.3 108.8 116.3 123.3 122.2 110.7 107.3 109.3 104.6 112.9 111.5 109.1 119.6 112.2
Present Situation 84.3 88.3 96.5 106.3 107.5 93.7 95.3 92.5 92.2 91.7 96.0 94.7 104.7 98.0
Expectations 134.2 129.2 136.0 140.3 136.8 127.7 119.2 126.0 117.0 134.2 127.0 123.5 134.5 126.3
Makassar
Consumer Confidence Index 115.1 117.0 129.0 125.6 117.7 116.6 118.4 117.8 118.3 129.6 117.1 113.6 122.8 128.2
Present Situation 105.5 104.3 120.8 109.7 109.7 107.3 113.5 105.2 110.2 121.7 109.7 102.7 111.2 115.7
Expectations 124.7 129.7 137.2 141.5 125.7 125.8 123.3 130.3 126.3 137.5 124.5 124.5 134.5 140.7
Samarinda
Consumer Confidence Index 118.3 113.8 116.3 125.3 121.1 123.3 123.9 110.9 120.5 121.3 113.7 111.7 116.7 113.1
Present Situation 110.2 100.5 98.2 105.3 108.3 109.0 111.0 97.5 109.7 107.5 102.3 101.3 104.7 106.8
Expectations 126.3 127.0 134.3 145.2 133.8 137.5 136.8 124.3 131.3 135.0 125.0 122.0 128.7 119.3
Denpasar
Consumer Confidence Index 97.2 102.6 104.8 102.7 103.6 114.7 103.8 108.3 102.9 103.1 85.7 93.3 95.6 95.8
Present Situation 89.5 92.5 97.8 88.3 90.3 104.5 94.3 98.7 93.5 94.2 75.0 86.0 87.7 88.2
Expectations 104.8 112.7 111.8 117.0 116.8 124.8 113.3 117.8 112.3 112.0 96.3 100.5 103.5 103.3
Padang
Consumer Confidence Index 116.6 99.8 95.9 105.3 100.3 89.7 79.2 79.8 99.2 103.0 99.0 97.8 104.4 107.8
Present Situation 101.8 89.8 82.3 95.2 87.7 77.7 66.2 66.7 84.8 88.5 88.3 85.7 91.2 100.0
Expectations 131.3 109.7 109.5 115.3 113.0 101.7 92.2 93.0 113.5 117.5 109.7 109.8 117.7 115.5
Pontianak
Consumer Confidence Index 117.9 118.0 119.9 127.5 121.1 116.8 123.8 121.0 120.9 123.9 114.3 124.8 118.4 119.6
Present Situation 108.5 108.8 111.5 117.0 111.5 104.8 115.7 110.7 115.3 114.2 108.2 114.8 110.2 111.7
Expectations 127.3 127.2 128.3 138.0 130.7 128.7 131.8 131.3 126.5 133.7 120.3 134.8 126.7 127.5
Manado
Consumer Confidence Index 108.8 128.5 124.9 126.4 139.0 140.2 125.8 121.4 137.1 134.5 126.4 146.5 148.4 141.8
Present Situation 106.5 115.5 123.5 124.3 132.2 125.5 109.0 112.3 119.0 120.2 112.3 134.0 140.7 133.0
Expectations 111.0 141.5 126.3 128.5 145.8 154.8 142.5 130.5 155.2 148.8 140.5 159.0 156.2 150.5
Mataram
Consumer Confidence Index 118.2 114.3 116.3 123.0 125.7 122.9 112.4 121.3 102.1 113.3 114.8 115.3 127.4 113.1
Present Situation 105.8 107.2 110.2 112.0 116.3 110.2 106.7 108.3 97.5 98.3 102.2 104.0 116.3 106.8
Expectations 130.5 121.3 122.5 134.0 135.0 135.7 118.2 134.3 106.7 128.2 127.5 126.7 138.5 119.3
Pangkal Pinang
Consumer Confidence Index 97.1 101.5 112.0 110.3 101.4 102.8 104.0 106.4 108.3 98.3 109.2 108.1 115.2 117.8
Present Situation 86.0 87.3 101.8 98.7 92.3 97.2 93.8 99.7 104.0 94.5 103.0 97.8 111.0 116.5
Expectations 108.2 115.7 122.2 122.0 110.5 108.5 114.2 113.2 112.5 102.0 115.3 118.3 119.3 119.0
Ambon
Consumer Confidence Index 114.0 116.2 111.5 131.9 136.9 135.2 113.2 122.6 120.7 120.0 115.8 129.3 114.3 115.9
Present Situation 110.3 109.8 102.7 121.4 134.6 126.0 103.7 116.7 114.6 114.3 110.7 119.3 110.0 111.4
Expectations 117.8 122.5 120.3 142.4 139.2 144.3 122.7 128.6 126.8 125.7 121.0 139.3 118.6 120.3
Banten
Consumer Confidence Index 88.5 103.4 104.2 112.2 115.9 109.2 106.2 110.2 104.3 95.7 94.7 101.1 104.0 103.8
Present Situation 57.6 74.7 70.1 78.7 93.2 86.2 82.4 85.5 81.3 77.0 76.7 79.6 81.4 87.2
Expectations 119.4 132.0 138.3 145.6 138.6 132.2 129.9 134.9 127.3 114.4 112.6 122.7 126.5 120.4
2010