UNIVERSITAS ISLAM INDONESIA FM-UII-AA-FKU-01/R0
Faculty : Industrial Technology Meeting : 9
Department : Industrial Engineering Chapter : 3
Subject Couse Code : 52213702 Total Page : 8
Subject Course Name : Computer Simulation Year : 2016
TABEL OF CONTENT 1. General Purpose ... 2 2. Expertfit ... 2 3. Global Table ... 5 3.1. Label ... 6 3.2. Flowitem bin ... 7 4. Downtime... 8
UNIVERSITAS ISLAM INDONESIA FM-UII-AA-FKU-01/R0
Faculty : Industrial Technology Meeting : 9
Department : Industrial Engineering Chapter : 3
Subject Couse Code : 52213702 Total Page : 8
Subject Course Name : Computer Simulation Year : 2016
FLEXSIM ADVANCE 1
1. General Purpose
1. Students can determine the distribution data, 2. Students understand the concept of global table, 3. Students understand the scheduling time.
2. Expertfit
Figure 1 ExpertFit Logo
ExpertFit are tools used to determine the probability distribution of the best stats automatically and accurately to represent the set of input data. Expertfit provide analysts in modeling simulations with the help of random source (ex: service time) in the absence of data.
UNIVERSITAS ISLAM INDONESIA FM-UII-AA-FKU-01/R0
Faculty : Industrial Technology Meeting : 9
Department : Industrial Engineering Chapter : 3
Subject Couse Code : 52213702 Total Page : 8
Subject Course Name : Computer Simulation Year : 2016 Here are the steps to use expertfit :
Select the Statistics menu and then select Expertfit
Figure 2. Menu Expertfit
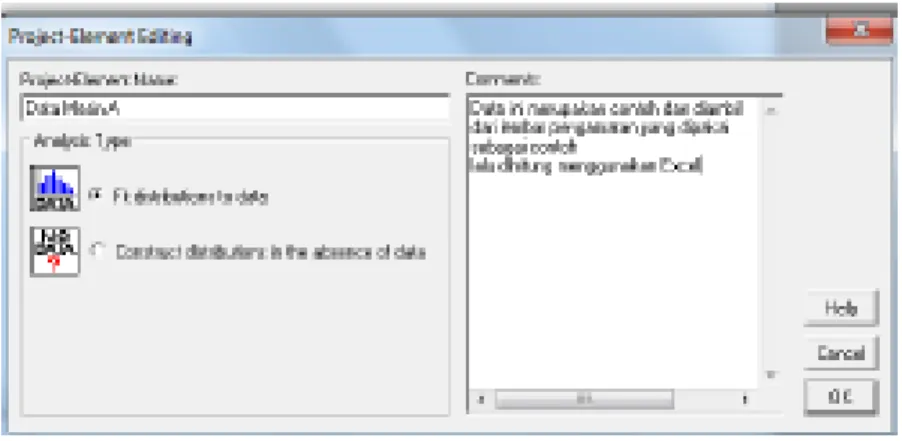
Click New. . . and select fit distributions to data. . . and then OK. So the projects you create will appear on the screen, and choose Analyze. . .
Figure 3. Element Project Editing Window
On the Data Menu click Enter Data. Next will come the Enter-Data Option box, select Enter / Edit Data Values and then click Apply
UNIVERSITAS ISLAM INDONESIA FM-UII-AA-FKU-01/R0
Faculty : Industrial Technology Meeting : 9
Department : Industrial Engineering Chapter : 3
Subject Couse Code : 52213702 Total Page : 8
Subject Course Name : Computer Simulation Year : 2016 In Single-Value Editing copy of the data to be searched distribution. Once
copied click Paste at End from Clipboard, after emerging data click OK. (Data can also be entered manually)
Figure 4. Input Data Processing Time
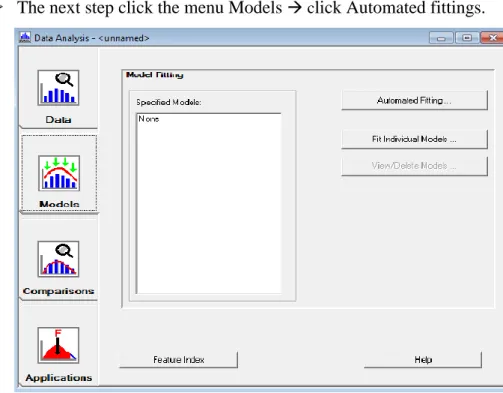
The next step click the menu Models click Automated fittings.
UNIVERSITAS ISLAM INDONESIA FM-UII-AA-FKU-01/R0
Faculty : Industrial Technology Meeting : 9
Department : Industrial Engineering Chapter : 3
Subject Couse Code : 52213702 Total Page : 8
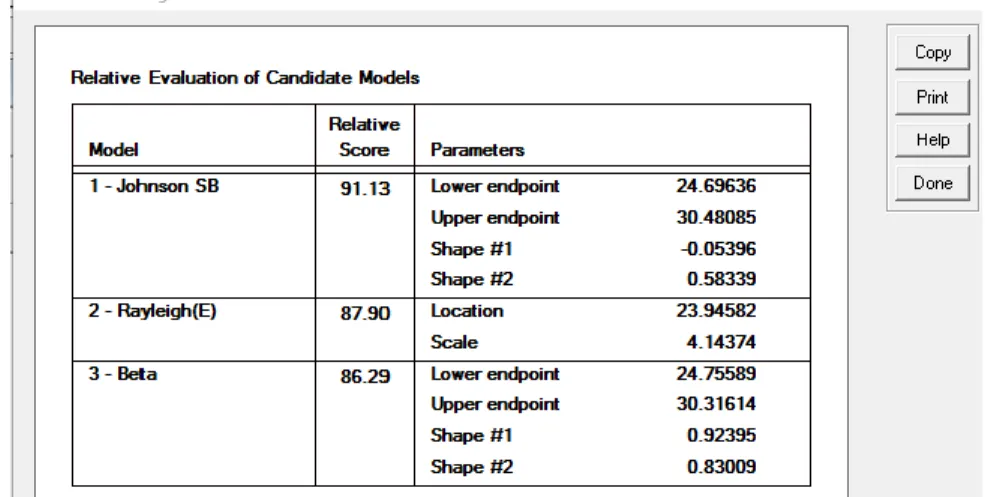
Subject Course Name : Computer Simulation Year : 2016 After completion Expertfit will get output as shown below will be used as
the Process Time.
Figure 6. Results of Input Data Distribution
Description of distribution will be entered into Flexsim through statistical distribution, and choose the best according expertfit distribution and manually input distribution
3. Global Table
This object is not dragged into model, but is defined through a special dialog box which is accessed via the toolbar. Global Table is accessible via the Tools menu. GlobalTabel can store numeric data or string. This data can be accessed by any object in the model that uses the Global Table Command :
gettablenum ( “tablename”, rownum, colnum ) settablenum ( “tablename”, rownum, colnum, value ) gettablestr ( “tablename”, rownum, colnum )
UNIVERSITAS ISLAM INDONESIA FM-UII-AA-FKU-01/R0
Faculty : Industrial Technology Meeting : 9
Department : Industrial Engineering Chapter : 3
Subject Couse Code : 52213702 Total Page : 8
Subject Course Name : Computer Simulation Year : 2016 In this tutorial global table is used to define the process or workflow of similar products with different types so that the process steps are different, but still uses the same engine. for example, there are companies producing furniture tables and chairs. In making the table after cutting and assembly directly to the process of painting and drying, while for the seat after cutting and assembly the part, and then be the installation of new foam subsequently entered into the process of painting and drying.
Figure 7. Global Table Window
3.1. Label
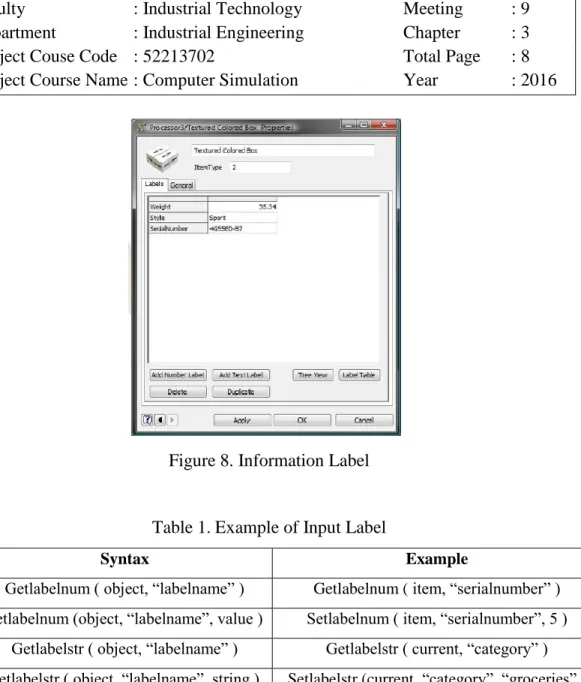
Labels that have a function to give information contained in flowitem and other model objects in the form of a label. Flowitem and other flexsim object can have an unlimited number of labels. The label has a name and data. Data can be either numerical, sting, list, or table.
UNIVERSITAS ISLAM INDONESIA FM-UII-AA-FKU-01/R0
Faculty : Industrial Technology Meeting : 9
Department : Industrial Engineering Chapter : 3
Subject Couse Code : 52213702 Total Page : 8
Subject Course Name : Computer Simulation Year : 2016
Figure 8. Information Label
Table 1. Example of Input Label
3.2. Flowitem bin
Resource loading a copy of the object in flowitem bin. Any changes to the objects in the bin affect flowitem made by resource. It is used to create a label, set the size, color, shape, and others.
Syntax Example
Getlabelnum ( object, “labelname” ) Getlabelnum ( item, “serialnumber” ) Setlabelnum (object, “labelname”, value ) Setlabelnum ( item, “serialnumber”, 5 )
Getlabelstr ( object, “labelname” ) Getlabelstr ( current, “category” ) Setlabelstr ( object, “labelname”, string ) Setlabelstr (current, “category”, “groceries” )
UNIVERSITAS ISLAM INDONESIA FM-UII-AA-FKU-01/R0
Faculty : Industrial Technology Meeting : 9
Department : Industrial Engineering Chapter : 3
Subject Couse Code : 52213702 Total Page : 8
Subject Course Name : Computer Simulation Year : 2016 4. Downtime
Downtime caused by the location of the resource or inoperable and become unfunctional although it actually can be used. Downtime can be scheduled as in shift, maintenance, or schedule for installing the machine, downtime can be scheduled as machine also not suddenly stop in production.
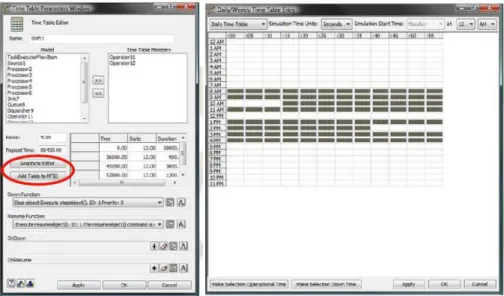
4.1. Time Table and Schedule
Time Table is accessible in the Tools menu. They are used to schedule changes in circumstances, such as the scheduling of down-time, for a particular object in the model. Every Time Table can control many objects, and each object can be controlled by many the Time Table. A model may contain a number Table Time. Each object in the model can be given a time schedule of operational and non - operational. Schedule can be set graphically or through tables. Schedule can be daily or weekly. Full block describes the time of operational and empty blocks describe the down time.
STUDI KASUS 1
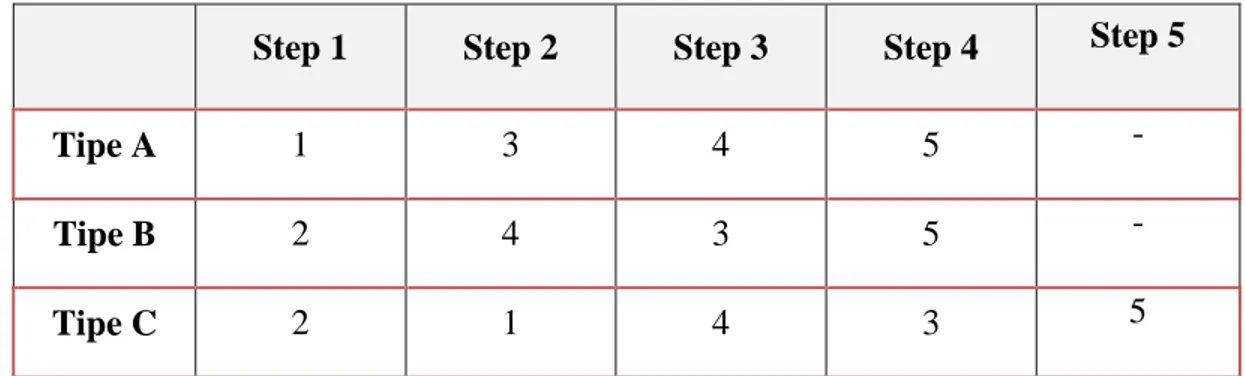
Dari lokasi penampungan, gelas akan dibawa ke proses selanjutnya. Setiap tipe mempunyai proses yang berbeda-beda. Proses tersebut adalah stiker 1 (1), stiker 2 (2), labeling (3), penghalusan (4) dan finishing (5). Setelah itu, gelas akan dibawa ke penampungan sementara. Berikut adalah rute prosesnya:
Global Table
Step 1 Step 2 Step 3 Step 4 Step 5
Tipe A 1 3 4 5 -
Tipe B 2 4 3 5 -
Tipe C 2 1 4 3 5
Dalam memindahkan flowitem yang ada, perusahan menggunakan transporter dengan kapasitas maksimum 10 item dan kecepatan 3m/s. Selain itu, dilakukan maintenance pada mesin pengecatan setiap 2 jam sekali selama 10 menit per maintenance.
Adapun data waktu untuk proses-proses diatas adalah sebagai berikut :
Tabel 1 Data waktu proses produksi
No Lokasi Waktu proses (menit) Kapasitas lokasi (unit)
No Lokasi Waktu proses (menit) Kapasitas lokasi (unit) 2 Stiker 2 1.5 1 3 Labeling 2 1 4 Penghalusan 3 1 5 Finishing Experfit 1 6 Penampungan Sementara - 1000
Table 2 Waktu proses finishing
Perusahaan menetapkan jadwal produksi dimulai jam 08.00 WIB hingga 16.00 WIB setiap hari kerja (Senin – Jumat), dan perusahaan juga memberikan kelonggaran untuk istirahat selama 1 jam pada jam 12.00 WIB untuk semua stasiun kerja.
Sebagai seorang analisis ahli, Anda diminta untuk memodelkan kasus diatas dengan menggunakan software Flexsim 6 dengan waktu simulasi selama 8 jam.
General Information : Time Units : Menit Distance Units : Meter
4 3 2 0.5 1.5 1 3 1 2.5 1 2.5 3 3 3.5 3 3 1.5 3 2 3 1.5 2 2.5 3 1 1 1 2 2 0.5
Tugas anda :
STUDI KASUS 2
Dari ruang penyimpanan sementara, proses selanjutnya adalah proses agitasi. Proses ini adalah proses pengadukan agar adonan lebih merata. Setelah melewati proses Agitasi, adonan tiap rasa akan melewati tiga proses yang berbeda-beda tergantung mekanisme dan karakteristik serta untuk mengefisiensikan proses produksi yang ada. Tiga proses tersebut adalah sterilisasi, pewarnaan dan PH Controlling 2 yang nantinya akan dibawa ke penampungan sementara. Oleh karena itu perusahaan melakukan schedulling terhadap 3 produk tersebut
Global Table
Step 1 Step 2 Step 3 Step 4
Permen Strawberry 1 (Sterilisasi) 2 (Pewarnaan) 3 (PH Controlling 2)
4
(Penampungan)
Permen Grape 2 (Pewarnaan) 3 (PH
Controlling 2) 1 (Sterilisasi)
4
(Penampungan) Permen Orange 1 (Sterilisasi) 3 (PH
Controlling 2) 2 (Pewarnaan)
4
(Penampungan)
Dalam proses pewarnaan di bantu oleh seorang operator. Waktu kerja adalah 9 jam mulai dari pukul 07.00 – 17.00 dengan waktu istirahat pukul 12.00 – 13.00. untuk menjaga kondisi mesin agar tidak cepat rusak perusahaan melakukan maintenance secara rutin pada mesin agitasi dan sterilisasi setiap 5 jam sekali dengan lama maintenance 10 menit.
Data Waktu Proses Produksi
No Lokasi Waktu proses
(second)
Kapasitas lokasi (unit)
1 Prose Agitasi Uniform(40,60,0) 60
2 Sterilisasi Normal(10,2,0) 80
3 Pewarnaan 30 1
4 Control PH 2 eksperfit 30
5 Penampungan - 1000
Waktu Proses Control PH 2
50 40 40 37 40 30 70 50 49 67 45 40 45 50 40 33 34 30 45 59 35 60 47 40 30 40 79 60 30 40
Sebagai seorang analis, Anda diminta untuk memodelkan kasus diatas dengan menggunakan software Flexsim 6 dengan waktu simulasi selama 9 jam.
General Information :
Time Units : Second Distance Units : Meter