DATA FUSION TECHNOLOGY OF MULTI-PLATFORM EARTH OBSERVATION ON
AGRICULTURE
W. Xie a
, Y. Xue b, L. Zhai a, H. Sang a
a
Chinese Academy of Surveying and Mapping, Beijing, China - (xiewh, zhailiang, huiyong.sang)@casm.ac.cn b Satellite Surveying and Mapping Application Center, SBSM, Beijing, China - [email protected]
Commission VII WGVII/6
KEY WORDS: Data Fusion, earth observation, close-range photogrammetry, SAR, LIDAR
ABSTRACT:
Earth observation is the gathering of information via remote sensing technologies supplemented by earth surveying techniques, encompassing the collection, analysis and presentation of data. Remote sensing technology is playing a key role on precision agriculture. From the point of view of remote sensing and photogrammetry field, this article first took an overview of its applications on agriculture throughout past 3 decades, analyzed the advantages and disadvantages of different kinds of remote sensing when applied on agriculture respectively, and then discussed the solution on different platform based remote sensing image and data fusion. Finally, the paper summarizes potential trends tending to broaden the precision agriculture application of remote sensing data fusion.
1. INTRODUCTION
Agriculture and food production is the world’s largest industry. The overall aim of precision agriculture is to increase crop production and productivity, and to improve food security, as well as the general promotion of economic development. Earth observation techniques provide it with information on crop types and locations and identify areas where control of the health and development of the crops is needed. Combined with other spatial data, this information is used to establish yield prediction models that prevent or minimize the effects of food crises.
Earth observation is the gathering of information about planet Earth’s physical, chemical and biological systems via Remote Sensing technologies supplemented by earth surveying techniques, encompassing the collection, analysis and presentation of data.
This paper first reviewed current techniques of earth observation (photogrammetry and remote sensing) data processing on agriculture, and analyzed the advantages and disadvantages of different kinds of remote sensing when applied on agriculture respectively. Then some of multi-platform data fusion technologies were addressed afterward for the better services on the field of precision agriculture.
2. OVERVIEW AND CURRENT SITUATION
Over the past three decades, a wide variety of remote sensing devices, ranging from earth observation satellites down to the general digital camera, have been utilized and evaluated for precision agriculture applications.
In early researches, remote sensing can be used for precision agriculture in different ways by monitoring seasonally variable crop condition (Moran et al, 1997a; Pearson et al., 1994), or by creating biomass estimates during the growing season using the traditional approach based on vegetation indices (Tucker et al, 1980), or by providing information on soil and plant condition
and variability to the overall crop management and decision support system.
Moran et al, 1997a pointed out that remote sensing data could be used to produce the meterological-parameter maps which can be integrated with the biomass maps, or Leaf Area Index (LAI) estimates, in order to predict the yield of the year. Riedell et al. (2004) introduced an effective method to detect specific insect pests and to distinguish between insect and disease damage on oat. Results showed that canopy characteristics and spectral reflectance differences between these two damages could be obtained, but these differences may not be consistent from one growing season to the next. By using multi-temporal Landsat imagery, Kurtz et al. (2009) classified land cover types and grazing intensity, which was defined based on the percentage of bare soil, sward height, etc.
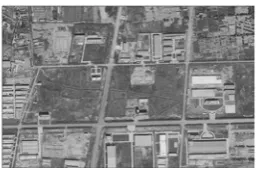
Figure 1 shows the example of change detection in crop field in the way of remote sensing images. The data acquired from Quick Bird locating some place in Shanxi Province. Figure 1a is taken on Feb. 2010, Figure 1b is taken on the same season next year. After ortho-rectification and comparison, the changing regions could be clearly detected in crop fields (see the white-color regions in figure 1c).
(a) Orthoimage on Feb. 2010
International Archives of the Photogrammetry, Remote Sensing and Spatial Information Sciences, Volume XL-7/W1, 3rd ISPRS IWIDF 2013, 20 – 22 August 2013, Antu, Jilin Province, PR China
(b) Orthoimage on Feb. 2011
(c) The result image
Figure 1. An example of change detection
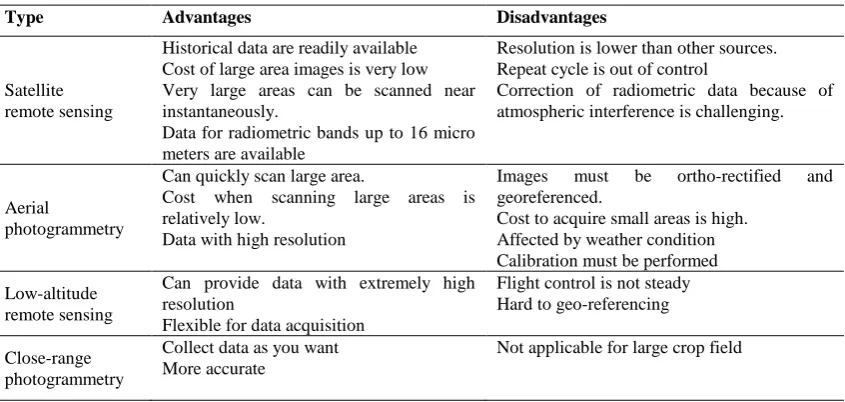
Besides the visible and near infra-red (NIR) portion, the microwave portion of the spectrum have already proven its usefulness either spaceborne platforms or airborne platforms (Moran et al, 1997b). Synthetic Aperture Radar (SAR) data can be used to estimate the near-surface soil moisture content (Dobson & Ulaby, 1986; Pultz et al, 1997), it also can provide useful information about crop and soil parameters, such as weed infestations and soil moisture, with low spatial resolution. Moreau and Toan (2003) used SAR data to quantify biomass in an Andean wetland for optimizing livestock management. Even though remote sensing technologies plays an important role in overall applications of precision agriculture, most of practices of researches are based on single source of remote sensing platform, either from satellite data, or from airborne data, or from ground-based data. There exist the significant merits and drawbacks (See table 1).
Type Advantages Disadvantages
Satellite remote sensing
Historical data are readily available Cost of large area images is very low Very large areas can be scanned near instantaneously.
Data for radiometric bands up to 16 micro meters are available
Resolution is lower than other sources. Repeat cycle is out of control
Correction of radiometric data because of atmospheric interference is challenging.
Aerial
photogrammetry
Can quickly scan large area.
Cost when scanning large areas is relatively low.
Data with high resolution
Images must be ortho-rectified and georeferenced.
Cost to acquire small areas is high. Affected by weather condition Calibration must be performed Low-altitude
remote sensing
Can provide data with extremely high resolution
Flexible for data acquisition
Flight control is not steady Hard to geo-referencing
Close-range photogrammetry
Collect data as you want More accurate
Not applicable for large crop field
Table1. Comparisons of different remote sensing platforms
This table demonstrated the necessity of data fusion from multi-source, multi-platform remote sensing system on precision agriculture.
3. IMAGE AND DATA FUSION TECHNOLOGIES
Remote sensing data fusion, as one of the most commonly used techniques, aims to integrate the information acquired with different spatial and spectral resolutions from sensors mounted on satellites, aircraft, and ground platforms, to produce fused data that contains more detailed information than each of the sources (Zhang, 2010). Due to the development of multi-view and multi-resolution earth observation systems, data fusion of satellite, aerial, and close-range images is necessary for precision agriculture and environmental monitoring application. Moreover, the cross-sensor platforms could be satellites, aircraft, UAVs, and vehicles; the surveillance range is hundreds of kilometers or some kilometers for crop field monitoring. In general, remote sensing fusion techniques can be classified into the pixel level and the high level (i.e. feature level, and
decision level) (Pohl & van Genderen 1998). The pixel level fusion is mainly applied to optical images, such as panchromatic and multispectral images (Pellemans et al. 1993; Aiazzi et al. 2007; Gangkofner et al. 2008; Amolins et al. 2007; Gamba & Chanussot 2008). The high level fusion includes multi-source data fusion, such as SAR, optical images, GIS data, LiDAR data, and in-situ survey data (Solberg et al, 1994; Zabuawala et al, 2009).
In some applications on precision agriculture and forest, plant growth model combining hyperspectral, LiDAR, SAR, and field data could be proposed to estimate plant heights, LAI dynamics, and above ground biomass (Patenaude et al, 2008). Pacheco etc. tried to fused the measurement result of LAI from ground-based data collection and hyperspectral airborne image. The corn and white beans were selected for this test. Correlations between ground eLAI and eLAI values derived from hyperspectral data produced encouraging results. Correlations were not strong when analysis was done on a single crop type. However, correlation results are good when data from all canopies are
International Archives of the Photogrammetry, Remote Sensing and Spatial Information Sciences, Volume XL-7/W1, 3rd ISPRS IWIDF 2013, 20 – 22 August 2013, Antu, Jilin Province, PR China
considered (Pacheco et al, 2001). Wang et al. (2007) proposed an effective forest boundary delineation method using both aerial images and LiDAR data. Wulder and Seemann (2003) addressed a method of forest height update through the integration of LiDAR data and Landsat images.
As the resolution of images from spaceborne, airborne or ground-based platforms ranges from coarse to fine, data fusion using those images reflects the specific properties of the individual sensors at that resolution. For satellite images, automatic high resolution satellite image geo-referencing can be implemented by fusing existing digital orthophotos derived from aerial images. Pest/disease monitoring and disaster assessment in crop field sometimes require accurate satellite images. However, this kind of application involves an accurate geo-referencing processing of the images to a given geodetic reference system. Taking advantage of existing digital orthophoto-maps derived from aerial photogrammetry, automatic high resolution satellite image geo-referencing could be implemented.
Regarding to aerial data/images and vehicle-borne/ground-based sensor data, the fusion can be applied for improved semantic mapping. Ground-based data is obtained by an all-terrain vehicle equipped with a calibrated or omni-directional camera, differential GPS, etc. This semantic information is used for local and global segmentation of an aerial image. After matching with features detected in an aerial image, the data is used as input to a region- and boundary-based segmentation algorithm for special precision agriculture applications. At the same time, most of aerial, low-altitude and ground-based images are processed by the techniques of photogrammetry. With the advantage of photogrammetry, some crop geometric parameters can be obtained from the micro-level, such as the height of the individual plant, the width of each row, the density of the crop per square meters, etc. it may be the replacement of in-situ survey.
Combining digital stereo-photogrammetry and LiDAR techniques, St-Onge et al. (2008) generated hybrid photo-LiDAR canopy height models for effective canopy height mapping.
This paper integrated a stereo close-range photogrammetry method for the field survey of crop field. Several pairs of images are taken by a handy digital camera at the rural area, Heilongjiang Province, China on July 2012. After a series of processing, such as camera calibration, image orientation, the fundamental geometric parameters can be calculated precisely. For the accuracy assessment, in this test a tape was placed for measurement with the same purpose. In figure 2, the planting interval of rice was about 26cm for both two ways (close-range photogrammetry and manual tape measurement), and in figure 3 the height of soybean is around 80cm or so.
(a) Left image (b) Right image Figure 2. Original stereo images of rice
(a) Left image (b) Right image Figure 3. Original stereo images of soybean
4. CONCLUSIONS
Remote Sensing technology has become a key component of precision agriculture and is being used by an increasing number of researchers, engineers and scientists. This paper mainly focused on the necessity of remote sensing image and data fusion on precision agriculture. Due to the fast development of various sensor technologies, it won’t be easy to develop effective methods for automatic fusion and interpretation of the multi-platform remote sensing data.
Recently more new methods, such as knowledge representation, classifier combination etc., have been investigated for the application of precision agriculture. The fusion of SAR and optical imagery increased the possibility to make the signal sensitivity corresponding to biomass variation high enough to facilitate high accuracy biomass mapping. The fusion of different sensors e.g., wireless sensor network and satellite, is also expected to be widely used for quantitative modeling and inversion of the biophysical parameters, ecological modeling, and so on.
ACKNOWLEDGEMENTS
This paper was funded by the projects of China National Science Foundation (NSF) under contract number NSF 41001299, and NSF 41271395.
It was also funded by National key technology R&D program, MOST of China (2012BAH28B01).
REFERENCES
Aiazzi, B., Baronti, S. and Selva, M. 2007. Improving Component Substitution Pansharpening Through Multivariate Regression of MS+Pan Data. IEEE Transactions on Geoscience and Remote Sensing, 45 (10), pp. 3230–3239.
Amolins, K., Zhang, Y., Dare, P., 2007. Wavelet based image fusion techniques — An introduction, review and comparison. ISPRS Journal of Photogrammetry & Remote Sensing, 62, pp. 249–263
Dobson, M.C. and F.T. Ulaby. 1986. Active Microwave Soil Moisture Research, IEEE Trans. Geo. Remote Sens. GE-24(1), pp. 23-36.
Gamba, P. and Chanussot, J., 2008. Guest Editorial Foreword to the Special Issue on Data Fusion. IEEE Transactions on Geoscience and Remote Sensing, 46 (5), pp. 1283–1288. Gangkofner, U.G., Pradhan, P.S., and Holcomb, D.W., 2008.
Optimizing the High-pass filter addition technique for image fusion. Photogrammetric Engineering and Remote Sensing, 74 (9), pp. 1107–1118
Moran, M.S., A. Vidal, D. Troufleau, Y. Inoue and T. Mitchell. 1997a. Combining Multi-frequency Microwave and Optical
International Archives of the Photogrammetry, Remote Sensing and Spatial Information Sciences, Volume XL-7/W1, 3rd ISPRS IWIDF 2013, 20 – 22 August 2013, Antu, Jilin Province, PR China
Data for Farm Management, Remote Sens. Environ. 61, pp. 96-109.
Moran, M.S., Y. Inoue and E.M. Barnes. 1997b. "Opportunities and Limitations for Image-Based Remote Sensing in Precision Crop Management", Remote Sens. Env., 61, pp. 319-346.
Patenaude, G., Milne, R., Van Oijen, M., Rowland, C.S., and Hill, R.A., 2008. Integrating remote sensing datasets into ecological modelling: a Bayesian approach. International Journal of Remote Sensing, 29 (5), pp. 1295–1315. Pearson, R., J. Grace and G. May. 1994. Real-Time Airborne Agricultural Monitoring, Remote Sens. Env., 49: pp. 304-310. Pellemans, A.H.J.M., Jordans, R.W.L., and Allewijn, R., 1993.
Merge Multispectral and Panchromatic SPOT Images with respect to the Radiometric Properties of Sensor. Photogrammetric Engineering and Remote Sensing, 59 (1), pp. 81–87.
Pohl, C. and van Genderen, J.L., 1998. Multisensor image fusion in remote sensing: concepts, methods and applications. International Journal of Remote Sensing, 19 (5), 823–854.
Pultz, T.J., J.Sokol, Brisco, B., R.J. Brown , and Q.H. J. Gwyn. 1997. Soil Moisture Estimation with Radarsat, The European Symposium on Aerospace Remote Sensing, September 22-26, London, England.
Solberg, A.H.S., Jain, A.K., and Taxt, T., 1994. Multisource Classification of Remotely Sensed Data: Fusion of Landsat TM and SAR Images. IEEE Transactions on Geoscience and Remote Sensing, 32, pp. 768–778.
St-Onge, B., Vega, C., Fournier, R.A., and Hu, Y., 2008. Mapping canopy height using a combination of digital stereo-photogrammetry and LiDAR. International Journal of Remote Sensing, 29 (11), pp. 3343–3364.
Tucker, C.J., B.N. Holben, J.H. Elgin, and J.E. McMurtrey. 1980. Relationship of Spectral Data to Grain Yield Variations, Photogramm. Eng. Remote Sens. 46: pp. 657-666.
Wang, Z.Y., Boesch, R., and Ginzler, C., 2007. Arial images and LIDAR fusion applied in forest boundary detection. Proceedings of the 7th WSEAS International Conference on Signal, Speech and Image Processing. Beijing, China, pp. 130–135.
Wulder, M.A. and Seemann, D., 2003. Forest inventory height update through the integration of LiDAR data with segmented Landsat. Canadian Journal Remote Sensing, 29, pp. 536–543.
Zabuawala, S., Nguyen, H., Wei, H., and Yadegar, J., 2009. Fusion of LIDAR and aerial imagery for accurate building footprint extraction. Image Processing. Machine Vision Applications II, 7251, 72510Z-72510Z-11.
Zhang, J., 2010. Multi-source remote sensing data fusion: status and trends. International Journal of Image and Data Fusion,Vol.1,No. 1. March 2010, pp. 5–24.
International Archives of the Photogrammetry, Remote Sensing and Spatial Information Sciences, Volume XL-7/W1, 3rd ISPRS IWIDF 2013, 20 – 22 August 2013, Antu, Jilin Province, PR China