INTEGRATED TECHNOLOGIES FOR SURVEYING ARTEFACTS DAMAGED BY
EARTHQUAKES.
APPLICATION OF ALL-IN-ONE LIDAR TECHNIQUES IN THE CITY OF L’AQUILA
P. Clini a, *, R. Quattrini a, F. Fiori a, R. Nespeca a
a DICEA, Dept. of Civil and Building Engineering, and Architecture, Polytechnic University of Marche, Ancona, Italy -
(p.clini, r.quattrini, r.nespeca)@univpm.it, [email protected]
KEY WORDS: Laser scanner, Architectural survey, earthquake, Cultural heritage, Documentation
ABSTRACT:
The purpose of this work is to demonstrate how, in post-earthquake intervention scenarios, the latest "all-in-one" laser technologies employed beyond their usual applications and integrated in more traditional survey methods, can define a comprehensive and original approach method in response to surveying issues, safety of the artefacts, speed and low cost of surveys, quality of data and of the models provided for damage assessments and any required action. The case study of L'Aquila is therefore significant. The red area has essentially two types of buildings: monuments and historical buildings characterised by compact urban centres. Here we document the convent of the Blessed Antonia and the Antenucci Block, as case studies and synthesis of the two types and ideal laboratories to test the chosen method. In the first case, we document the project on a building that is yet to be secured and that therefore presents delicate issues in terms of survey speed and completeness, also in relation to the precious decorations that it holds. In the other case, we document the survey of the typical block in Aquila, already secured which, given the size and complexity, requires an integrated approach, more complex and more time-consuming of methods of analysis.
* Corresponding author. This is useful to know for communication with the appropriate person in cases with more than one author. 1. INTRODUCTION
There is no doubt that the LIDAR method is the elective detection technology in post-earthquake scenarios: from geology and geophysics (Gold, 2012) to the structural analysis of buildings (Mosalam, 2013), to the study and definition of ornaments (Wittich , 2012). The extensive literature in the field of architectural survey (Vassena et al., 2007; Verdiani, 2007; Bini et al., 2006), was complemented by recent case studies carried out in emergency situations. In particular we refer to the recent earthquake in Emila Romagna (Balzani et al., 2013; Bonali et al. , 2013) and the violent earthquake which involved the territory of L'Aquila in April 2009, to which this article refers.
The state of the art demonstrates the completeness and potentialities of the LIDAR approach.
The purpose of this work is to define an original integrated architectural survey methodology applicable to historic town centres hit by earthquakes and which mainly exploits the potential related to integrated LIDAR acquisitions, topographic and photographic data in a single instrument and setting phase (all-in-one approach). The study aims to prove to what extent this approach, in the documented case studies, can be exhaustive and under what conditions this approach actually requires further integration of methods.
The red area of L'Aquila has essentially two types of buildings: monuments (churches, monasteries, public buildings) and historical buildings typical of compact urban centres. Here we document the monastery of the Blessed Antonia and the Antenucci Block, as case studies representing both types (figure 1). In the first case, we are dealing with a building of modest size, but of great historical and architectural value; there are no safety measures in place and we find a lack of accurate instrumental surveying. In the second case, we faced a block
that is typical of L'Aquila: compact, large, with a very high degree of damage and "covered" (inside and out) with the typical propping system used in the historical town centre that makes instrumental approach inaccessible, and anyway totally inadequate, just as a direct approach would be. We are, at least in the case of L'Aquila, in front of two cases that are undoubtedly representative of the post-seismic conditions of the historic city in Abruzzo.
In order to try out the all-in-one approach, showing its potential and researching its effectiveness up to its limits, defining the boundaries within which this approach is found to be valid and comprehensive, two different laser instruments were selected. As for the monastery, a Leica C10 terrestrial laser scanner was used, which offers the possibility to scan 50,000 points per second, a maximum range of 300 m, a resolution of up to one millimetre and instrumental accuracy of 6 mm at 50 m, and the possibility of creating polygonal traverses directly on the instrument itself. The presence of a camera with integrated high resolution in the acquisition system allows you to make full-dome scans taken with a single 1920 to 1920 pixels shot, while the exportable equirectangulars automatically have reduced dimensions of 8192 by 4096 pixels.
In the case of the block we selected a different instrument, Focus3D, with speed of 1 million of points per second, a maximum range of 120 m, a accuracy of 6 mm at 10 m and an integrated camera for high resolution full-dome scans.
The choices were dictated by the different needs of the two artefacts: one of higher quality, suitable for frescoes and decorations, and the need to sample closer details, and whose structure allowed to complete the setting phase with the laser alone and the other that required greater solidity of the exterior, thus an integration with topographical data, and whose complexity required the application of direct importance for the interior.
2. CASE STUDIES
Figure 1. L’Aquila’s historic town centre and the location of the two case studies.
The first case study that will be discussed is the Beata Antonia’s monastery in L’Aquila (figure 2).
Located near the historic town centre, the monastery preserves its historical architecture. It consists of four oblong buildings that surround the central cloister. The north wing was demolished in 1941 and the reconstruction has no architectural value, while the fourteenth century wings to the east and west have been preserved and the fifteenth century south wing houses the church and the choir. The interior is divided into two distinct areas, one reserved for the nuns and the other for the faithful. The partition wall, above the altar, shows frescoes by Paolo Cardone dating back to 1586. The entirely frescoed choir, however, consists of ninety-seven stalls, the work of Milanese artists of the early sixteenth century. After the earthquake of L’Aquila, a damage evaluation and survey report was prepared by the deputy director for the Protezione Civile, denouncing an alarming situation and the presence of severe damages that were close to causing a collapse of the facade and the vaults of the choir and church.
Figure 2. Overview of the choir of the Beata Antonia’s monastery, shot using a Leica C10 laser scanner.
The second case study is a residential built-up area that is typical of the historical building fabric. Located in the historic town centre of L’Aquila, between Via Dragonetti, Via Rosso Guelfaglione, Via Santa Giusta and Via Cimino, the city block is in the so-called “red zone”, which suffered the brunt of the damage and is still off-limits to the public. The building is characterised by a high volumetric complexity. Its considerable size is divided into several and unconnected housing units. The buildings are not adjoining, but have two internal courtyards and four stairwells that vertically connect the units.
Following the earthquake, the building suffered countless stability issues of varying degrees. Some recently refurbished parts showed deformation mainly concentrated on the outside walls, while more deteriorated parts showed structural damage to weight-bearing walls and joisted floors.
The element that was most damaged was the roof terrace located on the north-western edge of the complex and which was
demolished to avoid its imminent collapse. The exterior situation showed an inaccessibility due to temporary scaffolding to allow safety work and difficulties in using instruments (photogrammetry and scanners) due to restricted workspace in the surrounding roads. Access to the interior was greatly hampered by the temporary scaffolding put up to allow safety work or even not allowed near the areas that had collapsed (figure 3).
Figure 3. Photograph of a portion of the main facade and the invasive scaffolding put up to allow safety work on the side elevation (left). Photograph of an interior room in which part of
the small roof vaults collapsed (right).
3. OPERATIONAL PHASES
The first case study shows that it is possible, in light of a multiplicity of data acquired, to extract different outputs that, using a traditional approach, would require several instruments for data acquisition and complex data processing in a laboratory. Databases, that are scalable and can be filtered, as necessary, are created.
Following the acquisition and processing of data (alignment, cleaning and decimation), according to standard procedures, focus was placed on the interaction between point cloud and full dome images resulting in a solid image (Bornaz, 2005). It allows the creation of virtual scenarios, ensuring measurability and immersivity and acts as the basis for the creation of a three-dimensional model.
Photographs can also be used to create virtual tours in open source environments and implement various modelling methods that exploit photogrammetry. Standard drawings and a 3D model in a CAD environment can be extracted from clouds. The city block, though, is particularly symbolic due to the integration of various instruments during the data acquisition phase. The safety work already completed made it possible to operate without urgency, but significantly hindered the on-site acquisition of data.
The characteristics of the building made it necessary to use a laser scanner for the acquisition of the outer casing, stiffened by an external polygonal traverse. This was jointed to the measurement of the interior that was better suited to a use of the direct method. To complete the information, monoscopic and spherical photogrammetry were used.
Thanks to the integration of these methods, the quantity and quality of the data acquired were sufficient to satisfy all the requirements related to the representation and knowledge of the building artefact.
BEATA ANTONIA’S MONASTERY
CITY BLOCK ANTENUCCI
3.1 Acquisition
In the case of the monastery, the acquisition phase saw, first and foremost, the study of the scanning workstations so that all the spaces that could be reached would be covered. It was decided to carry out free scans, as shown in the plans (figure 4). The scanning resolution setup was 1cm to 10 m. The expected density of the point cloud is capable of describing the artefact and its state of damage (figure 14).
The decision not to use targets was imposed by the need to operate on a tight schedule given the absence of safety measures and poor lighting conditions. The opportunity to perform laser scans before the implementation of safety measures allowed a rapid and complete acquisition of data, which would otherwise have been compromised. The expediency with which scans were performed proved essential both in terms of the conditions of risk in which operations were carried out and in consideration of the fact that acquisitions did not limit themselves to geometric information, but also quantitative and qualitative data regarding the instability of masonry and the damaged state of the frescoes.
The plurality of alignment methods, through the use of targets, for morphology, inverse intersection or by the creation of traverses, ensure the operator that the scans are managed properly following ad hoc design of the campaign capturing phase. Having an instrument, therefore, that is able to ensure scalability of data together with measurement accuracy, colour quality, versatility and speed in data capturing and output realisation phases, allows the subsequent integration of photogrammetric and laser scanner measuring techniques (Nex et al., 2011).
Figure 4. Positions of the stations and the number of points captured for the Beata Antonia’s monastery.
The extension and complexity of the Antenucci city block required a preparatory phase in which previous land registry drawings and surveys were collected. We then proceeded to the organisation and division of the housing units and subsequent numbering of the rooms (figure 5). The various unconnected buildings led to excluding the possibility of creating an interior polygonal traverse, which would have been hindered by the presence of invasive scaffolding for safety work, split-level floors and inaccessibility due to collapsed areas. During the first on-site survey, the congruence between the land registry drawings and the actual situation was examined, noting any major changes, in order to facilitate the subsequent traditional survey, which took the operators several days.
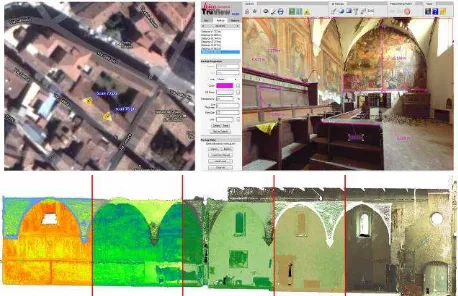
The survey of the exterior is the result of successful integration of survey plans, photogrammetry and laser scans. Having created the exterior polygonal traverse, geo-referenced to control points, and acquired some vertices on the facades. 17 full dome scans were carried out, inserting b/w targets, with particular attention to verifying the completeness of data.
Also in this case the scanning resolution setup was 1cm to 10 m. The photographs of the destroyed roof terrace allowed the reconstruction of the situation before the collapse and the spherical panoramas, obtained by laser and an exterior photographic apparatus, constituted metric and visual supports which were very important during the restitution phase because they compensate for the identifiability of the elements and shadows of the point cloud (figure 6).
Figure 5. Organisation and division of the city block’s housing units and the subsequent numbering of rooms.
Figure 6. Equirectangulars images arising from spherical panoramas of the exterior of the city block.
3.2 Data processing and management
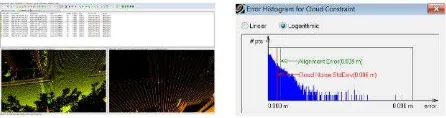
The next phase of data processing was the cleaning of the individual scans and the elimination of unnecessary points. In the case of the monastery, scan registration occurred through cloud to cloud alignment, obtained by an iterative software process following identification by the operator of at least three homologous points between two stations. The resulting error in alignment is 9 mm (figure 7).
Figure 7. Morphology scan alignment by Cyclone Register and the graph which shows the alignment error.
The multiplicity of acquisitions of the city block required a more complex alignment phase, in which the different inputs were meant to constitute a single reference system. The topography served as a major support to both the laser scans and photogrammetric measurements. The control points file was inserted in the scan alignment software (Scene) to impose the spatial coordinates of the scanned b/w targets. The same occurred for photogrammetric orientation.
3.3 Outputs
Despite the different techniques of data acquisition and the subsequent processing required, the two case studies find common ground in the outputs available, in accordance with the principle of scalability and adaptability of data introduced at the beginning of this study.
The mapped and aligned point clouds themselves represent a very important and versatile container of uncorrupted data (Bianchini et al., 2011).
In software environments such as TruView, spherical browsing in virtual tour mode is enriched by the cloud’s metric information, offering a platform that is directed both at professionals in the field and laymen. In this environment, the user is immersed in an enhanced reality and is able to perceive and interact with the surrounding space in a way that would not be possible in the real world.
In addition, the same solid image, in which each of the image’s pixels is associated to the spatial coordinates of the corresponding point in the cloud, can become the subject of a survey of the points, similarly to what happens in spherical photogrammetry. Measurement data can be extracted from the dense model, but also photographic data for highly evocative applications, even though they may be low-cost.
The dissemination of data is also expected in open source user side proprietary applications that automatically generate html files. Reflectance maps constitute another useful output which does not require modelling of the data acquired. The acquisition point possesses the spatial coordinates, the RGB data and the reflectance value, that distinguishes the state of the material and its type. It is a valuable source for investigations regarding restorations, such as the diagnosis of degraded surfaces or the analysis of textural characteristics of materials (Ippolito et al., 2011).
In this work the laser beam of the scanner used has a wavelength in the visible spectrum equal to 532 nm.
More reflectance maps were generated by varying the display parameters (figure 8). Their comparison has allowed us to identify changes in the color and in the surface roughness, which show the presence of damage to the surface, otherwise not visible. This first analysis can guide subsequent investigations more specific.
Figure 8. TruView platform built using Cyclone software (above). Composition of reflectance maps (below) (software:
Cyclone).
The full dome panoramas, available directly from the laser scanner, offer a wide range of options to complement the standard drawings.
The Leica instrument allows automatic exporting through a web publishing procedure from which to obtain cubics, albeit at a reduced resolution. To make the most of the details of individual photographs, it was necessary to export them one by one and, as a consequence, manually manage the stitching process. Once a satisfactory result was obtained, it was possible to automate the process. The resolution of the equirectangular created was five times greater than the one automatically
generated, as well as having the advantage of being able to significantly reduce the time spent on-site during the acquisition phase thanks to the use of a single instrument.
The detail in these images is of a high quality, therefore browsing them in interactive formats represents a useful tool both for structural engineers in the identification of the level of damage and for those responsible for restoring the decorative compositions.
Enriched by information and investigations, they allow the creation of web-based architecture in which the user moves through architectural spaces using hotspots that connect one panorama to the other on a path on which, as well as having the perception of the surrounding space, a metadata base is available. Documentation and communication of cultural heritage in open source environments are ideally suited to these tools (figure 9).
These same outputs represent a formidable knowledge base of use to operators and technicians in their work, as was the case for the Antenucci city block. In that instance, the Focus3D instrument allows the equirectangulare images extrapolation to be carried out quite easily, although not high quality.
Figure 9. Browsing using spherical panoramas and screenshots of the web-based virtual tour created for the exploration of the areas and the consultation of additional metadata (software:
Pano2VR, Tourweaver).
The two-dimensional profiles of the main directions for the creation of standard drawings were extracted from the point cloud. The plans generated ensured highly accurate measurements and an appropriately controlled use of the point cloud allowed instant feedback on the elements represented so as to facilitate the operator’s work.
In the same way, there was the creation of longitudinal and transversal sections whose precision allowed a detailed assessment of the deformation and mechanisms of any damage. Thanks to the high density of the point cloud, analyses and assessments that would otherwise require specific investigations were possible. In addition, evolutions in software allowed easy 3D object modelling, managing the point cloud in the CAD environment, which had been very difficult until that moment. Upon completion of the standard drawings, orthophoto were extrapolated and which, due to their simplicity and immediacy, made excellent supports for the restitution of even complex fronts.
In the case of the monastery, the point cloud managed in this way ensured the completeness of the two-dimensional and 3D drawings (figures 10-11).
While for the city block, this represented the initial restitution phase of the traditional interior survey. By connecting through openings or exterior coordinate points, the housing units surveyed individually were linked to the exterior perimeter so as to reconstitute the unit volume (figure 12).
The spread of the error was therefore mitigated and only reflected in the individual units (figure 13).
Figure 10. 2D drawings: planimetry and comparison with the previous traditional survey (above) (software: Cloudworks, Autocad). Sections and assessment of deformations (below)
(software: Cloudworks, Autocad).
Figure 11. 3D models: three-dimensional wireframe model obtained by modelling on the point cloud in the CAD
environment (software: Cloudworks, Autocad).
Figure 12. From the discrete model. Extrapolation of orthophoto for the restitution of 2D drawings and sllices for the
assembly of the direct interior survey (software: Scene).
Figure 13. 2D drawings: planimetric comparison with the previous traditional survey (software: Autocad).
Another task was the creation of a high-definition three-dimensional mathematical model. This is a rather complex, but very useful procedure on which there is extensive literature (Battini, 2009). The point cloud is destined for processing which will mostly be automated by software, though still
controlled by an operator, including a filtering stage for noise reduction and decimation that ensures that the file is easy to manage. The high number of acquired points generated a particularly dense mesh that perfectly describes the modelled elements, so as to be an invaluable tool for restoration. An example of its application is a map with contour lines on the wall in order to detect vertical deformation (figure 14).
Figure 14. 3D models: mathematical model with mesh surfaces of a wall and the vaults. Map with contour lines that describe
the deformations in the wall (software: Geomagic).
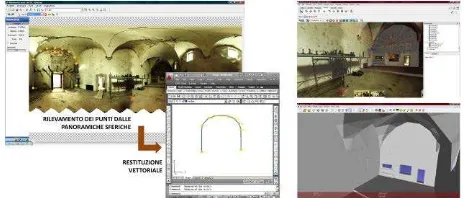
The photographic outputs described above are not used exclusively for the purpose of documentation, but the established photogrammetric research, carried out over the years by our group, has demonstrated the easy and fast use of spherical panoramas and their high accuracy of metric content (Barazzetti et al., 2010). Using proprietary software we were able to obtain three-dimensional vector restitution in the CAD environment through the detection of homologous points, following the orientation of views. The high resolution of the images allowed improved identification of radiometric discontinuities and, therefore, the corresponding geometric discontinuities, ensuring a metric accuracy estimated to the centimetre (D’Annibale et al.,2011).
Other similar software allow the management of panoramas and the creation of 3D models which are less precise, but faster, as in the case of Image Modeler. Geometries become inevitably more simplified and the projection of the image onto the solids generated is very powerful, which finds good use in dissemination. The advantages offered regard the simplicity and speed of realisation and the direct correspondence between photographs and models, but at the expense of metric accuracy and the meshing of curved surfaces (figure 15).
Figure 15. 3D models: extrapolation of spherical panorama vertices by spherical photogrammetry (right) and modelling using image modeler (left) (software: Create Point, Crea,
Sphera, Image Modeler).
Another advantageous starting point for the restitution of three-dimensional models is the solid image. There is commercially
available software that allows the operator working on the image to automatically obtain vectors and segments in a CAD environment. This tool allows better management of the point cloud and excellent recognition of the geometries on a high definition image, as is the case with photogrammetry.
4. CONCLUSIONS
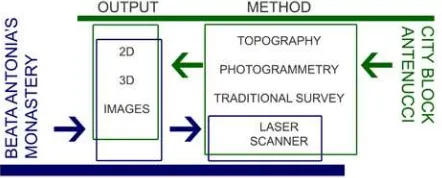
The work carried out demonstrates how, when dealing with particular conditions such as those of the Monastery of Blessed Antonia, the use of a single instrument with special features such as the one we used (Leica C10 all-in-one) is able to respond fully to all the demands of speed, data quality, completeness of the models produced in relation to the safety of the artefact and its recovery (figure 16). All this without using total stations, photo cameras or other equipment and methods that would have extended times, increased costs, required specialised personnel and decreased the intrinsic quality of your final figure resulting from a total integration of LIDAR, photographic and topographic data. In this specific case it is also shown that the photographic data of the laser allow you to make photogrammetric surveys and implement virtual scenarios of documentation to support the knowledge and restoration with quality and accuracy comparable to traditional tools. We have also shown that, through the method we have implemented, it is possible to amend the limits of the photographic acquisitions of the inner chamber by exploiting the maximum scanning resolution. Despite the different requirements, the acquisitions we made fully meet the current needs, but also any further hypothetical demand, proving an adequate knowledge and documentation of the site, whether it is of artistic and historical importance or whether it is a private building. These data, at later times, can then be filtered and scaled according to the different needs of documentation, representation, project of conservation and restoration, communication and museum display.
Figure 16. Methodological workflow of the two case studies.
5. REFERENCES References from Other Literature
Barazzetti, L., Fangi, G., Remondino, F., Scaioni, M., 2010. Automation in Multi-Image Spherical Photogrammetry for 3D Architectural Reconstructions. In: The 11th International Symposium on Virtual Reality, Archaeology and Cultural Heritage VAST -2010. A. Artusi, M. Joly-Parvex, G. Lucet, A. Ribes, and D. Pitzalis (Editors), pp. 75-81.
Battini C., 2009. 3D Web Survey: a new system to manage and view archaeological data., in Proceedings of the 14th International Congress Cultural Heritage and New Technologies, pp. 273-281.
Bornaz, L., 2005. A solution to manage terrestrial laser scanner point clouds and solid images. In: International Workshop on Recording, Modeling and Visualization of Cultural Heritage. Centro S. Franscini Monte Verità Ascona, Suisse, pp. 479-484.
D’Annibale, Piermattei L., Fangi G., 2011. Spherical photogrammetry as emergency photogrammetry. In XXIIIrd International CIPA Symposium, Prague, Czech Republic.
Ippolito, A., Bianchini, C., Borgogni, F., Senatore, L. J., 2011. Il colore digitale per la caratterizzazione del rilievo archeologico, in Atti del convegno VII Conferenza Nazionale del Colore, Roma.
References from Books
Bianchini, C., Senatore, L.J., 2007. Metodi speditivi per la visualizzazione ed esplorazione interattiva di nuvole di punti. In: Metodologie integrate per il rilievo, il disegno, la modellazione dell’architettura e della città, Ricerca PRIN, ROMA: Gangemi Editore, pp. 53-57.
Bini, M., Verdiani, G., 2006. Il rilievo delle archeologie monumentali: esperienze del laboratorio di rilievo della Sezione Architettura e Disegno di Firenze. In: Laser Scanner e GPS, paesaggi archeologici e tecnologie digitali, Ed. all'insegna del Giglio, pp. 107-115.
Verdiani, G., 2007. Tecnologie laser scanner per il rilievo digitale: alcune note, in Nuove immagini di Monumenti Fiorentini, rilievi con tecnologia laserscan 3D, a cura di Marco Bini e Carlo Battini, Alinea, Firenze, pp. 32-35.
Wittich, C. E., Hutchinson, T. C., Wood, R. L., Kuester, F., 2012. A methodology for integrative documentation and characterization of culturally important statues to support seismic analysis. In Progress in Cultural Heritage Preservation, Lecture Notes in Computer Science, Volume 7616, 2012, pp 825-832.
References from Journals
Bonali, E., Pesci, A., Casula, G., Boschi, E., 2013. Deformation of Ancient Buildings inferred by Terrestrial Laser Scanning methodology: the Cantalovo church case study (Northern Italy). In Archaeometry. DOI: 10.1111/arcm.12028.
Gold, P.O., Cowgill, E., Kreylos, O., Gold, R.D., 2012. A terrestrial lidar-based workflow for determining three-dimensional slip vectors and associated uncertainties. In Geosphere, Volume 8, Issue 2, 2012, pp. 431-442.
Mosalam, K.M., Takhirov, S.M., Park, S., 2013. Applications of laser scanning to structures in laboratory tests and field survey. In Structural Control and Health Monitoring. DOI: 10.1002/stc.1565.
Nex, F., Rinaudo, F., 2011. LiDAR or Photogrammetry? Integration is the answer. In: Rivista italiana di telerilevamento, vol. 43 n. 2, pp. 107-121.