Optimum allocation of water to the cultivation farms using Genetic Algorithm
Bahram Saeidian*, Mohammad Saadi Mesgari, Mostafa Ghodousi
GIS Dept., Faculty of Geodesy and Geomatics Eng., K.N. Toosi Univ. of Tech., Tehran, Iran –[email protected],
[email protected], [email protected]
KEY WORDS: Agricultural water allocation, Optimization, Genetic algorithm, Deficit irrigation
ABSTRACT:
The water scarcity crises in the world and specifically in Iran, requires the proper management of this valuable resource. According to the official reports, around 90 percent of the water in Iran is used for agriculture. Therefore, the adequate management and usage of water in this section can help significantly to overcome the above crises. The most important aspect of agricultural water management is related to the irrigation planning, which is basically an allocation problem. The proper allocation of water to the farms is not a simple and trivial problem, because of the limited amount of available water, the effect of different parameters, nonlinear characteristics of the objective function, and the wideness of the solution space. Usually To solve such complex problems, a meta-heuristic method such as genetic algorithm could be a good candidate.
In this paper, Genetic Algorithm (GA) is used for the allocation of different amount of water to a number of farms. In this model, the amount of water transferable using canals of level one, in one period of irrigation is specified. In addition, the amount of water required by each farm is calculated using crop type, stage of crop development, and other parameters. Using these, the water production function of each farm is determined. Then, using the water production function, farm areas, and the revenue and cost of each crop type, the objective function is calculated. This objective function is used by GA for the allocation of water to the farms. The objective function is defined such that the economical profit extracted from all farms is maximized. Moreover, the limitation related to the amount of available water is considered as a constraint. In general, the total amount of allocated water should be less than the finally available water (the water transferred trough the level one canals). Because of the intensive scarcity of water, the deficit irrigation method are considered. In this method, the planning is on the basis of the optimum and limited allocation of water, and not on the basis of the each crop water requirement. According to the available literature, in the condition of water scarcity, the implementation of deficit irrigation strategy results in higher economical income.
The main difference of this research with others is the allocation of water to the farms. Whilst, most of similar researches concentrate on the allocation of water to different water consumption sections (such as agriculture, industry etc.), networks and crops.
Using the GA for the optimization of the water allocation, proper solutions were generated that maximize the total economical income in the entire study area. In addition, although the search space was considerably wide, the results of the implementation showed an adequate convergence speed. The repeatability test of the algorithm also proved that the algorithm is reasonably stable. In general the usage of GA algorithm can be considered as an efficient and trustable method for such irrigation planning problems. By optimum allocation of the water to the farms with different areas and crop types, and considering the deficit irrigation method, the general income of the entire area can be improved substantially.
* Corresponding author
1. INTRODUCTION
Population growth has increased demand of water for different sections such as industry, agriculture and etc. (Raes et al., 2006). On the other hand different areas and countries are facing drought. Iran is considered as one of the arid and semi-arid areas and is facing problem of drought. According to the latest estimations of UNESCO and FAO on earth's water cycle, average rainfall is approximately 865 mm in the world and it is about 250 mm in Iran, which is less than a third of the average rainfall of the world (Tebyan, 2014). In this situation, it is necessary, especially in this country, to have a proper management of water resources and an optimal utilization of these valuable resources.
Water consumers are different sections of agriculture, drinking, services, industries and etc. In world scale, agriculture is the first consumer of water with more than %70 (Raes et al., 2006; FAO, 2002; Alvarez et al., 2004). According to the official reports, around 90 percent of the water in Iran is used for agriculture. On the other hand, water is always the limitative
factor on crop production (FAO, 2012). The increase of food demand, has caused an increase in the need of crop production with less water (FAO, 2002; Ortega et al., 2005). Therefor planning, management and optimal utilization of available water resources in agriculture section are very important and the world's and region's top priorities (Ortega et al., 2005; Raes et al., 2006). One of the important solutions is to change water allocation to farm so that the allocation is optimum and with optimum utilization of water resources, efficiency of crops does not fall.
Ideally, the allocation should be done efficiently, practically and economically, technically and socially fair. Economical efficient allocation means distribution of water to maximize profit. Socially fair allocation tends toward distribution for preserving interests and fair allocation of water to weaker economical groups. Hence it is necessary to have a proper water allocation system, in which water is considered as a socially and economically merchandise (Babel et al., 2005). Improper water allocation to farm has made a lot of problems in irrigation
section. In some cases, some farms receive less water considering the crops, stages of crop development and some other parameters, and this causes a decrease of efficiency and in some cases dryness of whole farm crop or some part of it. Also in some cases, some farms receive more water, which again causes decrease of crop and fall of irrigation efficiency. The proper allocation of water to the farms is not a simple and trivial problem, because of the limited amount of available water, the effect of different parameters, nonlinear characteristics of the objective function, and the wideness of the solution space. Usually To solve such complex problems, a meta-heuristic method such as Genetic Algorithm (GA) could be a good candidate. In this paper, GA is used for the allocation of different amount of water to a number of farms. In this model, the amount of water transferable using canals of level one, in one period of irrigation is specified. The amount of water required by each farm is calculated using crop type, stage of crop development, and other parameters. Using these, the water production function of each farm is determined. Then, using the water production function, farm areas, and the revenue and cost of each crop type, the objective function is calculated. This objective function is used by GA for the allocation of water to the farms. The objective function is defined such that the economical profit extracted from all farms is maximized.
Because of the intensive scarcity of water, especially in arid and semi-arid regions, usage of deficit irrigation for improvement of efficiency of crop is inevitable and in many researches it has been recommended as an effective method in water deficiency situations (FAO, 2002; Raes et al., 2006). In this method, the planning is on the basis of the optimum and limited allocation of water, and not on the basis of the each crop water requirement. Correction of irrigation planning not according to crop water requirement, but according to the optimum consumption of allocated water, will be a good method that would be realizable by deficit irrigation (Kijne et al., 2003). Deficit irrigation is used to increase profit in regions that water is expensive or water limitations exist (FAO, 2002). In this research, Because of the intensive scarcity of water, the deficit irrigation method are considered.
Irrigation networks are formed by spatial features. These features have attribute information too. As a result a lot of topics on irrigation such as allocation of irrigation water, are related to both spatial and attribute information. Water resources, water distribution channels and also agricultural farms are dependent on location. Geospatial Information System (GIS) can deliver this data in an integrated environment. In this research GIS has been used for preparation of spatial and attribute information.
In the next section, we examine the related literature in water allocation. In section 3 we review the theoretical basis of GA and crop water requirement. Then in section 4 data are introduced and after that, data preparation stages in GIS environment are explained. At this section problem is modelled in genetic algorithm and then data are executed in the developmental model based on GA and finally its work is evaluated with respect to its results. We conclude the paper with a discussion of practical application, conceptual limitations, and ideas for future research in the final section.
2. PREVIOUS WORKS.
Ge, et al. has developed a Decision Support System (DSS) for irrigation water allocation at North West of china (Ge et al., 2013). Montazar and Rahimikob developed a nonlinear optimization model for optimal water allocation and cropping pattern in water limitation situation, at the irrigation network of
Qazvin located in Iran (Montazar and Rahimikob, 2008). Alvarez, et al. presented an optimum economic model for irrigation water management (Alvarez et al., 2004). Doppler, et al. investigated the effect of water cost strategies on irrigation water allocation (Doppler et al., 2002). Shangguan, et al. developed a regional allocation model for optimum irrigation water allocation in deficit irrigation situation(Shangguan et al., 2002). Reca, et al. presented an economic optimization model for water allocation in deficit irrigation situation (Reca et al., 2001).
Some of researches have used a GA. Kuo, et al. with the help of GA, developed an optimum model for determining optimum cropping pattern in an irrigation plan (Kuo et al., 2000). Wardlaw and Bhaktikul did the optimization of water resources utilization in cyclic irrigation systems with GA. Results of research show that a GA can optimize irrigation planning in severe water stress situations (Wardlaw and Bhaktikul, 2004). Zia and Anwar used GA for scheduling of irrigation water in water limitation situations. Researchers came to the conclusion that GA has a lot of capabilities for solving water scheduling problems (Zia and Anwar, 2010).
Results of researches show capability of GA in planning and irrigation management. In the present research, like many others, uses GA for optimal water allocation to farms considering crop water requirement and in deficit irrigation situation.
According to researches, water allocation methods are done at different levels such as different water consumption sections (agriculture, industry, hydroelectric, and etc.), networks, crops, farms and etc. Certainly, as the scale gets smaller, allocation will be more precise, but the amount of calculations and complexity will be harder. Most of researches concentrate on the allocation of water to different water consumption sections, networks and crops. Whilst, the nature of this problem is allocation to farms. Because crop type and stages of crop development is different for each farm and require different amount of water. The main difference of this research with others is the allocation of water to the farms.
3. THEORETICAL BASICS
In this section the theoretical basis of GA and crop water requirement are presented.
3.1 Genetic algorithm
Genetic algorithm is inspired by Darwin’s theory of evolution (Sivanandam and Deepa, 2007; Yeh and Lin, 2007). The algorithm has already been widely used for different optimization and machine learning applications (Sivanandam and Deepa, 2007). The building blocks of GA are the genes or solution parameters. Each solution to the problem is called a chromosome and is composed of some genes. The basic stages of GA are depicted in Figure 1 and are explained in the followings.
Start
Chromosome Encoding
Population Creation
Fitnes s Evaluation
Convergence? Stop
Selection
Crossover
Mutation
Replacement Yes
No
Figure 1. Flowchart for genetic algorithm (Yeh and Lin, 2007).
One of the main stages of GA is the calculation of the fitness (objective) function(s) for found solutions. This is the only criteria for selection of the good solutions that are to be parents of the next generation. The solutions are selected to be parents with probabilities proportionate to their fitness values. The more often used methods of selection are the roulette wheel, tournament and ranking methods. In crossover operation, sections of two parents are switched and combined to generate two new solutions, which might have better fitness values than their parents. Many methods for crossover are available including ranking selection, N-Point, Uniform, Partially Mapped, Ordered, Cycle, and Diagonal crossover. In order to prevent the convergence of the algorithm in the local optimum points, and to search new areas of the search space, the mutation operation is used, which makes small changes in some genes of a few chromosomes. Some of the mutation methods are order-based (swap), sub list-based (inversion), partial-gene, insertion, and scramble mutation.
3.2 Irrigation water requirement
Knowledge of water requirement and consequently crop water requirement, is an essential part of every irrigation plan. The water that crop consumes includes two parts. First is the amount of water that enters the roots and then by plant’s stoma enters into the air. Second is the amount of water that enters into the air directly from the soil surface. The first part is called “transpiration” and the second part is called “evaporation” and their combination which is in fact the crop water requirement, is called “evapotranspiration” (Alizadeh and Gholamali, 2008). For estimation of crop water requirement, there are direct or indirect methods, simple or complex methods and practical or theoretical methods. Crop water requirement calculation methodology in this research is based on FAO. In this research Equation 1, which is an indirect method for crop water requirement calculation, has been used (Ortega et al., 2005; FAO, 2012; FAO, 2002; Alizadeh and Gholamali, 2008; FAO, 1977).
(1) In this equation, ETcrop is evapotranspiration of crop (mm), ET0 is potential evapotranspiration of the reference crop (mm), and Kc is the crop coefficient.
Potential ET is the maximum amount of water that if water exists in abundance, it could be vaporized by the soil and crop surface. Reference crop is usually selected as alfalfa or grass (Alizadeh and Gholamali, 2008). A lot of different methods for ET0 calculation has been suggested that each one of them from a data point of view demand different requirements. ET0 is usually calculated with Penman-Monteith method (Ortega et al., 2005; FAO, 2012). This methodology is accepted for researches in semi-arid regions (Ortega et al., 2005).
Crop coefficient plays an important role in determining the crop water requirement. Because on one hand it is affected by crop type and stage of crop development and on the other hand it is affected by climatic situations and evaporation from the soil surface (Alizadeh and Gholamali, 2008). Crop coefficients are presented in FAO manuals (FAO, 1977). These amounts are also present in the Cropwat program (FAO, 2012).
The Crop water requirement is different than the irrigation water requirement. Irrigation water requirement is the amount of water that should be given to the farm by irrigation so that the crop could grow with its maximum power. Some part of irrigation water requirement could be provided by effective rainfalls. In addition to evapotranspiration, some extra amount of water should be entered into the soil so that extra salts are washed away from root expansion areas. The irrigation water requirement is obtained from Equation 2. In this equation number 10 is for conversion from mm to m3/ha (Alizadeh and Gholamali, 2008).
(2)
In this equation, Wp is the irrigation water requirement (m3/ha), Pe is the effective rainfall (mm), L is the amount of leaching (mm), and Ei is efficiency of irrigation.
There are different methods for effective rainfall calculation such as constant percentage of rainfall, FAO method, experimental method and etc. In this research constant percentage of rainfall has been used. In this method rainfall is calculated from Equation 3 (Alizadeh and Gholamali, 2008).
(3)
In this equation, P is the actual amount of rainfall, and a is the constant percentage of rainfall is considered between 0.7 and 0.9 (Alizadeh and Gholamali, 2008).
4. IMPLEMENTATION
In this section, steps of data preparation, modelling of problem in GA and results are presented.
4.1 Data preparation
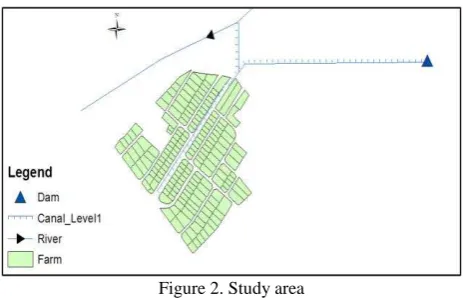
Study area of this research is a simulated area with extent of more than 55 hectares and 191 farms (Figure 2). Water resources are one simulated dam and one simulated river. In this research water resources are modelled as point and line, water transfer canals as lines and farms as polygons. For data preparation such as correction of topological errors including overlap, overshot and undershot and other errors, ArcGIS software package has been used.
Figure 2. Study area
In this research allocation is made in one period of irrigation (May 22th - Jun 21th). Table 1 shows amount of available water, which is of course simulated.
water resource amount of available water (m3)
Dam 60000
River 79000
Table 1. Available water
In this research it has been assumed that the case study region is located at Tarom-Khalkhal plain in Zanjan province and information of this plain has been used. The mentioned plain is in the basin of Sefidrood River and has a semi- arid climate and an altitude of 1796. Soil pattern is loam. Type of farm crops (existing cropping pattern) and their cultivation date are simulated according to the Tarom-Khalkhal plain. In Table 2 cultivated crops in this region and their properties are presented. The data of this research for economical calculations, including cost, performance and income are for one hectare of crops that have been extracted from agriculture office of the Zanjan province in the farming year of 2013-2014 (Table 2).
produced crop
Table 2. Cultivated crops in the region and their properties
For calculating irrigation water requirement, constant percentage of rainfall is considered to be 0.75 and leaching %5. Also, irrigation efficiency is considered to be %40. The crop water requirement was calculated with OPTIWAT software for every month of growth, according to Penman- Monteith equation. In Table 3 irrigation water requirement for one of the investigating farms with onion crop and cultivation date of March 10th has been presented. These tables are produced for every farm according to their cultivating crops and the date of cultivation. In this research, it has been assumed that the cultivation date of every type crop that is cultivated in different farms is the same (e.g. cultivation date of onion in every farm is March 10th.).
Another important parameter that will be needed in fitness function, is the stages of crop development of every farm, according to the crop type and cultivation date. Stages of crop development are as follows (Alizadeh and Gholamali, 2008): 1- initial crop stage: It is from the time of implant until the crop
covers %10 of the farm. 2- crop development: This stage starts from %10 coverage and continues till complete effective coverage. Complete effective coverage in most of the crop appears on the birth of the flower. 3- midseason: This stage starts from the complete effective coverage and continues till crop ripening. 4- late season: This stage starts from crop ripening and continues till harvest or wither. The mentioned parameter has also been extracted from Zanjan agriculture office reports.
Table 3.Irrigation water requirement of one of the investigating farms with onion crop and cultivation date of March 10th.
4.2 Formulation of the allocation problem in the context of the GA
In this section, the allocation of water to the farms is formulated in the context of the GA algorithm.
o fitness function
The fitness function is the realization of profit obtained from water allocation to agricultural sections with the help of optimization of deficit irrigation. Fitness function is described as Equation 4.
(4)
In this equation, n is toral number of farms, A is area of farm (hectare), B and C are revenue and cost of crop of farm, respectively (Rial per hectare), Ya and Yp are actual and potential yields of the farm, respectively (kilogram per hectare), and Ya/Yp is water production function. Water production functions with considering parameters such as provided water for crops or the amount of transpiration and evaporation, can calculate the amount of yield. Mayer, et al. suggested Equation 5 for crop performance estimation (Montazar and Rahimikob, 2008; Ghahraman and Sepaskhah, 2004; Meyer et al., 1993).
(5)
In this equation, n is toral number of stages of crop development, Ky is the yield response factor, and Wa and Wp are applied (allocated) and potential water, respectively (m3/hectare).
Ky values have been calculated for 33 crops by Doorenbos and Kasam (FAO, 1979), and has been used in many projects (Ghahraman and Sepaskhah, 2004). In this research, this data has been used. As mentioned in the section 4-1, it has been assumed that deficit irrigation, happened in one period of irrigation (May 22th - Jun 21th), and in the rest of the year there is enough water for farms. Consequently, for every stage of growth, Ky value is needed for that stage, which deficit irrigation has happened and the rest of the stages have been
fully irrigated (if deficit irrigation happens at all of the growth stages, seasonal Ky value should be used). Therefore, firstly with respect to time of crop implant of every farm, stage of crop development of every farm in one period of irrigation (May 22th - Jun 21th) should be determined and then Ky value of that stage should be applied (Table 4).
Ky
Tr-0111=water deficit occurring during initial crop stage Tr-1011=water deficit occurring during crop development Tr-1101=water deficit occurring during midseason
Table 4. Yield response factor values from FAO irrigation and drainage paper no.33 (FAO, 2012; Najarchi et al., 2011; FAO,
2002; Moutonnet, 2002; FAO, 1979).
o Defining the chromosome
The amount of water deficiency is calculated from Equation 6.
(6) In this equation, Dtotal is the amount of water deficiency (m3), n
is total number of farms, Wm is the irrigation water requirement (m3), and Qtotal is the maximum available water (m3). According to the existing data, the amount of irrigation water requirement for all of the farms in one period of irrigation (May 22th - Jun 21th), is 159377 m3, but the maximum available water in this period is 139000 m3. As a result, amount of water deficiency is 20377 m3, and we have to use deficit irrigation.
In this research, for reducing the solution space, instead of allocating available water to the farms, the amount of the water deficiency is allocated to the farms. In fact, the amount of water that should be reduced from each farm so that the 20377 m3 deficiencies be compensated, is determined; then allocated water to each farm is specified by reducing each farm’s irrigation water requirement from this amount. This amount should be in a way that the profit is maximized (Equation 4). As a result, one chromosome having n farms (in this research 191
Figure 3. Coding of a solution as a chromosome
Suggested optimization model, contains two constraints. First constraint is limitations of available water (Equation 7). The o Generation of the initial population
A number of chromosomes are generated randomly. For creating each chromosome, water reduction from each farm, is determined randomly, in a way that constraints (Equations 7 and 8) are kept; otherwise that chromosome will be deleted and a new chromosome that keeps the constraints is created.
o Selection of the parents
The chromosomes are selected to be the parents of the next generation using the Roulette Wheel method. In this method, each chromosome is selected with a probability proportional to its fitness value, as presented by Equation 10.
(10)
In this equation, Pk is the probability of chromosome k being selected, f(Xk) is the fitness value of chromosome k, and n is the number of all chromosomes.
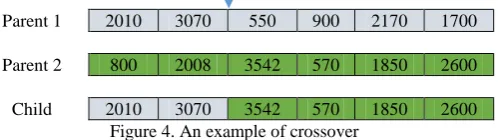
o Crossover function
In this research one-point crossover has been used. In this method, one point in the parent chromosomes is chosen (randomly or manually) and combine with each other. Figure 4 shows an example of crossover in the desired problem.
1700
Figure 4. An example of crossover
Now the constraints should be checked for child. With this definition, second constraint is always true and only first constraint should be checked. If the total amount of child genes is less than the total amount of water deficiency, then the correct chromosome has not been created and the difference amount should be subtracted from its genes so that the chromosome could return to the problem domain. For correction, a gene is selected randomly and 10 m3 water is added to it. Now the second constraint is checked for this gene. If it was not true, previous operation will be deleted and another gene is selected. This will be done until the second condition is true and the correct chromosome has been created.
o Mutation function
For mutation a random number between 0 and 1 is selected; if the number is less than the mutation rate, this chromosome mutates. In mutation, n genes are selected randomly. Then 60 m3 is reduced from these genes and is added to other genes that were selected randomly. This happens when the correct chromosome has been created; in fact the problem constraints should be kept and with this definition first constraint is always kept, and only the second constraint should be checked. If the second constraint in the two genes change (subtraction from one gene and addition to another one) is not kept, two other genes
will be selected. In Figure 5, an example of this type of mutation, in case of 6 farms and one change (n=1) with the amount of 60 m3 has been presented.
1300 600
1920 1180 3011 2900 initial
1300 600
1920 1240 3011 2840 mutated
Figure 5. An example of mutation
o Elitism
In this problem elitism is applied through elitism percentage. This parameter identifies the amount of chromosomes in each iteration that are considered as elite. Elite chromosome of each iteration has the best fitness function and these chromosomes transfer to the next iteration without any change. Low levels of elitism, decelerate the convergence of the algorithm. In contrast, high levels of elitism, cause the algorithm to fall in local optimums.
o Storage of the best solutions
Finishing the above stages, one run of the algorithm is finished and a new generation of chromosomes is created. The chromosome with the best fitness is determined and stored. The final solution is the best chromosome of all runs.
o Termination condition
The condition for terminating the algorithm can be to reach a predefined amount of similarity and stability in the best found fitness values, a predefined run number, a specific execution time or a combination of these. Here, a specific run number is used for termination of the algorithm.
4.3 Results
In this research MATLAB has been used for genetic algorithm modelling. Optimum values of the GA parameters for this issue have been obtained based on the experience of various repetition of algorithm (Table 5).
value parameter
100 Initial Population No
%15 Elitism Percent
50 Crossover point
0.3 Mutation Rate
30 number of the changes in mutation
60 amounts of the changes in mutation (m3)
1500 No of Iteration
Table 5. Used parameters in GA
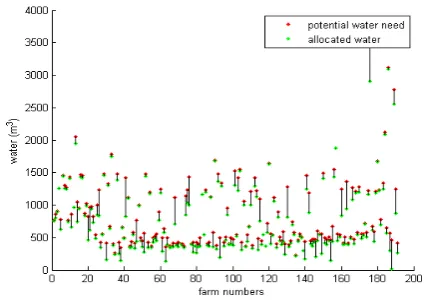
With the help of the developed algorithm and deficit irrigation, the profit will be 963511561 Rial. Potential (irrigation) water requirement and allocated water to each farm in one period of irrigation (May 22th - Jun 21th) have been displayed in Figure 6.
Figure 6. Potential water requirement and allocated water to each farm
According to Figure 6, the maximum difference between irrigation water requirement and deficit irrigation is 643.6 m3, the minimum difference is 0.3 m3 and the differences average is 106.7 m3. Figure 7 shows value of each farm’s water production function (Ya/Yp) in percentage.
Figure 7. Value of each farm’s water production function
According to Figure 7, the highest performance is %0.99 and the lowest performance is %0.58 and the average performance is %0.93. These values show that the presented model for optimization is acceptable. In fact, with this model, most of the farms have reached an acceptable performance and not just some specific farm or some specific crop. With this model farmers will be more satisfied. Profit can be raised with models such as cropping pattern, but in these models, farmers decisions have been neglected or it is possible that farmers adhere to their customs and do not apply these models. Figure 8 shows the convergence trend of GA.
Figure 8. Convergence trend of the GA algorithm
As it is evident from Figure 8, fitness function has gradual convergence. From beginning till 200th run, convergence has higher acceleration; but from this run till 600th, convergence acceleration decreases. Then there is a partial convergence from this run till 700th and from this point further algorithm converges and there is a small improvement after this run.
The algorithm runtime is 394 seconds, which is logical considering the wideness of the solution space and continuity of this space.
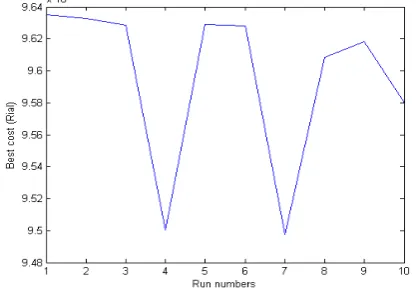
Reaching the identical results in different executions of the algorithm is an indicator of the stability and repeatability of the algorithm. To evaluate the GA algorithm regarding this criterion, it is executed 10 times. The results are shown in Figure 9.
Figure 9. Repeatability of the GA algorithm
With respect to Figure 9, answers could be divided into groups, in which range of change of answers in each group is low but the range of change between groups is high. For a more precise comparison of algorithm stability, variance of change of algorithm final answer in 10 runs (normalized amount) has been calculated. Because of normalization, variance is between 0 and 1, and whatever it is closer to 0, the algorithm has more stability. The amount of normalized variance is 0.1512 which proves comparatively good stability of the algorithm.
5. CONCLUSIONS AND RECOMMENDATIONS
Present research has been an effort in devising a plan for proper allocation of water resources in a way that at water limitation situations, acceptable performance from an economic point of view, could be achieved. In this regard, considering wideness and complexity of solution space, GA was used. Also, because of water deficiency, the deficit irrigation method was used so that it could help proper and optimum management of water sources. Results show that suggested model is practical. Using the GA for the optimization of the water allocation, proper solutions were generated that maximize the total economical income in the entire study area. In addition, although the search space was considerably wide, the results of the implementation showed an adequate convergence speed. The repeatability test of the algorithm also proved that the algorithm is reasonably stable. In general the usage of GA algorithm can be considered as an efficient and trustable method for such irrigation planning problems. One of the points of interests in this research is optimal water allocation to farms, which causes most of the farms perform acceptably and farmers more satisfied.
In this research it has been assumed that water deficiency occurs only in one period of irrigation (May 22th - Jun 21th) but it
could occur at any time. It is better that this research be done dynamically for all of the months. Also the period of irrigation in research has been assumed as one month, which is a very long period and almost impractical. It is better that the research be done for less irrigation periods like 10 days. This research fitness function is affected by profit, cost and water production function of each farm; whereas other goals such as water cost could also be entered and even optimization could be done multi-objective. GA presented a lot of good results in this research. Results of other methods such as linear and nonlinear optimization, dynamic programming and other meta-heuristic algorithms (PSO, Bee and etc.) could be compared with the results of GA.
REFERENCES
Alizadeh, A. & Gholamali, K. 2008. Crops water requirements in Iran. Second Edition [in Persian].
Alvarez, J. F. O., de Juan Valero, J. A., Martín-Benito, J. M. T., & Mata, E. L. 2004. MOPECO: an economic optimization model for irrigation water management. Irrigation Science, 23(2), 61-75.
Babel, M. S., A. Das Gupta, and D. K. Nayak. 2005. A model for optimal allocation of water to competing demands." Water Resources Management 19(6), 693-712.
Doppler, W., Salman, A. Z., Al-Karablieh, E. K., & Wolff, H. P. 2002. The impact of water price strategies on the allocation of irrigation water: the case of the Jordan Valley. Agricultural Water Management, 55(3), 171-182.
FAO. 2012. Crop yield response to water by P. Steduto, T. C. Hsiao, E. Fereres & D. Raes. FAO Irrigation and Drainage Paper No. 66. FAO, Rome.
FAO. 2002. Deficit irrigation practices by P. Steduto, T. C. Hsiao, E. Fereres & D. Raes. FAO Water Reports No. 22. FAO, Rome.
FAO. 1979. Yield response to water by J. Doorenbos & AH. Kassam. FAO Irrigation and Drainage Paper No. 33. FAO, Rome.
FAO. 1977. Guidelines for predicting crop water requirements by J. Doorenbos & W.O. Pruitt. FAO Irrigation and Drainage Paper No. 24. Rome.
Ge, Y., Li, X., Huang, C., & Nan, Z. 2013. A Decision Support System for irrigation water allocation along the middle reaches of the Heihe River Basin, Northwest China. Environmental Modelling & Software, 47, 182-192.
Ghahraman, B., & Sepaskhah, A. R. 2004. Linear and non-linear optimization models for allocation of a limited water supply. Irrigation and Drainage, 53(1), 39-54.
Kijne, Jacob W., Randolph Barker, and David J. Molden, eds. 2003. Water productivity in agriculture: limits and opportunities for improvement. Vol. 1. CABI.
Kuo SF, Merkley GP, LiuCW. 2000. Decision support for irrigation project planning using a genetic algorithm. Agricultural Water Management 45, 243–266.
Meyer S.J., Hubbard K.G. and Wilhite D.A. 1993. A crop- specific drought index for corn: i. model development and validation, Agronomy Journal, 85, 388-395.
Montazar, A., & Rahimikob, A. 2008. Optimal water productivity of irrigation networks in arid and semi‐arid regions. Irrigation and drainage, 57(4), 411-423.
Moutonnet, P. 2002. Yield response factors of field crops to deficit irrigation. In Deficit irrigation practices.
Najarchi, M., Kaveh, F., Babazadeh, H., & Manshouri, M. 2011. Determination of the yield response factor for field crop deficit irrigation. African Journal of Agricultural Research, 6(16), 3700-3705.
Raes, D., Geerts, S., Kipkorir, E., Wellens, J., & Sahli, A. 2006. Simulation of yield decline as a result of water stress with a robust soil water balance model. Agricultural water management, 81(3), 335-357.
Reca, J., Roldán, J., Alcaide, M., López, R., & Camacho, E. 2001. Optimisation model for water allocation in deficit irrigation systems: I. Description of the model. Agricultural water management, 48(2), 103-116.
Shangguan, Z., Shao, M., Horton, R., Lei, T., Qin, L., & Ma, J. 2002. A model for regional optimal allocation of irrigation water resources under deficit irrigation and its applications. Agricultural Water Management, 52(2), 139-154.
Sivanandam, S.N., Deepa, S.N. 2007. Introduction to Genetic Algorithms, Springer, Berlin Heidelberg.
Tebyan. 2014. Water management. Webpage, [Online].
Available from:
http://www.tebyan.net/newindex.aspx?pid=934&articleID=486 911.
Ortega, J. F., De Juan, J. A., & Tarjuelo, J. M. 2005. Improving water management: The irrigation advisory service of Castilla-La Mancha (Spain). Agricultural Water Management, 77(1), 37-58.
Wardlaw, R. and Bhaktikul, K. 2004. Application of genetic algorithms for irrigation water scheduling, Irrigation and Drainage, 53(4), 397-414.
Yeh, J. Y., & Lin, W. S. 2007. Using simulation technique and genetic algorithm to improve the quality care of a hospital emergency department. Expert Systems with Applications, 32(4), 1073-1083.
Zia, U.H. and Anwar, A. 2010. Irrigation scheduling with genetic algorithms. Journal of Irrig. and Drain. Eng, 136(10), 704-714.