EVALUATION OF ZY-3 FOR DSM AND ORTHO IMAGE GENERATION
Pablo d’Angelo
German Aerospace Center (DLR), Remote Sensing Technology Institute D-82234 Wessling, Germany email: [email protected]
KEY WORDS:ZY-3, Satellite, DEM, Matching, Stereo, Accuracy
ABSTRACT:
DSM generation using stereo satellites is an important topic for many applications. China has launched the three line ZY-3 stereo mapping satellite last year. This paper evaluates the ZY-3 performance for DSM and orthophoto generation on two scenes east of Munich. The direct georeferencing performance is tested using survey points, and the 3D RMSE is 4.5 m for the scene evaluated in this paper. After image orientation with GCPs and tie points, a DSM is generated using the Semi-Global Matching algorithm. For two
5×5km2test areas, a LIDAR reference DTM was available. After masking out forest areas, the overall RMSE between ZY-3 DSM and LIDAR reference is 2.0 m (RMSE). Additionally, qualitative comparison between ZY-3 and Cartosat-1 DSMs is performed.
1 INTRODUCTION
DSM generation using stereo satellites is an important topic for many applications. This paper evaluates the ZY-3 performance for DSM and orthophoto generation on two scenes east of Mu-nich. The results are compared against SPOT-5 HRS and Cartosat-1 DSM from the same area.
The ZY-3 satellite was launched on 9th of January 2012 on a Long March 4B rocket from the Taiyuan Satellite Launch Cen-tre. ZY-3 orbits the earth in a sun synchronous orbit at an altitude of 505 km with 10:30 AM descent time and a revisit period of 59 days. ZY-3 carries 3 panchromatic and one multispectral sen-sor. The forward and backward looking panchromatic sensors are tilted by22◦and have a width of16384pixels with a pixel size of10µmand a ground resolution of3.5m/pixel. The nadir
looking panchromatic line camera consists of 24576 pixels with a size of7µmand has a ground resolution of2.2m/pixel. Each
panchromatic camera has its own lens and consists of three sin-gle CCD lines located in across track dimension (Fang and Chen, 2012). The multispectral camera has a resolution of5.8mand
covers the blue, green, red and near infrared bands. It is 9216 pixels wide, and its pixelsize is20µm. The image quantization
of all 4 cameras is 10 bit.
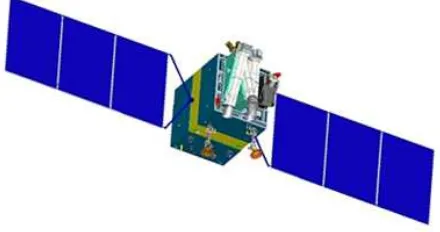
Figure 1: Image of the ZY-3 satellite (eoPortal, 2013)
2 DATA
As the ZY-3 Data is located in area where we performed an earlier SPOT 5 HRS evaluation (Reinartz et al., 2006), we could reuse
the reference data and also compare the ZY-3 results to the ones obtained with SPOT-5 HRS.
During this evaluation, the following data sets are used:
• Two ZY-3 Scenes located east of Munich, Germany. These were acquired on 9th of September 2012. Scene 268103 is denoted North and Scene 268104 is called South in follow-ing text.
• Two SPOT 5 HRS scenes covering the same area, acquired in 2003.
The following reference data from the Bavarian Agency for Sur-veying and Geographic Information was available:
• Two5×5km LIDAR DTMs (Digital terrain models) with
a resolution of 5 m and an height accuracy of 0.5 m.
• Survey points with schematics showing their location rela-tive to buildings and streets.
3 EVALUATION
In this evaluation ZY-3 and SPOT 5 HRS are evaluated side-by side. For SPOT 5 HRS, RPCs were generated by fitting an ob-ject space GCP grid. This grid was generated using the attitude and ephemeris data delivered with the scenes. The RMSE dur-ing RPC fittdur-ing was between 0.02 and 0.1 pixels. Usdur-ing RPCs for both sensors allows us to use the same matching and bundle block adjustment software for the further tests. For ZY-3, we used the provided RPCs. The RPCs that we recieved with the initial data did show a large absolute georeferencing error. SASMAC1later provided us with RPCs generated with improved GPS data and updated calibration, these were used in the evaluation below.
The survey points have been measured in all ZY-3 scenes. 15 survey points could be found in scene North, 21 survey points in scene South. It was hard to find the proper position of the sur-vey points as there were not signalised in the images, and buried inside fields a few meters from the next road or street crossing.
Scene Sensor CPs Column Row
Table 1: Survey point reprojection errors (predicted-measured) before adjustment. This is a measure of the direct georeferencing accuracy for these scenes. The pixel values have been multiplied with the GSD to show the deviation in meters. The high standard deviation (STD) mostly indicates the measurement uncertainty of the survey points identification in the ZY-3 images (≈1pixel).
Due to this, the points could not be located with sub-pixel preci-sion. The object coordinates of the points are given in the Gauss Kr¨uger projection in Potsdam datum. They were transformed into Geographic, WGS84 before further use. This transforma-tion was performed using a 7 parameter Helmert transform from the Bessel ellipsoid to WGS84. The EGM96 geoid was then used to transform from mean sea level height to ellipsoidal heights.
3.1 Direct georeferencing accuracy
The direct georeferencing accuracy is an important criteria for a mapping satellite, as it will determine the amount of ground con-trol points required for processing the satellite imagery. In this section we used the RPCs without any adjustment. This indicates the accuracy without ground control. For the direct georeferenc-ing evaluation, all survey points are used as check points (CP).
We have performed two experiments to estimate the direct geo-referencing accuracy of the sensors. First, all survey points were reprojected into the images and the difference to the measured image positions was calculated. The results are given in Table 1.
To estimate the 3D position accuracy, the 3D position of each check point point was computed through forward intersection of the measured image coordinates and compared to the 3D position of the survey point. See Table 2 for results. The mean X, Y and Z residuals are an estimate for the absolute accuracy of DSMs and ortho images created using direct georeferencing (without GCPs). The 3D RMSE for the survery points were 4.5 m for ZY-3 and 14 m for HRS. Two scenes are not enough to fully characterize the georeferencing performance of a satellite, but ZY-3 seems to perform very well in this regard.
3.2 Image Orientation
First, 40113 high quality multi-ray tie points were automatically measured between all 8 ZY-3 images using local least squares matching. One survey point in each scene was used as ground control point (GCP) and the remaining were used as checkpoints. The point which we could identify with highest confidence was used as GCP during the adjustment. A bundle block adjustment, based on tie points and GCP is then performed (Grodecki and Dial, 2003). We estimate a zero order image space correction, i.e.
CPs X (m) Y (m) Z (m) ZY-3 N 15 -2.7 / 2.7 -3.9 / 2.5 4.1 / 2.4 ZY-3 S 18 -1.9 / 2.0 -4.0 / 2.1 4.7 / 3.3 HRS S1 7 11.6 / 5.1 -14.7 / 4.1 -0.1 / 8.5 HRS S2 40 17.5 / 6.3 -15.2 / 6.0 -4.1 / 2.5
Table 2: Direct georeferencing object space residuals for sur-vey points measured in all images. The first number is the mean residual, the second number the corresponding standard devia-tion. The uncorrected RPCs were used for these figures.
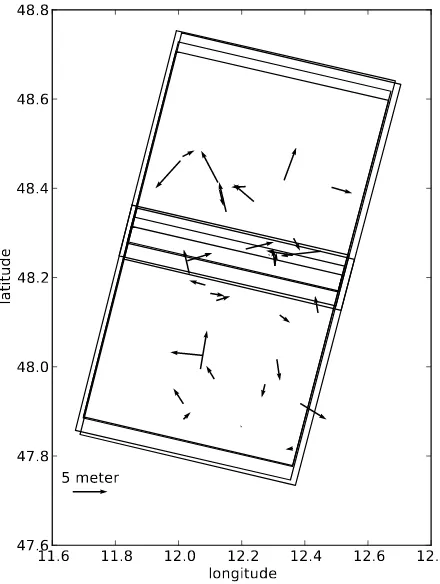
5 meter
11.6 11.8 12.0 12.2 12.4 12.6 12.8
longitude
Figure 2: Planimetric (X-Y) residuals of GCP and CPs after bun-dle adjustment.
Table 3: Object space residuals (mean / standard deviation) for CPs after bundle block adjustment. Only a single GCP has been used for bias RPC correction.
row and column shift in image space. The location of the survey points and the CP object space residuals are shown in Fig. 2. As survey points were only available for the southern part of the ZY-3 north scene, leading to an uneven GCP distribution, which can lead to worse performance when using an affine RPC correction. Residual statistics for the CPs after the adjustment are presented in Table 3, and are much improved over the values in Table 2.
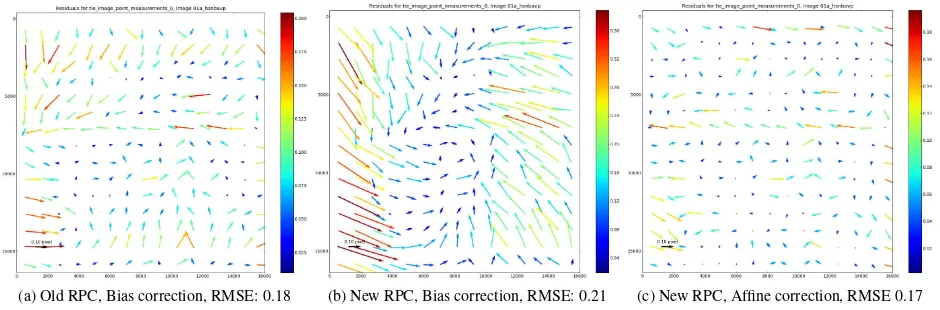
(a) Old RPC, Bias correction, RMSE: 0.18 (b) New RPC, Bias correction, RMSE: 0.21 (c) New RPC, Affine correction, RMSE 0.17
Figure 3: Image space tie point residuals for ZY-3 Backward image of the northern scene. The tie point residuals have been averaged in a15×15grid. The length of the vectors indicates the mean residual for all points in the cell. (a) The old RPCs could be corrected
well with a simple RPC bias correction. (b) The new RPCs with significantly better direct georeferencing behaviour (last two columns) show larger tie point RMSE. (c) Affine RPC correction is required to reduce the systematic errors .
These effects were not obvious from the checkpoint errors in Fig. 2, as the GCPs identification error is≈1pixel, much larger
than the systematic errors. For the older RPCs (with large di-rect georeferencing error) only slight systematic effects are visi-ble even when using only a bias RPC correction cf. Fig. 3. The newer RPCs allow good direct georeferencing, but require a more complex RPC correction. This point should be investigated in the future. To reliably estimate an affine RPC correction, at least 4 well distributed and high quality GCPs are needed, increasing the complexity of data processing. Especially for processing of large areas without GCPs, it would be preferable to require only an bias RPC correction. To test if affine RPC correction results to improved absolute accuracy, we additionally performed a block adjustment where all survey points were used as GCPs. When using bias correction, the total GCP RMSE is 2.6 m. With affine RPC correction, the total GCP RMSE reduces to 2.3 m.
3.3 DSM generation
After orientation with the GCPs, DSMs (digital surface models) have been generated by Semi-Global matching, with the Census cost function, as described in (d’Angelo and Reinartz, 2011). A grid spacing of roughly2×GSD was chosen, 5 m for ZY-3 and 20
m for SPOT-5. All DSMs have been generated automatically and with the same parameter values and are used without any manual processing (such seed point measurement, DSM editing etc.)
For ZY-3, 3 DSMs were generated from the Nadir-Backward, Nadir-Forward and Backward-Forward image pairs. They were merged by computing the median value for each pixel, and aver-aging heights close to the median. Remaining holes were filled with hierachical b-spline interpolation.
3.4 DSM evaluation
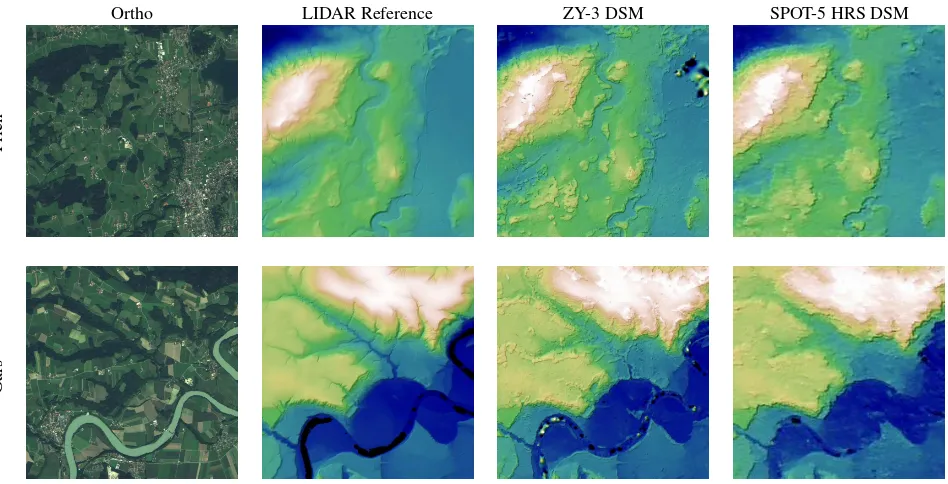
The test areas and DSMs are shown in Figure 4. It is obvious that the DSMs represent the visibile surface, including forest heights. The LIDAR reference terrain models are bare ground models and do not include vegetation and man-made structures. This leads to large differences in forested areas. For a fair comparison, forest and water areas have been masked out when computing the statis-tics in Table 4. The test areas are in hilly and rolling terrain, the heights in each area vary by 200 m. This terrain is not very chal-lenging and larger deviations should be expected in mountainous areas.
Satellite Area RMSE Mean STD NMAD in m in m in m in m
ZY-3 Gars 2.0 -1.1 1.7 1.5 Prien 1.9 -0.1 1.9 1.6
HRS Gars 3.5 -1.5 3.2 2.5
Prien 3.4 -1.5 3.0 2.3
Table 4: Statistics on euclidean distances between LIDAR DTM points and generated DSMs. The areas are 5x5 km2in size. For-est and water areas were manually masked out, to exclude large errors due to trees measured in the ZY-3 and HRS DSMs, but not in the reference DTM.
3.5 Comparison with Cartosat-1
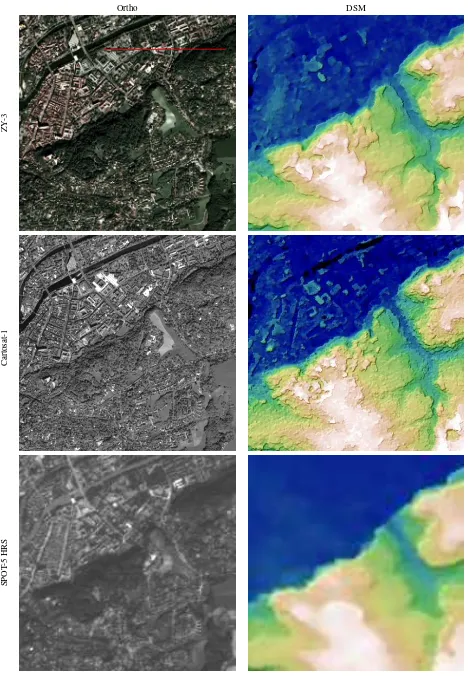
A Cartosat-1 stereo pair was available for the northern part of the ZY-3 coverage. Unfortunately, Cartosat-1 did not cover any of the LIDAR test areas, so we can only offer a visual comparison of the DSMs. An small part of the town Landshut was chosen as example, cf. Fig. 6. When comparing the ortho images, it is visi-ble that the radiometric quality of ZY-3 is higher than Cartosat-1 and SPOT5-HRS. While Cartosat-1 also provides data with 10 bit quantization, it has a lower sensitivity and effectively only uses the lower 8 bits in the test scenes. Visual comparison indicates that the sharpness of the ZY-3 nadir image seems to be superior to Cartosat-1 near nadir image. The ZY-3 image in Fig. 6 is a pansharpend image (nadir + multispectral). This is an advantage over Cartosat-1, which does not offer a multispectral image.
Ortho LIDAR Reference ZY-3 DSM SPOT-5 HRS DSM
Prien
Gars
Figure 4: Ortho images, LIDAR terrain model, ZY-3 and SPOT-5 HRS DSMs for the testareas Prien and Gars.
0
200
400
600
800 1000 1200 1400
position (m)
440
450
460
470
480
490
500
510
height (m)
LHut-P5-DSM.f
LHut-ZY3-DSM
LHut-HRS-DSM.p
Figure 5: Profile comparing Cartosat-1 (P5), ZY-3 and SPOT-5 HRS DSMs. The profile was created along the line shown in the ZY-3 Ortho image in Fig. 6
and higher robustness due to its three lines, but resolves fewer small surface details than Cartosat-1. In addition to Cartosat-1, a comparison with stereo pairs or triplets of the recently launched SPOT-6 satellite would also be very interesting.
4 CONCLUSION
ZY-3 offers a good georeferncing performance, and allows the generation of DSMs with much finer details than SPOT-5 HRS. For example, forest structure is well visible in the ZY-3 DSM. Due to the lower resolution of the ZY-3 forward and backward cameras, ZY-3 DSMs show fewer fine detail in city areas than Cartosat-1. However, Cartosat-1 does not provide multispectral imagery and always needs to be corrected with additional ground control. ZY-3 offers a good image quality and a high swath
width. The 3 lines and the good radiometric quality of the im-ages provides additional robustness in complex terrain and lead to increased height accuracy. Together with the good direct geo-referencing performance, ZY-3 is very well suited for three di-mensional mapping of large areas.
5 ACKNOWLEDGEMENTS
We thank SASMAC for providing the ZY-3 scenes, the HRS-SAP Initiative by CNES and DLR for providing the SPOT HRS scenes and the reference data.
REFERENCES
d’Angelo, P. and Reinartz, P., 2011. Semiglobal Matching Re-sults on the ISPRS Stereo Matching Benchmark. Proceedings IS-PRS Hannover Workshop 2011: High Resolution Earth Imaging for Geospatial Information.
eoPortal, 2013. ZY-3A (Zi Yuan-3A). https://directory. eoportal.org/web/eoportal/satellite-missions/
v-w-x-y-z/zy-3a.
Fang, S. and Chen, Y., 2012. Sensor Calibration of Three-line CCD Scanners on ZY-3. In: Proceedings of the 22nd Congress of ISPRS, Melbourne, Australia.
Grodecki, J. and Dial, G., 2003. Block Adjustment of High-Resolution Satellite Images Described by Rational Func-tions. Photogrammetric Engineering and Remote Sensing 69(1), pp. 59–70.
Ortho DSM
ZY
-3
Cartosat-1
SPO
T
-5
HRS