SPECTRAL RECONSTRUCTION BASED ON SVM FOR CROSS CALIBRATION
Gao Hui-ting, Ma Yue, Liu Wei, He Hong-yan
Beijing Institute of Space Mechanics & Electricity, Beijing 100094, China Email:[email protected]
Commission I, WG I/4
KEY WORDS: Hyperspectral sensing, Spectral reconstruction, non-linear, Cross calibration
ABSTRACT:
Chinese HY-1C/1D satellites will use a 5nm/10nm-resolutional visible-near infrared(VNIR) hyperspectral sensor with the solar calibrator to cross-calibrate with other sensors. The hyperspectral radiance data are composed of average radiance in the sensor’s passbands and bear a spectral smoothing effect, a transform from the hyperspectral radiance data to the 1-nm-resolution apparent spectral radiance by spectral reconstruction need to be implemented. In order to solve the problem of noise cumulation and deterioration after several times of iteration by the iterative algorithm, a novel regression method based on SVM is proposed, which can approach arbitrary complex non-linear relationship closely and provide with better generalization capability by learning. In the opinion of system, the relationship between the apparent radiance and equivalent radiance is nonlinear mapping introduced by spectral response function(SRF),SVM transform the low-dimensional non-linear question into high-dimensional linear question though kernel function, obtaining global optimal solution by virtue of quadratic form. The experiment is performed using 6S-simulated spectrums considering the SRF and SNR of the hyperspectral sensor, measured reflectance spectrums of water body and different atmosphere conditions. The contrastive result shows: firstly, the proposed method is with more reconstructed accuracy especially to the high-frequency signal; secondly, while the spectral resolution of the hyperspectral sensor reduces, the proposed method performs better than the iterative method; finally, the root mean square relative error(RMSRE) which is used to evaluate the difference of the reconstructed spectrum and the real spectrum over the whole spectral range is calculated, it decreses by one time at least by proposed method.
1. INTRODUCTION
Regular absolute radiometric calibration of satellite remote sensor is essential to ensure that the remote sensing imagery can reflect the character and variation rules of target factually. Post launch site calibration can’t meet the needs of high-frequency and operational radiometric calibration of satellite remote sensors, so cross calibration has become an primary method.
Considering the difference of spectral response character between reference sensor and target sensor, there are mainly two cross calibration methods: the spectral matching method and the spectral reconstruction method. Cross calibration based on spectral matching requires spectral response function of the referenced sensor and target sensor are similar, such as the center wavelength and the bandwidth, the difference of spectral band strongly influences the precision of cross calibration, restricting the range of cross calibration object at the same time.
Therefore, cross calibration based on spectral reconstruction is proposed by removing the difference of spectral bands and spectral response function between two sensors of cross radiometric calibration. There are four classes of spectral reconstruction methods. The first class uses an interpolation method to decrease the sampling intervals or regularize the spectral sampling positions. This management is convenient. However, the interpolated values actually hold an SRF with ambiguous FWHM and shape.
The second class transforms the spectral resolution to a low value. A few methods are used to synthesize a multispectral
band by weight sum of hyperspectral bands, and they are different in their ways to determine the weighting factors. The third class uses spectral deconvolution techniques to enhance the spectral features and get narrower bandwidth spectra. They are based on the overlap between SRFs of adjacent hyperspectral bands.The hyperspectral remote sensor with continuous spectral bands is regarded as referenced sensor, the problem to be solved is to recover the apparent radiance from equivalent radiance.
The last class involves a superresolution process for the given hyperspectral spectrum through iterations based on a correlation-sampling spectral response model and gets the final spectrum through sampling the superresolution spectrum according to the response model. It has been proved that this method performs better than the others above. A spectral reconstruction method based on SVM is proposed in this paper, which focuses on the relationship between the hyperspectral radiance and the apparent radiance, involves the SVM model for the given hyperspectral spectrum and gets the estimated spectrum through the model, with accuracy higher than those of current methods.
2. CROSS CALIBRATION BASED ON SPECTRAL RECONSTRUCTION
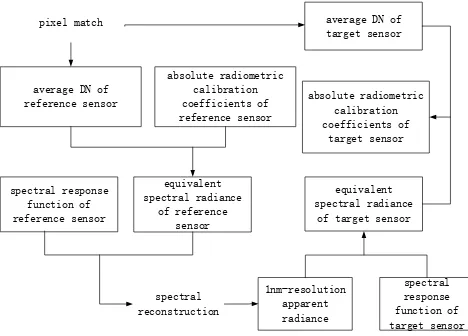
The reference and target sensor have the equal TOA radiance while the observing geometry conditions are the same in the process of cross calibration. Pixel match and spectral reconstruction are two main process technologies of cross
reconstruction(Figure1).Pixel match ensures that the two remote sensors image the same target, spectral reconstruction is an opportunity to restore a superresolution spectrum from the existing hyperspectral spectrum.
absolute radiometric calibration coefficients of reference sensor average DN of
reference sensor
equivalent spectral radiance
of reference sensor
absolute radiometric calibration coefficients of
target sensor average DN of target sensor
1nm-resolution apparent radiance
spectral response function of target sensor equivalent
spectral radiance of target sensor spectral response
function of reference sensor
spectral reconstruction pixel match
Figure 1 diagram of cross calibration based on spectral reconstruction
3. DECONVOLUTION ALGORITHM OF SPECTRAL RECONSTRUCTION
To hyperspectral imaging system, equivalent radiance of every spectral band is affected by the signals near the center wavelength, suppose spectral response function is
、
)
)(
(
11 121
S
、
)
)(
(
21 222
S
)
)(
(
、
S
m
m1
m2
, where m is thenumber of band, there are always overlapped spectral between
S
i(
)
andS
i1(
)
,also betweenS
i(
)
and)
(
1
i
S
(Figure 1),that is
i1,1<
i2.Figure 2 hyperspectral spectral response function The equivalent radiance
L
s1、 s2
L
、
、 smL
is calculated as:
))
(
(
L
f
L
si
(1)
Where
L
(
)
=apparent radianceThe inverse model of
f
(
)
is not able to be get through equation based on Ls1, Ls2, ….Lsm, so there is not any analytical solution.The iterative algorithm is a numerical solution which is used to reconstruct 1nm-resolution spectrum through iteration. The process of image is low-pass filtering with SRF based on Eq.(1), the filter effect on high frequency signal is stronger if the spectral resolution is lower, the precision of spectral reconstruction is worse accordingly. The iterative algorithm obtains the optimal estimation of the continuous spectral by solving a nonlinear system equation iteratively, amplifing the high frequency noise unavoidably during iteration. The noise of sensor is the main factor influencing the precision of the spectral reconstruction although adopting the denoising method with physical restriction.
4. SPECTRAL RECONSTRUCTION BASED ON SVM
In the opinion of system, the relationship between apparent radiance and equivalent radiance is nonlinear mapping. In the instance of misclassified error of training sample is smallest, SVM-based regression transform the low-dimensional nonlinear question into low-dimensional linear question though kernel function, obtaining global optimal solution by virtue of quadratic form. Spectral reconstruction integrated with SVM solve
L
(
)
based on nonlinear processing ability, figuring out the problem of system noisecumulation and depravation and reducing the error of spectral construction.
1 e
L
、2 e
L
、
、L
enis corresponding equivalent radiance vector whileS
(
)
act on apparent radiance vector)
(
1
L
、L
2(
)
、
、L
n(
)
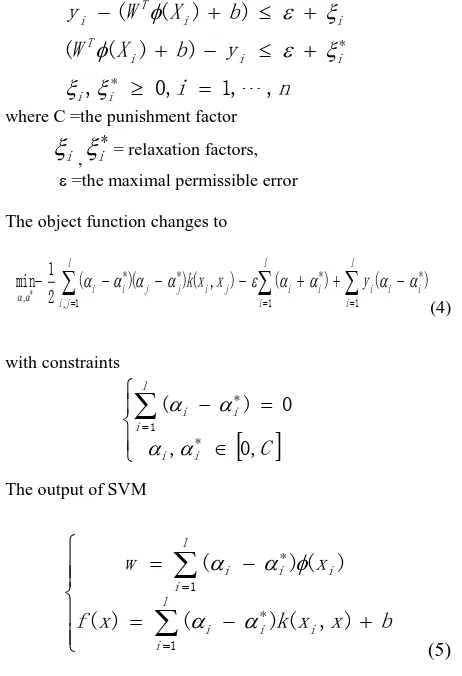
, equivalent radiance vector and apparent radiance vector representing target character is as input and output respectively, model parameter of kernel function of SVM is obtained by learning and training representation nonlinear relation in Eq.(1). X={(x1,y1),…, (xn,yn)} is the sample set, where xi is the input and yi is the output. Then estimation of nonlinear function is to find the function f(x) by training for computation of y. A nonlinear mapping is used to project the training set to a high-dimention space, transforming the estimation of nonlinear function to the linear function of high-dimention. Suppose f(x)=WTφ(x)+b, the input space is projected to a high-dimentional feature space by φ(x),b is the offset. The regression arithmetic computes the minimal root mean error between the true value and the object value, the object function (LING,2004)
n1
400 420 440 460 480 500
0 0.5 1
wavelength(nm)
re
sp
o
n
si
v
it
n
where C =the punishment factor
i
, *i
= relaxation factors, ε =the maximal permissible error The object function changes to
the above equation, which is used to project spectral radiation measured by referenced sensor with definite spectrum resolution onto 1nm-resolution spectral radiation .5. EXPERIMENT AND DISCUSSION
To contrast the calibration error of the proposed model and the deconvolution model, extensive atmospheric
radiative-transfer modeling was undertaken using 6s software.
5.1 Input of simulation
1) reflection of water body
Around one hundred visible-near infrared
spectral reflectivity samples of Guanting Reservoir are measured by National Satellite Ocean Application Service between June and September 2005(Figure 3). The basic character of spectral reflectivity curves are similar, the difference may be caused by measured time and locality, which should be considered while construct the training set.
Figure 3 spectral reflectivity of water body
2) atmospheric condition
Considering the position of site, the atmosphere model is set to midlatitude including summer and winter; aerosol model is set to marine and by change of visibility from 1km to 30km with intervals of 2km;the solar geometry is set through change of sun elevation angle from 10 degree to 70 degree with interval of 10 degrees(Table 1).The aerosol attenuation of cloud and rain is not considered.
Table 1 atmospheric condition of simulation
factor value
area season
middle latitude summer/winter
aerosol type marine
visibility 1~30km,sampling interval is 2km solar elevation angle 10°~70°,sampling interval is10°
3) spectral parameter of sensor Gaussian SRF is with the FWHM of 5nm/10nm-resolution,SNR is over 100dB.
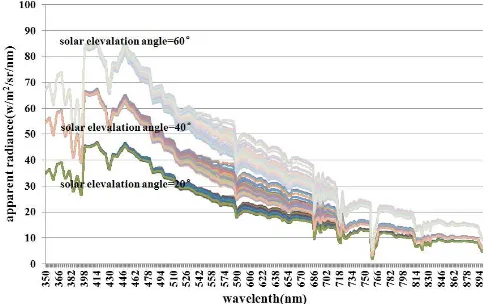
Based on input conditions above, the real apparent radiance is computed by 6s,which corresponds to a set of 1-nm-width rectangle SRF with sampling intervals of 1nm(Figure 4). Combination of all above factors, in sum, about twenty thousands apparent spectral curves are obtained. The simulation result is as below:
1、 The apparent radiance runs down with the rise of wavelength in visible near infrared spectrum;
2、 The apparent radiance is in proportion to the solar elevation angle and the reflectivity, but is in inverse proportion to the visibility;
(a)apparent radiance for different values of solar elevation angle
(b) apparent radiance for different values of visibility
(c)apparent radiance for different season
Figure 4 simulated apparent radiance
The equivalent radiance can be calculated by Eq.(1).Then the equivalent radiance and the apparent radiance is as input and output separately, composing training sample sets with RBF
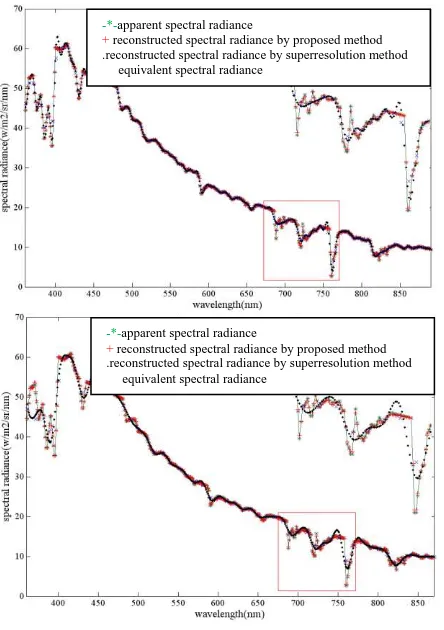
Five test samples based on iterative and proposed methods are chosen to reconstruct apparent spectra. Figure 5 shows the reconstructed results of five test samples. By constrast with the apparent spectral, the low-pass filtering effect of SRF causes the loss of high frequency signal of equivalent spectral radiance, for instance, the distortion of reconstructed spectrum based on iterative is obvious between 650nm and 800nm(blue cross).The reconstructed spectrum based on proposed method(red asterisk) demonstrates better qualitative agreement with the spectrum of entrance pupil(green asterisk line) than the iterative method(black point) in the whole VNIR band based on visual perception. Figure 6 shows that the influence of spectral resolution to the reconstruction result with local amplification, the proposed method almost recovers information originally lost in the hyperspectral sensor.
The RMSRE is often used to evaluate the similarity of two spectrums for the whole spectral range. Table 2 shows that the proposed method performs better when the FWHMs changes from 5nm to 10nm and it is best among the methods involved in the experiment.
Table 2 RMSRE
test 5nm 10nm
SVM deconvolution SVM deconvolution
1 0.34% 2.14% 0. 6% 3.9%
2 0.46% 1.9% 0. 79% 3.64%
3 0.7% 1.82% 1.19% 3.55%
4 1.39% 3.18% 2.37% 5.69%
5 0.16% 1.83% 0. 34% 3.46%
6 0.86% 2.96% 1.59% 5.52%
7 0.34% 1.94% 1.09% 3.22%
8 0.43% 1.9% 0.75% 3.64%
9 0.13% 1.96% 0.26% 3.66%
10 0.63% 1.63% 1.09% 3.22%
Figure 5 reconstructed spectrum(five test samples)
400
500
600
700
800
900
0
0.2
0.4
0.6
0.8
1
wavelength(nm)
no
rm
a
li
z
e
d
spe
c
tr
a
l
ra
di
a
n
c
Figure 6 (a)reconstructed spectral radiance with spectral resolution of 5nm(b)reconstructed spectral radiance with
spectral resolution of 10nm
5.3 Conclusion
This paper has proposed a method to perform the spectral-response-effect transformation with higher accuracy than current methods. The relationship between the apparent radiance and the equivalent radiance for prediction is described through SVM by learning. The simulation result shows that the RMSRE changes from 3.18% with iterative method to 1.39% with proposed method when the spectral resolution is 5nm, the RMSRE changes from 5.69% with iterative method to 2.37% with proposed method when the spectral resolution is 10nm.Therefore, the proposed method can ensure the accuracy of spectral reconstruction while the spectral resolution of referenced sensor reduction. COCTS which is the main payload of Chinese “HY” series satellite
has eight bands, band 7(730nm~770nm) with two main absorption peaks is used for atmospheric correction. There is almost no high-frequency information lost after spectral reconstruction with proposed method by contrast with the deconvolution method.
Chinese “HY-1C” and “HY-1D” satellites which will be launched in 2018 will take the hyperspectral sensor with the solar calibrator, which may be used for cross calibration with other ocean color sensors to validate the proposed method furthermore.
REFERENCES
Pan Delu,2004. In-orbit cross-calibration of HY-1A satellite sensor COCTS. CHINESE SCIENCE
BULLETIN,49(23),pp.15-20
XU Na,2012. Inter-calibration of infrared channels of FY-2/VISSR using high-spectral resolution sensors IASI and AIRS. Journal of Remote Sensing,16(6),pp.645-952 R.O.Green,2003. On-orbit radiometric and spectral
calibration characteristics of EO-1 Hyperion derived with an underflight of AVIRIS and in situ measurements at Salar de Arizaro, Argentina.IEEE Trans. Geosci.Remote
Sens,41(6),pp.1194-1203
Slawomir Blonski,2003.Synthesis of Multispectral Bands From Hyperspectral Data: Validation Based on Images Acquired by AVIRIS,HYPERION, ALI, and ETM+. Stennis Space Center.SE-2002-02-00012-SSC.
ZHOU Guan-hua,2012.Imaging Spectrometry Radiometric Cross-Calibration Based on Precise Spectral Response
Matching, Spectroscopy and Spectral
Analysis,32(12),pp.3416-3421
Huijie Zhao, 2010.Transformation From Hyperspectral radiance data to data of other sensors based on spectral superresolution. IEEE Transactions on geoscience and remote sensing,48(11),pp.3903-3912
Sun Lin,2010.Research on Multi-dimentional Signal Picking-up of Sensor Array Based on LS-SVM. China Mechanical Engineering,21(6),pp.711-720
LING Yong-fa,2004.Design and Implementation of Buffer Occupancy Estimation Model Based on Support Vector Machine. Journal of China Institute of
Communications.25(10),pp.45-50
-*-apparent spectral radiance
+ reconstructed spectral radiance by proposed method .reconstructed spectral radiance by superresolution method
equivalent spectral radiance
-*-apparent spectral radiance
+ reconstructed spectral radiance by proposed method .reconstructed spectral radiance by superresolution method