IDENTIFICATION OF LAND COVER IN THE PAST
USING INFRARED IMAGES AT PRESENT
V. Šafář a, V.Ždímal b, *
a
GEODIS BRNO Ltd., Lazaretní 11a, 615 00 Brno, Czech Republic – vaclav.safar@geodis.cz
bFaculty of Agronomy, Mendel University in Brno, Zemědělská 1, 613 00 Brno, Czech Republic –
zdimal@mendelu.cz
Commission VII, WG VII/4
KEY WORDS: Remote Sensing, Land Cover, Land Use, History, Infrared, Manuscripts, Agriculture
ABSTRACT:
Czech landscape is an old residential area used by humans since ancient times. People have influenced it since their arrival and various activities in different periods create landscape layers called a palimpsest. Land Cover of one location could have changed several times. The most important reason is meandering and subsequent straightening of rivers, deforestation, relocation and change in soil layers. These changes in the past affected the present management and it is important to identify them. A suitable tool for the determination of different sites is remote sensing in the infrared spectrum, which monitors changes in the vegetation with the support of archival materials. After identifying the different places you can search the archival materials, how the land cover looked in the past. There have been used these archival materials: maps II. and III. military mapping, basic maps and other maps and historical orthophotomap. Czech Republic has a national archive of aerial photographs with aerial photographs from the thirties of the last century maintained by MGHO Dobruska. A comparative analysis of Land Cover shows the increases and decreases in agricultural land, changes in communication line elements, forest losses and increases, comparing the legal and actual status of the forest boundaries and their changes over time, changes in the built areas and links to the surrounding countryside. Land Cover of this study was created primarily with a visual interpretation of each area with their vectorization and assigning attributes to these areas and then comparing each of archival materials.
1. INTRODUCTION
The landscape is constantly changing. The causes of these changes are both natural, but nowadays mostly human. In de-veloped countries with dense settlement is great pressure on the landscape and there are many people interested in its use. Czech landscape belongs to old development areas settled by a man from old ages. The landscape has been under human influence since people first arrived on the scene, with individual eras leaving their mark in the form of layers which may be read al-most like a palimpsest. A single location may show evidence of human activity from the different periods and natural changes. The Land Cover of one location could change several times. The most important reason is meandering and following straightening of rivers, deforestation and soil movement. In the past those changes influenced today's management and it is im-portant to identify them. When we design a new Land Use is important to know the Land Cover in the past. Knowledge of the Land Cover in the past allows us to propose the appropriate the Land Use in the present and prevent unsuitable use of land-scape with limited usage. One of the tools used to determine the different places are remote sensing in the near-infrared band monitoring the vegetation changes. These changes show the vegetation places with different histories of others. After identi-fying the different sites it can be found in archival materials, what was the Land Cover in the past.
Lipský [1999] and Kubeš [1996] describe detailed origin and development of cultural landscape in the Czech Republic. Czech landscape underwent a fundamental change in the period of socialist collectivization of agricultural production since 1954. The area of agricultural land increased, meadows and grassland were arable in the lower altitudes. Usage of plant
pro-tection chemicals and chemical fertilizers negatively affected the biota of agricultural land, neighborhood land and biota wa-ter streams and reservoirs. Insecticides kill many insects, heavy metals get worse health status and reproductive abilities of birds and mammals, plant species sensitive to nitrogen disappeared and plants able to live in the new conditions appeared. Increas-ing the area of agricultural land and the change of management of the meadows and pastures have deteriorated aesthetic param-eters of the countryside. In some areas there are occurred in-creasing of the size of area of woody vegetation of agricultural landscape in the period of socialist collectivization of agricul-ture. That development was different in each territory of the re-public, depending on whether it was a production area or mar-ginal. Large-scale socialist farming practices in the country left a number of small unusable areas with weeds and trees. The current state of the landscape is not very different from the con-dition of the landscape during periods of maximum application of forms of socialist agriculture. Examples of simplification of the landscape microstructure are shown in Figures 1. and 2.
Spectral characteristic of plants are the main consequences of the different land use. The spectral behavior of vegetation showed a significant increase in reflectance in the near infrared spectrum. It is commonly stated that in the visible spectrum about 20% of incident radiation is reflected by vegetation, while in the near infrared spectrum about 60% is reflected. The differ-ence in the amount of chlorophyll in leafs has a great infludiffer-ence on the determination of LAI. An influence of the amount of chlorophyll on the LAI determination was studied by Habou-dane et al. (2004). Convenience of used spectral bands is often discussed question. Primary, standard red (RED, 630-690 nm) and near infrared (NIR, 750-900 nm) bands are used. Zhang et al. (2006) used these spectral bands and NDVI, respectively, for International Archives of the Photogrammetry, Remote Sensing and Spatial Information Sciences, Volume XXXIX-B7, 2012
the determination of the amount of nitrogen in rice and Reyniers et al. (2006) observed dependence between the amount of nitro-gen and NDVI in plants. Additionally, studies that evaluate convenience of various spectral bands in different plant growth phases or conditions are also made. Ferwerda, Skidmore a Mu-tanga (2005) observed that the most convenient spectral region for the monitoring of the nitrogen amount lies between 1770 and 693 nm. Historical land cover is important for landscape planning (Marcucci, 2000) and remote sensing is a suitable tool for recognition of historical land cover. (Ulbricht, Heckendorf, 1998, Gojda, 2000)
Figure 1. Simplification of forest
Figure 2. Straightened river Šatava
2. METHODS 2.1 Study site
The project was solved on the land of University agriculture en-terprise (UAE) (Mendel University in Brno), placed in Žabčice 90 km from Vienna (Czech Republic, 48°59´11" N 16°37´40" E, 175 m above sea-level). (Figure 3.) UAE is working mainly in the maize area. Field production is focused on the production of cereals and fodder crops and livestock production is focused on beef and pig-rising. Additional activities are focused first of all on the practical aspects of the student education. UAE Žabčice controls 1602 ha of the farmland (1353 ha of the arable land).
In the area of interest from 1953 to 2003, there were significant changes between different categories of the Land Use. Area of the arable land decreased from 83% to 73%, area of permanent grassland decreased from 7% to 2% and area of the forest land increased from 3% to 5%. The categories of orchards and gar-dens area occurred increasing by 7% and other categories by 6%. The increase in the category of the others was mainly due to increase in built-up area.
Figure 3. Study site
2.2 Data processing
Modern digital aerial measuring cameras also capture by one channel the radiation from near-infrared band. These aerial pho-tos are an important information base for the study of vegetation cover. Currently, the entire Czech Republic is already covered by digital infrared images. With a resolution of 12.5 cm 2/3 of the Czech Republic is now covered. One third is covered by im-agery with a resolution of 25 cm (values are given for the result-ing pansharpenresult-ing images composed of band G, R and NIR into the standard CIR – the separate resolution of infrared band is 37.5 or 75 cm). The mission with digital cameras UltraCam from company Vexcel Imaging GmbH was started in 2007 and this year 2012 whole country to the final element of 12.5 cm will be covered. All images are archived. Images can be used for studying purposes, either as individual bands or as a compo-site image of the three color bands without pansharpening - G, R and NIR as well as the CIR and pansharpened CIR. For stud-ying purposes the images can be used without radiometric cor-rections, ortogonalized or composed in the final orthophotomap. Orthophotomap with the use of IR band is made according to requirements and needs only to order. Coverage of the Czech Republic orthophotomap with element 12.5 cm, or 10 cm (large cities) is made only in the standard RGB interpretation.
Aerial photos in the near-infrared band were used for visual in-International Archives of the Photogrammetry, Remote Sensing and Spatial Information Sciences, Volume XXXIX-B7, 2012
terpretation of characters that identify the previous Land Cover. Visual identification was performed with digital images on the screen. Identified was:
1. Pushing the borders of individual Land Cover categories
2. Areas with different Land Cover
3. Lines and distinctive shapes which differ from the surrounding area indicating different usage.
Identified differences were compared with historical source ma-terials The historical source mama-terials are:
1. Memories of witnesses and field survey
2. Maps from II. military mapping from the years 1836 - 1852
3. Maps from III. military mapping from the years 1877 - 1880
4. Cadastral maps since 1928 5. Topographic maps since 1952
6. aerial photographs from the years 1953, 1968, 1976, 1984 and 1991
7. Historical orthophotomap from 1953. This orthophoto was always used as first one, because the most significant changes in Land Cover occurred after 1953.
Historical orthophotomap from the year 1953 is the most im-portant material for the study of historical Land Cover of the Czech Republic. For purposes of creation of this orthophotomap aerial photographs and reconnaissance photographs from the aerial photographs archive of the Czech Republic (managed by Military Geographic and Hydrometeorlogic Office - MGHO) were used. When selecting suitable aerial photographs from the post-war period, the date of acquisition as close as possible be-fore the time of collectivization during the years 1952 and 1953 was primarily respected. Verification of archives of aerial pho-tographs proved that photography in the years after World War II was relatively fragmented and cover of the entire territo-ry of the Czech Republic was attained between 1946 and 1959. Some places were not covered by the post-war images at all (before the collectivization). These places were covered with aerial photos from pre-war period and images taken in 1959.
One place was first covered with images in 1996! The Table 1. clearly shows why the project was called the Historical ortho-photomap the 1953.
Table 1. The number of images from individual years
From the mentioned documents it is clear that aerial photos,
es-pecially in the western area - west of the city of Plzen, were probably problematic from military and political view and the aerial photography, here was not completed until 1959. From the post-war period a total of 20 240 images were selected and from the pre-war period another 77 aerial photographs had to be added. In total, 20 317 aerial photographs were processed. The procedure of creating the Historical orthophotomap started with selecting and production of the derived imaging basis from aer-ial surveying archival images. Most of the images are in18x18 cm size and in the scale around 1:25 000. For some ar-eas, especially the border arar-eas, were used aerial photos in size 30x30 cm. The quality of the original images was significantly different. The reason was using these images for mapping pro-duction during these years, followed by transfer of flammable celluloid base on the PET base during the nineteen eighties. Aerial photos are variously scratched and partly dirty because of previous handling. The data about the internal orientation (calibration protocols) was not preserved by these images. The procedure of preparation the derived imaging basis required a considerable effort from MGHO. The required images were first selected from the acquired images “atlas”in which images are sorted by the year of photography. From the archives of im-ages the negatives (or slides) were then physically chosen and by copying with photo copiers with electronically controlled contrast adjusting and subsequent black and white photo lab processing, the duplicate aerial photos were created and conse-quently scanned.
Scanning of the archival images basis was a challenging techno-logical operation, which had a major impact on the quality of the final orthophotomap. For this reason, before the scanning of sub-blocks of images, the scanning tests were carried out with an aim on finding the course of density curves characteris-tics on selected negatives, and to set the optimal scanning pa-rameters so that the resulting original digital images could be easily manipulated in further stages of production. The demands on standard cleanup of the original images from dust and me-chanical dirt were followed; the cleanup was made with device working on electrostatic basis; and with the principal of purity of thrust glass and underlying glass of the scanner. After scan-ning the image, the completeness of scanned image was checked including frame markers. Geometric accuracy verified by manufacturing plant calibration of the scanner was RMSExy = 2 micrometers and digital image pixel size was 14 microme-ters. After scanning all the images the country area was divided into sub-blocks.
Measurement and analytical aerotriangulations (AAT) were quite unusual. Based on the sheet index of historical photos the flying strips and all aerial photographs were defined. The imag-es were completed with information about the camera (specified focal length parameters, coordinates of the fiducial marks, the main point and lens distortion). Parameters of the cameras were determined by autocalibration, because the calibration protocols were not preserved (not even any partial information about the elements of interior orientation, except for gross information concerning the focal length of the camera) for the cameras used for the acquisition of historical images. After the automatic measurement of fiducial marks, images were measured manual-ly in places, where the machine could not identify the fiducial marks and in places where measurement error exceeded the lim-it. Any corner fiducial marks could not be missed during these corrective measurements. For each block the ground control points were selected from the current documentation, in order to be identical with points on historical images. Mostly it was the church towers, intersections and landmarks in the field.
completed projects - selected points were deducted from previ-ously produced orthophotographs. For all these points, the em-phasis was on the correct interpretation of historical and con-temporary images.
Given that the initial embedded parameters of external orienta-tion images were very approximate, it was necessary for easier automatic image correlation to measure connecting-identical points on each photo, both in all lines and between these lines. During this measurement the ground control points were simul-taneously identified. During the measurement, the emphasis was on the follow-up RMSE of tie and ground control points. After measuring the connecting and ground control points, the calculation of elements of the exterior orientation of single im-ages on the basis of established limits was carried out. The re-sults of the calculation were exterior parameters of aerial imag-es, root mean square error on the ground control points, the resulting sigma and various textual and graphical outputs for subsequent analysis of the valuation, including error messages. The aim of the AAT analysis was to examine the mean values of residual errors of measured connecting points, the number of redundant measurements, mean squared errors of the ground control points and calculated angular parameters of exterior ori-entation. The inspection of the ground control points’ distribu-tion in the block was also necessary as well as the number of measured and generated connecting points on the individual im-ages in strips and between strips by means of graphical software tools. Part of this analysis was also the connection and assess-ment of the subsequent triangulation blocks characteristics.
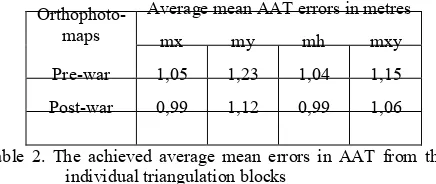
After the AAT calculation analysis the erroneous connecting points and ground control points were remeasured. Further-more, the new connecting points at critical spots in blocks were measured, and if necessary, new ground control points were added. Calculation of AAT was considered final, unless the re-quired AAT characteristics were achieved. The achieved aver-age mean errors in AAT from the individual triangulation blocks are listed in the Table 2.
Orthophoto- maps
Average mean AAT errors in metres
mx my mh mxy
Pre-war 1,05 1,23 1,04 1,15 Post-war 0,99 1,12 0,99 1,06
Table 2. The achieved average mean errors in AAT from the individual triangulation blocks
The resulting AAT accuracy is significantly influenced by the defined (unknown) parameters of used aerial surveying cameras and used ground control points, including their layout.
For images orthorectification, it was necessary to carry out the radiometric correction on individual images - common editing of image defects caused by light aberrations of the aerial camera lens, ground reflections, field illumination, sun at different an-gles, images processing in different seasons and different flight parameters. These radiometric corrections were performed by dodging in places, where the dark places were lightened and the light places darkened, so that the picture has balanced presenta-tion of details in shadows and more light-exposed areas. Alt-hough a number of steps of radiometric compensation were conducted automatically, high personnel effort was devoted to these operations.
For the desired area of digital image processing and
orthorecti-fication the DTM necessary to transform the image on the real terrain was prepared. The elevation accuracy of digital terrain model is due to the resulting orthophotomap expected to be in resolution of 0.50 meters to 1.5 meters. The basic problem of the used DTM was its topicality, because in many places did not match the area state during the years of images acquisition. For the necessary corrections of the terrain model (updates removal) the original technological process was elected leading to the re-quired accuracy of the final orthophotomaps.
After the orthorectification was performed, the visual inspection of resketched images was carried out, by which the geometric quality was controlled and on the basis of the control points wrong places were marked as well as places with image defor-mations. In these designated areas the digital terrain model was corrected stereoscopically to the state valid on the date of imag-es acquisition.
After the DTM correction a new redraw followed as well as the control of corrected places in the manufactured orthophoto-maps.
Selected parts of archival images were defined using seamline. These parts were used in the final mosaic. These cutting lines were selected according to the appropriate configuration of the terrain so the transition between photos was the least distinct. After creating all seamlines the individual files with cutting lines were assembled, cutting lines were checked for coverage of desired space. Control of topology was carried out whether each image corresponds to a polygon with one centroid, and whether the cutting line had no loose end.
After finishing the calculation of mosaicking visual control of all map sheets was performed for coverage of the desired area without visible errors in the image on the resulting mosaic.
Places with geometric imperfections were marked into a special file. Attention was mainly focused on the places where the cut-ting lines cross with communications, line buildings and built-up areas in general. Furthermore, the routes of especially dis-tinctive communications were checked (main roads, railways, roads on mounds or in pits); routes of larger rivers or canals and places with bridges were marked in case there were some visi-ble deformations caused by redrawing technology and other dis-torted places caused by the terrain complexity or imperfect DTM. During the cleaning process of the orthophotomaps view, the individual places on it were scanned and the retouching of major dirt was performed (dust, hair).
If necessary, some places on the orthophotomap were densitely aligned, so the total orthophotomap gave compact impression. Appendix 1 shows a sample before and after the final treatment.
The final products of the orthorectification were the individual map sheets of orthophotomaps with a resulting resolution of 1 m for orthophotomaps from pre-war period and 0.50 m for orthophotomaps from the post-war period, in the map sheets layout 1:5000 in the S-JTSK coordinate system, compressed TIFF format, size from 6 MB to 10 MB with the relevant TFW file bearing the data of georeferencing.
The resulting positional accuracy of the orthophotomaps is di-rectly dependent on the AAT accuracy and DTM accuracy. Po-sitional accuracy was verified with existing map data by select-ing identical points evenly distributed throughout the area on both historical and contemporary ortophotomaps. Coordinates were checked at these points and the mean error was deter-International Archives of the Photogrammetry, Remote Sensing and Spatial Information Sciences, Volume XXXIX-B7, 2012
mined. (Table 3.)
Ortophotomaps Identical points
Mean positional error in meters
mx my mxy
Pre-war 23 1,29 1,34 1,32
Post-war 100 1,30 1,76 1,54
Table 3. Mean positional error in meters
3. RESULTS AND DISCUSSION 3.1 Changes in the riverbed and humidity conditions
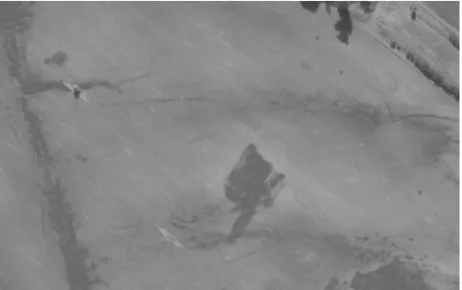
Investigated area is lowland and in the past river Šatava created meanders. The river was straightened later and agricultural cul-tivated area increased. Soils in the original river bed and the wa-terlogged area have different physical and chemical properties. The present Land Use are limited by different soil properties. Remote sensing in the near-infrared band shows the historic riverbed and waterlogged areas (Figure 4.)
Figure 4. Historic riverbed
3.2 Changes in forest area
The whole area was forested in the ancient past. After the arri-val of a man began deforestation. The process of afforestation or deforestation of small areas continues today. They form a compact forest units and have removed the small forest area. Deforested areas have different properties. Therefore, we can see the different areas in the near-infrared band. (Figure 5.)
Figure 5. Deforested area
3.3 Sand excavation
Specifics of the area are locations where sand has been excavat-ed. At first sand removed from the location, where farming had taken place, and subsequently the remaining pit was filled with sludge from the nearby sugar refinery in Židlochovice, with the land then forested via volunteer seeding. When the area of ara-ble land was increased in the 1970s, that land came under culti-vation and was not reclaimed. Although it is used for agricul-tural purposes today, under adverse moisture conditions cultivation is not possible. Any other use is therefore practically impossible. The entire process has taken place without clear ownership relations. (Figure 6.)
Figure 6. Sand excavation
4. CONCLUSIONS
Aerial photos in the near-infrared band well identify changes that are caused by different Land Cover earlier. Finding the origin of these differences in historical materials to determine the limits of today's recovery and prevent unsuitable Land Use. This procedure is suitable as a background document for devel-opment of regional plans and design of the land consolidation.
REFERENCES
Ferwerda, J. G., Skidmore, A. K. & Mutanga, O., 2005. Nitrogen detection with hyperspactral normalized ratio indices across multiple plant species. International Journal of Remote Sensing, 26 (18), p. 4083-4095.
Gojda, M., 2000 Archeologie krajiny. Academia, Praha, 240 p. Haboudane, D., Miller, J. R., Patey, E., Zarco-Tejada, P. J. & Strachan, I. B., 2004. Hypespaktral vegetation indices and novel algorihms for predicting green LAI of crop canopies: Modeling and validation in the context of precison agriculture. Remote Sensing of Environment, 90, p. 337 – 352.
Kubeš, J., 1996 Plánování venkovské krajiny. MŽP, Praha, 186 p.
Lipský, Z., 1999 Krajinná ekologie. Karolinum, Praha, 129 p. Reyniers, M., Vrindts, E. & DE Baerdemaeker, J., 2006. Comparison of an aerial-based systém and an on the ground continuous measuring device to predict yield of winter wheat. European Journal of Agronomy, vol. 24, no. 2, p. 87-94. International Archives of the Photogrammetry, Remote Sensing and Spatial Information Sciences, Volume XXXIX-B7, 2012
Zhang, P., Anderson, B., Tan, B., Huang, D. & Myneni, R., 2005. Potential monitoring of crop production using a satellite-based Climate-Variability Impact Index. Agricultural and Forest Meteorology, vol. 132, no. 3-4, p. 344-358.
5. APPENDIX 1
Example of historical orthophotomap:
Before correction
After correction