COMBINATION OF VIRTUAL TOURS, 3D MODEL AND DIGITAL DATA IN A 3D
ARCHAEOLOGICAL KNOWLEDGE AND INFORMATION SYSTEM
M. Koehl, N. Brigand
The Image Sciences, Computer Sciences and Remote Sensing Laboratory LSIIT-TRIO UMR 7005, INSA Strasbourg, France mathieu.koehl@insa-strasbourg.fr
Commission IV/5, 4, 1, 8, II/6, VI/1, 2: Web-based Virtual and Shared Geospatial Environments
KEY WORDS: Cultural Heritage, Three-dimensional, Modeling, Laser scanning, Interface, Visualization
ABSTRACT:
The site of the Engelbourg ruined castle in Thann, Alsace, France, has been for some years the object of all the attention of the city, which is the owner, and also of partners like historians and archaeologists who are in charge of its study. The valuation of the site is one of the main objective, as well as its conservation and its knowledge.
The aim of this project is to use the environment of the virtual tour viewer as new base for an Archaeological Knowledge and Information System (AKIS). With available development tools we add functionalities in particular through diverse scripts that convert the viewer into a real 3D interface. By beginning with a first virtual tour that contains about fifteen panoramic images, the site of about 150 times 150 meters can be completely documented by offering the user a real interactivity and that makes visualization very concrete, almost lively. After the choice of pertinent points of view, panoramic images were realized. For the documentation, other sets of images were acquired at various seasons and climate conditions, which allow documenting the site in different environments and states of vegetation. The final virtual tour was deducted from them. The initial 3D model of the castle, which is virtual too, was also joined in the form of panoramic images for completing the understanding of the site. A variety of types of hotspots were used to connect the whole digital documentation to the site, including videos (as reports during the acquisition phases, during the restoration works, during the excavations, etc.), digital georeferenced documents (archaeological reports on the various constituent elements of the castle, interpretation of the excavations and the searches, description of the sets of collected objects, etc.). The completely personalized interface of the system allows either to switch from a panoramic image to another one, which is the classic case of the virtual tours, or to go from a panoramic photographic image to a panoramic virtual image. It also allows visualizing, in inlay, digital data, like ancient or recent plans, cross sections, descriptions, explanatory videos, sound comments, etc.
This project has lead to very convincing results, that were validated by the historians and the archaeologists who have now an interactive tool, disseminated through internet, allowing at the same time to visit virtually the castle, but also to query the system which sends back localized information. The various levels of understanding and set up details, allow an approach of first level for broad Internet users, but also a deeper approach for a group of scientists who are associated to the development of the ruins of the castle and its environment.
1. INTRODUCTION
This project consists of a follow-up which began in 2010. The head of Thann (Ville-Thann, 2011), a little city in the south of Alsace, France, expressed the objective to develop its attractiveness. One of its important sites is the ruined castle of Engelbourg, built at the beginning of the thirteenth century. It is located at the top of a mountain so called “Schlossberg” (castle’s mountain). Its strategic location involved repetitive destructions during the seventeenth century until 1673 when Louis XIV ordered to destroy it in total. Nowadays, you couldn’t tell there was a castle there. However, a tower section remains and is quite well known: “l’œil de la sorcière” (the witch’s eye).
C. Steiner, the officer in charge of the economic development of the municipality decided to work on a patrimonial, artistic and touristic development of the site. J. Koch, an archaeologist working for the PAIR (PAIR, 2012) (Rhenish Interdepartmental Archeological Pole: a governmental structure dealing with the archeological sites and missions), is in charge of the archaeological studies. A. Fontaine, who is working on the valuation of the sites and collections of the PAIR took care of the spreading of the study. The LSIIT/TRIO team from the INSA of Strasbourg took part to this project through different graduation and research projects. The first step was the acquisition of the
geometry of the site by using TLS techniques, then to create a 3D model of it. A second step was to integrate two and three dimensional data into a Geographic Information System (GIS) (Berger, 2011). Set apart the recent works of the actual archaeologist in charge of the ruins, the only existing data of this site came from the archaeological excavations made by Ehretsmann in 1992 (Ehretsmann,1992).
This project has two main purposes. One possible direction was to work with the archaeologist in order to build a 3D model of the castle as it was in 1660, just before it was completely destroyed. This would consist in a virtual conception and construction by interpreting the few drawings and knowledge that exist today. The other direction was to go on with the virtual tour. The idea was to build a tour by using panoramas created from the pictures of the site. Those panoramas have to be linked to each other and the tour will present several ways to show and integrate other types of digital data. The 3D model should also be integrated into the tour as an additional source of information. Many other features could be created. The tour could also be linked to a database, to the web pages, etc. Virtual tours, 3D model and digital data were combined in this project in order to create an original type of 3D interface for a 3D Archaeological Knowledge and Information System (AKIS).
2. EXISTING WORK
2.1 Objectives
This scientific project is included in a global scheme. The Idea is to reinforce Thann’s attractiveness thanks to cultural means. This research is a first step. Creating an accurate Geographic Information System (GIS) and a 3D model of the site appears to be really useful for archaeologists or historians but also for the city itself. The goals of a first project were to acquire data and to build the GIS and the 3D model. A perspective of the project was the integration of a virtual tour of the site. This simple application created thanks to panoramas (made of pictures) was really efficient in terms of visualization and distant comprehension of the site. It is also crucial to be aware of the people we are working for. The GIS and the 3D model are very useful tools. However, the city head is looking for easy ways to make people discover the site and find disseminate information about it. The issue at stake here was to find out how to create an application that is not only accessible to everyone but also combines all different types of data (archaeological works and reports, pictures, 3D, 2D, etc.).
2.2 Data: surveying and treatment
First of all, the team had to acquire data by photogrammetry and TLS techniques. Then, after the treatment, a 3D model was created. The model is structured in layers and coded colours. Each sector is numbered and identified according to its position and function as the description given by Ehretsmann. Identification is then used to associate any type of data in digital form (drawing, photography, mode of assembly, drawing, collecting descriptive report, hyperlink to web page, etc.) to each constitutive element of the ruins.
This structure is very important for the case of model integration into an Archaeological Knowledge Information System (AKIS) especially in 3D-AKIS. The analysis capabilities of 3D-AKIS combined with a high performing documentation management system was used here to provide a tool for archiving and documentation, allowing full analysis of the complex structure. (Koehl at all, 2011).
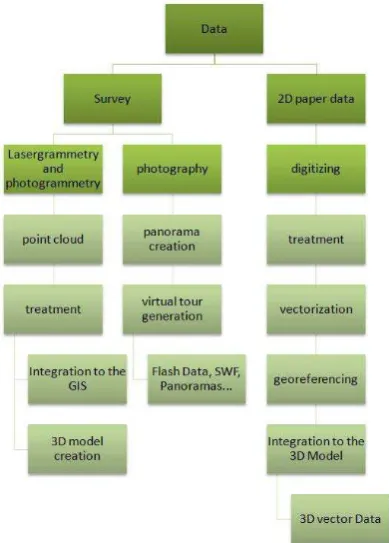
The Figure 1 shows the different steps to acquire all types of data, from the onsite survey to the 3D model and to the GIS, from existing 2D data to 3D vector data.
2.3 Virtual tour
The first virtual tour was created. It was quite simple, 12 panoramas made of pictures were linked to each other in a flash application which is readable in Adobe flash player. The link between the different scenes is available through hotspots. You can also switch from a panorama to another thanks to a Combo Box at the top of the viewer. This tour was created by means of the Kolor Panotour software. The used standard version was easy to exploit. A graphic interface helps the user to import panoramas and to create links between each of them. However, this version remains a bit limited. It is not possible to add any features. As a user of the standard version, it is not possible to get the XML file for adding exterior parameter. Those features are only available in the professional version.
The issue at stake here was to develop this existing tour. First of all the question was: how is possible to integrate the 3D model into the tour? To solve that problem we suggest the creation of panoramas from the 3D model.
Figure 1. Scheme of data (origin and treatment)
3. CREATING PANORAMAS: COMPUTER VISION BASICS
A definition of a panorama could be a view with a large angle. The concept is used in photography, in painting, drawing and also in cinema. There are many types of panoramas and several software packages (Kolor, 2012), (PTgui, 2012), (Hugin, 2012) are now quite developed to create them.
It is important to see the different types of panoramas, the data needed to create them, and how they are created, manually or automatically. In this part, we will give several examples of panoramas (with different formats) and explain a few basics to understand how they are created in software.
There are plenty of formats. The projection depends on the way the pictures of the scenes were taken, on the software used, or on the expected special effects. In some specific application, the use of any tie points is not required. For instance, it is possible to use a cubic projection if the panorama is generated thanks to six cube faces. There are other types of projections: the stereographic one, also called “little planet” that has the ground in the middle of the picture and the sky on the edges.
The examples below are just a few of them, extracted from the web site (Wiki.panotools, 2012) and the most cited in the literature.
Full Spherical Formats: There are two main spherical formats:
Equirectangular and Cubic. Both are able to display the whole sphere that surrounds us - 360° along the horizon, 90° up and 90° down. Specialized viewers are needed to view spherical panoramas. Kolor Autopano is able to do it.
Equirectangular Format is widely used by a couple of
Panorama Viewers as for example PTViewer and SPi-V. It consists of a single image with an aspect ratio of 2:1 (that is, the width must be exactly twice the height).
Cubic Format (Figure 2) uses 6 cube faces to fill the whole
sphere around the viewpoint. The image is remapped to the cube International Archives of the Photogrammetry, Remote Sensing and Spatial Information Sciences, Volume XXXIX-B4, 2012
faces which fit seamlessly. One very wide spread cubic format is QuickTime VR. It consists in one file containing the 6 faces as JPEG compressed images together with a header giving basic information how the panorama should be displayed.
Another cubic format is used by SPi-V. It consists in the 6 cube faces in a single row or column. SPi-V treats any image with an aspect ratio of exactly 6:1 as a cubic spherical panorama. This format is the one we finally used to create panoramas from the 3D model thanks to 6 exports. This part will be described later in this paper.
Figure 2. Cubic format: panorama made of 6 square pictures
There are a number of possibilities to display partial panoramas - these are panoramas that don't fill the whole sphere in one or the other way. Partial panoramas can be displayed directly if they don't cover more than approximately 120° along the shorter side (that is they can be 360° in one direction but must be 120° or less in the other direction). The main formats are Cylindrical and Rectilinear, but partial spherical panoramas are possible too.
Cylindrical panoramas can show a full circle along the horizon
or a part of it. They are very popular for landscape panoramas. If they are used for architectural subjects it might be of bother that horizontal lines, except the horizon itself are bent.
Rectilinear panoramas display the subject just like an ordinary
(non-fisheye) lens would do. The horizontal and vertical field of view are limited to about 120°. Straight lines stay straight; hence they are good for architectural subjects. But if either field of view is too large they suffer from unnatural looking distortions in the corners.
4. MATERIALS AND METHODS: CREATION OF THE VIRTUAL TOUR
4.1 Panorama creation
Kolor AutoPano Giga , PTGui and Hugin. PTGui and Hugin are really closed to each other to assemble a mosaic of photographs into a complete immersive panorama or to stitch any series of overlapping pictures. Before using a corner detector, the images have to be acquired. Those images must have a sufficient recovery to allow the software to find tie points. It has to cover the whole view.
After that, there are settings to pay attention to: • Quality of detection
• Number of tie points
• Type of point of view (single or multiple) • Corrections
• Type of algorithm
• Projection
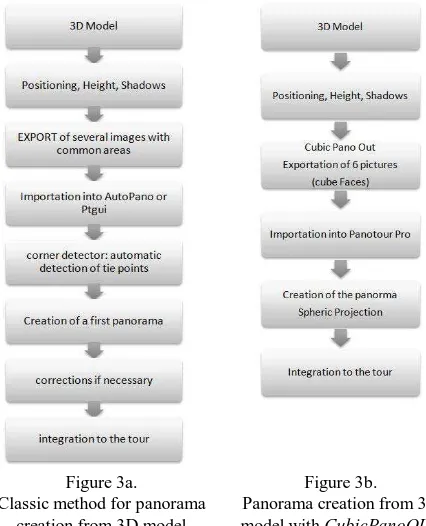
It is possible to create a panorama of a virtual model in the same way as with real pictures. In this case, there are still a few problems remaining, but we can assume that it would be easier with the real model which would present more characteristic points. However, there are many steps to create one single perfect panorama (detailed in the following scheme, Figure 3). The issue at stake here is to find a more efficient way to create panoramas from the 3D model in order to be able to recreate them easily if necessary. One option was to export the model to 3DS format. This software proposes an application dedicated to the creation of panorama from a 3D model from a given point of view, with parameters you enter. Because of the size of the model the export was still difficult. By size, we mean complexity, which implied a huge time to export the data even with a professional device. One single change on the 3D model would have implied another export of the model which was also not efficient enough. The next part will deal with a second option using a Google Sketchup plug-in called CubicPanoOUT which will give a solution to this problem of efficiency.
4.2 CubicPanoOUT: creation of panorama from 3D model
After researches we figured out that there were no way and no plug-in to create panoramas directly from Google Sketchup. However, there is a script proposed by J. Wehby which was supposed to export JPG cube images for the creation of panoramas. This plug-in you can use after copying it into Sketchup roots file will allow you to export six square images from a given point of view. Those pictures have no “common area”. It is then not possible to build panoramas thanks to corner detector as we described before because no tie points are available. However, it is possible to apply a mathematical transformation to the six pictures to create a cubic panorama. The following six pictures we extracted from the test model thanks to CubicPanoOUT (Figure 2). The Figure 3 sums up the two ways to extract panoramas from a 3D virtual model.
Figure 3a.
Classic method for panorama creation from 3D model
Figure 3b. Panorama creation from 3D model with CubicPanoOUT International Archives of the Photogrammetry, Remote Sensing and Spatial Information Sciences, Volume XXXIX-B4, 2012
4.3 Data linking
Once we get our panoramas made of pictures and from the 3D model, we use Kolor Panotour Pro to create the tour. There is also an extension called krPano to add features to the tour by modifying the XML code. The development is based on the krPano tools (Kolor, 2011): krPano has a small and simple dynamic scripting language, can be customized in many ways and uses command or function called action. It is possible to use existing actions and also to define new ones. Then, the system can be encapsulated in an HTML page, so as to be passed on and be accessible via an internet viewer or other devices like iPhone or iPad. The interactions between the entities can be statically described in XML pages or dynamically manipulated with help of krPano actions (krPano, 2011).
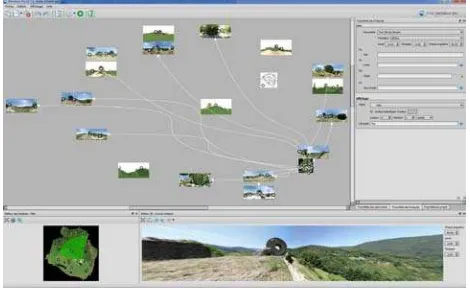
The software is quite simple to use. A main window shows all the data imported into the project (panoramas or other 2D data). After that, you create links between the panoramas by adding “hotspots”. These hotspots are entities you click on in the tour in order to activate a link. The link can lead you to another panorama, to a picture, to a web site, etc. It can consist in an animated spot, a geometric shape: point, surface, and it can be visible or not. The different characteristics are illustrated and described in the Kolor Panotour pro help or forum web pages (KolorHelp, 2012). We can see there the different types of data integrated, panoramas from images, from 3D model, maps, other digital data work (Figure 4).
Figure 4. Screenshot of Kolor Panotour pro environment
5. ARCHAEOLOGICAL KNOWLEDGE AND INFORMATION SYSTEM
5.1 Data
The idea of the tour is to be able to deal with all types of data. That’s why the aim of this project was to test all the ways to integrate photographic panoramas and panoramas generated from the 3D model, 2D data and documents, text and links into the tour. The Figure 5 illustrates the different data types and links to the virtual tour.
2D documents: The idea of integrating 2D data into the virtual tour is a way to combine the augmented reality created through panorama to other types of information. A 2D document could be a drawing, a picture, a map, a scheme, etc. It is a way to integrate data which would have many different contains and purposes. However, even if this integration offers interactivity with the user, a question remains: is it the most efficient way to show the data? For instance, if we consider a set of pictures, wouldn’t it be easier to orientate the user to another page or link which would
contain the whole set of pictures? The more there is integrated information, the bigger and the more complex the tour will be.
Figure 5. Links between virtual tour and external datasets
Other datasets: By data, there was also the idea of integrating information in form of text format and through links to the Internet. There are several ways to do it thanks to Kolor Panotour pro, but it remains obvious that the software is more efficient with pictures and panorama. For instance, it would be much more efficient to integrate text with the aid of a PDF document than by using the HTML format. Kolor Panotour pro is also able to deal with many other formats. For instance, it is also possible to integrate videos, music or sounds in MP3 format. This could be useful to integrate oral comments to the tour.
5.2 Data linking and augmented reality
The Kolor Panotour pro version offers a lot of tools. On the following screenshot, we can see for elements integrated into the generated test tour. For example, a Combo Box allows the user to choose the panorama he wants to see by selecting in the list. Orientation arrows, zoom in, zoom out and other tools are available thanks to icons at the bottom of the screen. Thus tow new elements appear:
• A bar (hidden or visible) presenting all the panoramas and documents of the tour. The user will be able to move to the information by clicking on one of these thumbnails.
• A map, with hotspots and radar. The user can move from a panorama to another through the global map. He is also able to orientate himself thanks to the animated hotspot he is on and thanks to the radar giving the view direction.
The size of this map can be chosen. It will be bigger while used and smaller in the corner if it is not used. Having those orientation tools, the tour becomes more interactive. As far as the user has many options to travel through the tour, it becomes possible to deal with more data. The Figure 6 illustrates the virtual tour which can be integrated in a web browser environment. However, as we know that the virtual tour is far more efficient with visual data, and considering that it is quite easy to create links from the tour to the internet, we could consider another way to show data: a web site.
Figure 6. Virtual tour environment
5.3 Creating a web environment linked to the tour
Nowadays, more and more information is available on the net. It was quite obvious that the tour would have been available through the internet. So, the idea of using the net as another way to show data was significantly developed. This web site was created in order to test all the different ways to create links between the tour and the internet. A lot of pages were created. However, it is sufficient to show that creating a little web site becomes easier and easier and that it is a good way to show 2D data, text, documents, etc… It’s also much easier to actualize and to integrate temporary information. The global scheme which could be followed by the user and which would define data organization could be illustrated with the following Figure 7.
Figure 7. Virtual tour environment
Web environment: the web site is composed of different
categories which structure the site. The Figure 8 is an illustration of the home web page. The website offers also a lot of information pages about the history of the site, the archaeological works and interpretations, the 3D model acquired and built and also many videos of the different steps and parts of the 3D modelling as well as a report of the different surveying phases of the ruins.
5.4 Links between tour and website
5.4.1 Links from tour to web pages
It is quite easy to create the link between the tour and the internet. Actually, there are four ways to generate this link.
• Open in a new window • Open in the window itself • Open in the parent window • Open in the top window
We used it to create links with the City of Thann official website (Ville-Thann, 2011), with the Wikipedia web page and with the
Engelbourg newly created website itself. On each of them, by clicking on a hotspot, the user will open a new window in its navigator which will directly go on the chosen website.
Figure 8. Website home page
5.4.2 Links from web pages to tour
There are also many ways to create links between the website and the tour. We used two of them as example in the Engelbourg website: Open the tour in a new window or open the tour into the window in a dedicated area.
6. RESULTS
As a result, we could conclude that this project was a good way to explore all the tools available to navigate into a tour. The idea was to try all of them, and to choose those which are the most efficient. The tour, as it is now, works quite well. But the link with the internet has to be developed. There are also other ways to integrate more efficient tools and features: KrPano. This extension of Kolor Panotour pro allows the programmer to write code to develop its own tools. Considering that additional data should be easily added to the tour an automated process has been developed.
7. CONCLUSION AND PERSPECTIVES
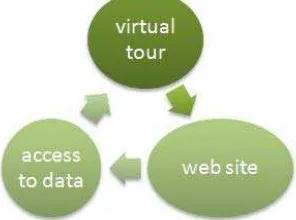
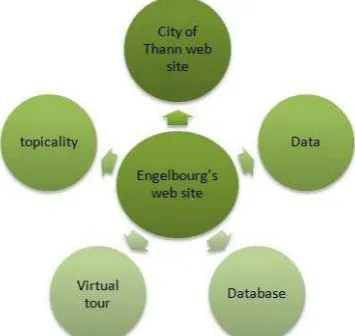
This project is integrated into a global will: to enhance the town attractiveness by improving access to such sites. The creation of a website was a way to think the whole structure differently. A global structure, combining the centralization and the communication of the data could be created. This entity could be a website. There are two options. The site of Engelbourg can be specific and linked to City of Thann website. The access to the tour, to the data through a database (CMS) or to updates would then be easy. The Figure 10 illustrates such a structure and the different links between the constituent entities. However, in this context, such a structure could appear to become complex as long as the site of Engelbourg is not the only thing the town focuses on.
Another solution consists in a global information system, dealing with a database gathering all the data of any different fields, sites, and types. This global website (Figure 11) should have a special structure to be able to deal with web simple users but also administrators. The manager of the site or of the database has to be given special rights to add or modify data.
Figure 10. First architecture of information system
Figure 11. Global architecture of information system
More specifically, the tour has been improved by adding data: other panorama and pictures taken at different seasons, other 2D data, text and explanations, etc. It also gives the possibility to generate the virtual tour and to access to the website on an iPad or other mobile device. Guides of the archaeological site could then use this application as a real source of information while showing the site. The tour would then become more interactive. A problem remains: to be able to update information regularly and to add features to the tour, a process must be created to optimize the generation of the tour. It would then be possible to add fresh news or temporary data very easily.
As far as the 3D model is concerned, the integration of archaeological models and theories would bring a special interest. However the idea of an automated process to update the data from the 3D model into the virtual tour is still an unsolved problem.
Acknowledgements
Thanks to the City of Thann, Alsace, France for the financial support of this research collaboration.
Thanks to Mrs. C. Steiner, in charge of the valorization of the Engelbourg, for his active collaboration, experience and knowledge sharing.
References from Journals:
Chiang, C.-C., Huang, A., Wang, T.-S., Hsieh, J.-W., Chen, J.-W., Cheng, T., 1997. PanoVR SDK - a software development kit for integrating photo-realistic panoramic images and 3-D graphical objects into virtual
worlds. VRST '97: Proceedings of the ACM symposium on Virtual reality software and technology. New York, NY, USA. Koehl, M., Berger, S., 2011. 3D Model supports archaeological knowledge base. In: XXIIIth CIPA International Symposium, Prague, Czech Republic. Sept. 12-16th 2011, CIPA Int. Archives for Documentation of Cultural Heritage, Vol. XXIII-2011, 8 pages, (on CD-ROM).
Liu, J., Cui, D., 2004. Walkthrough Technology in Panorama-based Multi-viewpoint VR Environment.College of Computer, Xi'an University of Technology.
Liu, P., Sun, X., Georganas, N.D., Dubois, E, 2003. Augmented reality: a novel approach for navigating in panorama-based virtual environments (PBVE). HAVE 2003. 2nd IEEE international workshop. Sch. of Inf. Technol. & Eng., Ottawa Univ., Ont., Canada. pp. 13-18.
Othman, Z., Yaakub, A.R., Zulkifli, A.N., 2002. Virtual Environment Navigation Using an Image-Based Approach. SCOReD 2002, Sch. of Inf. Technol., Universiti Utara Malaysia, Malaysia, pp. 364-367.
Vlahakis, V., Ioannidis, M., Karigiannis, J., Tsotros, M., Gounaris, M., Stricker, D., Gleue, T., Daehne, P., Almeida, L., 2002. Archeoguide: an augmented reality guide for archaeological sites. Computer graphics and applications, IEEE 2002, pp. 52-60.
References from Books:
Ehretsmann, M., 1992. Rapport de fouilles programmes, Thann, Engelbourg. Direction Régionale des Affaires Culturelles d’Alsace, Service Régional d’Archéologie. 151 pages.
References from Other Literature:
Berger, S., 2011. Etude de la modélisation d’une maquette 3D et de l’intégration de données. Application au projet archéologique et patrimonial de Thann (Alsace). Diploma Thesis at INSA de Strasbourg, Sept 2011, 60 pages.
References from websites:
Google Sketchup, 2011. Google SketchUp software’s website. ur
Hugin, 2012. Hugin – panorama photo stitcher. ur
Kolor, 2011. Kolor products website, Autopano, Panotour and other.
ur
KolorHelp, 2012. Kolor Panotour Help and forum web pages. ur
KrPano, 2011. KrPano’s website. ur
PAIR, 2012. PA1R official website.
ur Pano2vr, 2011. Pano2vr’s website.
ur PTgui, 2011. PTgui’s website ur
Sketchucation, 2011. Google SketchUp, user’s Forum. ur
Ville-Thann, 2011. Thann’s official website, Alsace. ur
Wiki.panotool, 2012. Pano Tools wiki. ur