SURVEYING MEDIEVAL ARCHAEOLOGY: A NEW FORM FOR HARRIS PARADIGM
LINKING PHOTOGRAMMETRY AND TEMPORAL RELATIONS
P. Drapa∗, O. Papinia, E. Prunob, M. Nucciottib, G. Vanninib
a
Aix-Marseille Universite, CNRS, ENSAM, Universite De Toulon, LSIS UMR 7296, Domaine Universitaire de Saint-Jerome, Batiment Polytech, Avenue Escadrille Normandie-Niemen, 13397, Marseille, France ([email protected])
bUniversity of Florence, SAGAS Department, Italy
Commission II
KEY WORDS:Medieval Archaeology, Harris Matrix, Close-Range Photogrammetry- Ontology, Time representation
ABSTRACT:
The paper presents some reflexions concerning an interdisciplinary project between Medieval Archaeologists from the University of Florence (Italy) and ICT researchers from CNRS LSIS of Marseille (France), aiming towards a connection between 3D spatial representation and archaeological knowledge. It is well known that Laser Scanner, Photogrammetry and Computer Vision are very attractive tools for archaeologists, although the integration of representation of space and representation of archaeological time has not yet found a methodological standard of reference. We try to develop an integrated system for archaeological 3D survey and all other types of archaeological data and knowledge through integrating observable (material) and non-graphic (interpretive) data. Survey plays a central role, since it is both a metric representation of the archaeological site and, to a wider extent, an interpretation of it (being also a common basis for communication between the 2 teams). More specifically 3D survey is crucial, allowing archaeologists to connect actual spatial assets to the stratigraphic formation processes (i.e. to the archaeological time) and to translate spatial observations into historical interpretation of the site.
We propose a common formalism for describing photogrammetrical survey and archaeological knowledge stemming from ontologies: Indeed, ontologies are fully used to model and store 3D data and archaeological knowledge. Xe equip this formalism with a qualitative representation of time. Stratigraphic analyses (both of excavated deposits and of upstanding structures) are closely related to E. C. Harris theory of “Stratigraphic Unit” (“US” from now on). Every US is connected to the others by geometric, topological and, eventually, temporal links, and are recorded by the 3D photogrammetric survey. However, the limitations of the Harris Matrix approach lead to use another representation formalism for stratigraphic relationships, namely Qualitative Constraints Networks (QCN) successfully used in the domain of knowledge representation and reasoning in artificial intelligence for representing temporal relations.
1. INTRODUCTION
The paper presents a first reflexion based on sixteen years of inter-disciplinary cooperation between Medieval Archaeologists from University of Florence (Italy) and ICT researchers from CNRS LSIS of Marseille (France), aiming towards a connection between 3D spatial representation and archaeological knowledge for in-terpreting the Mediterranean Middle Ages (Drap et al., 2005). In the last decade, we witnessed the significant improvements of photogrammetric technics, starting with SIFT descriptor in 2004 (Lowe, 2004), that allows for automatic matching of thousands of homologous points. This opens the way to more automatization of the photogrammetric process, autocalibration and automatic 3D dense cloud generation. These new photogrammetric tools, which now can easily replace the terrestrial laser scanner still used at the beginning of this new century in archaeology, bring with them the same lack as with laser scanner: no semantic data is linked with this accurate and plethoric geometry.
At the same time the stratigraphic analysis applied to upstand-ing buildupstand-ing in the framework of medieval archaeology is from one hand absolutely mandatory and on the other hand seems to have reached a crucial point of its evolution. Italian Medieval Archaeology, in parallel with a close relationship with histor-ical research, contributed to the development of archaeologhistor-ical methodologies at European and world level. A specific and par-ticularly outstanding contribution was provided in the field of
∗Corresponding author
non-destructive urban and territorial analyses. Such was indeed the (successful) attempt to embed the stratigraphic theory in the study of historical buildings, extending the principles of site-formation-process to the architectural-site-formation-process. Based on the outcome of a pioneer study carried out in ’970s by Tiziano Mannoni, and on a further methodological definition carried out in the Eighties , it was finally possible to establish a standard set of techniques for the stratigraphic investigation of medieval (and historic) buildings. An achievement of particular importance since, for the first time, a non-destructive archaeology could build reliable stratigraphic sequences at territorial scale.
Since some decades, the Harris Matrix approach (Harris, 1979) has been extensively used for stratigraphic analysis. The trans-lation of the Harris paradigm in upstanding structure (Brogiolo, 1988), i.e. in full 3D context, brings some inconsistencies which become more and more visible with the development of new 3D surveying tools. Many scholars argue on the possibility to in-crease the Harris Matrix with specific fields suitable for better defining and analysing upstanding buildings stratigraphy (in Italy, where the upstanding building stratigraphy is very used, espe-cially among medieval archaeological researches, see the status question is in Gallina (Gallina, 2012)). In the same time, the re-cent advance on Knowledge Representation, as the development of Ontologies also in Cultural Heritage, changes the way to man-age knowledge and extends the possibilities to connect with other research fields.
stratigraphy in order to propose a new representation of tempo-ral relations stemming from tempotempo-ral qualitative networks thanks to the Allen’s approach . This is done by developing a com-mon framework describing knowledge used in photogrammetry as well as in stratigraphy fully based on ontologies. An Ontol-ogy describing the photogrammetric process and the measured artefacts (ashlar bloc, observed relevant surface and then Strati-graphic Unit and connected concepts) is aligned on the well-known ontology used now since a long time in Cultural Heritage: CIDOC CRM (Doerr, 2001). First of all, we try to obtain the following results (like suggested by (Gallina, 2012), p. 80):
1. Maximum readability and immediacy of the drawings and schedules, avoiding, as much as possible, obscure symbol-ism and hypertrophy of the documentation
2. Simultaneous presence in the same media of all kinds of information (text, drawing, pictures), in order to really sim-plify the information sharing. It is evident that the Harris Matrix itself is not too much self-evident and insignificant, and that the US cards without photographs and drawings are equally unclear. This rigid separation of the information must be tackled
3. The formalism used to store and represent this complex and heterogeneous knowledge cannot be rigid and too much structured because archaeological data and the knowledge itself are changing over time (Drap et al., 2007).
The significant development done in CIDOC CRM (Niccolucci et al., 2015) (and now with CIDOC- CRMBa, an extention in the field of building archaeology (Ronzino, 2015))is very useful also to explore some theoretical concepts underlying the construction of the Harris Matrix. We have developped an ontology to repre-sent both the photogrammetric process and the measured objects, here ashlar blocs and stratigraphic unit. The objects here are mod-elled according to the point of view of the measurement process but indeed these artefacts or concepts as stratigraphic unit can be seen also under the point of view of Cultural Heritage or conser-vation. This is the reason why we have aligned our ontology on CIDOC CRM.
The case study of this work is the Castle of Shawbak in Jordan where the University of Florence is working since almost thirty years and LSIS since sixteen years (Vannini et al., 2009). We are thus working on a huge quantity of data acquired over time according to the evolution of the technology and the team evalu-ation. We present in this paper both photogrammetric survey and their link with archaeological data through a common formalism based both on pure XML and on ontology.
2. TIME IN ARCHAEOLOGY
The topic of time in archaeology is most important and very complex, though it has been too often neglected. The work conducted by G. LucasThe archaeology of time(2005, and see here for previous bibliography) has been, until now, the most exhaustive presentation and reflection about it. Following Lucas, time is a theoretical concept used in different way in contempo-rary archaeology, but its meanings are not always discussed in archaeological researches. Taken for granted that archaeology, like all the historical disciplines, is strictly concerned by time, in which sense this concept is used in archaeological researches? We can consider some very normal and usual assertion that all
archaeologists use in their works:
1. These food vessels are a feature of the Ayyubid. 2. US 23 is more recent than US 28
3. Structure B has origins in 12th century.
All these examples express basically the same conception of time as chronology. Chronology, according to the Oxford English Dictionary, is the science of computing dates, and all the different terms in the examples refer to different dating systems or chronologies that archaeologists have constructed. Different chronologies are used for different contexts and each of the examples and there could have been many more refer to chronologies of varying applicability, from site specific (e.g. US 23) to universal (e.g. 12th). The key axis that differentiates all archaeological chronologies, however, is the distinction between absolute and relative chronologies. By an absolute chronology, is meant a chronology based on a time framework that is independent of the data being studied typically, this is expressed through the calendrical system, with dates in years AD/BC or BP. In contrast, a relative chronology is one based on the inter-dependence of the data being studied this can be anything from stratigraphy to periodization. Here, the chronology of the data is solely expressed relative to other data(Lucas, 2005) p. 3). As we see, the first step of every archaeological research is to aim at building a chronology, both relative and then absolute. More deeply, both of them are strictly connected with a specific concept of time that is linear and both of them are subdivided in single units that are discrete and they dont overlap: most of what, conventionally, we call relative chronologies, are ordinal systems that is, chronologies that have direction but units of non-specific duration while interval systems, usually absolute chronologies, do have units of specific and equal duration.(Lucas, 2005), p. 8. Regarding the relative chronology, Harris, during the second half of last century, has introduced a very innovative system. In 1979 he published the first textbook devoted to the science of archaeological stratigraphy, where he defined the concepts of units of stratification (US, both deposits and interfaces) and the main important stratigraphical rules. The physical relationships between deposits and interfaces aim the archaeologists to deduce the stratigraphical relationship, thats means, in other words, the relative chronology of the US. To allow archaeologists to organize all the stratigraphical relationships between the different US, Harris designed also a diagram, the Matrix. The Matrix changed the paradigm of the archaeology from the one-dimensional concept embodied in the Wheelerian section drawing to a four-dimensional model that combines the three physical dimensions with that of time, the forth dimension. In this sense, it is like the clock face of twelve hours and the Gregorian calendar of a twelve-month year, which are diagrammatic ways in which time, which does not exist in any material form, can be seen. More than any other science, archaeology is a time-related discipline and the Harris Matrix has given that emphasis a rev-olutionary force in its ability to translate the physical evidence of stratification into calendar of relative time, unique to each site, but universally comparable through the Matrix diagrams.
(Harris, 2003) p. 10.
And this has been a major criticism of the matrix that it does not refer to how long a deposit took to form or how long a structure was in use (Lucas, 2001), p. 161-2. This criticism is more yet relevant when we consider not only a single feature, like the example of a floor, but the a more complex situation like the following example: The house where I am writing this paper was built towards the beginning of this century, in the courtyard of an ancient farm whose structure is still visible. From my open window, I see an interweaving of houses and constructions, most of them dating back to the 19th century, sometimes including parts of earlier constructions from the 18th or 17th century. The 20th century here looks so localized, so secondary: it is reduced to details, such as windows, doors or, within houses and flats, furniture. Right now, the present here is made up of a series of past durations that makes the present multi-temporal.
But, despite the lack of the concept of duration, the Harris Matrix is until now an useful tool to analize archaeological stratigraphy. And since representing space equals, in archaeology, to repre-senting time, after 2009 (Drap et al., 2009) (Pruno and Drap, 2012) our team started to work on the modeling of Archaeo-logical Time, in order to embed this aspect within the system and to eliminate the separation of duration from sequence in the temporality of a site, especially trying to include developing a tool for the automated elaboration of Harris Matrixes as well as the integration of non linear Time Models (Althusser, 1969) (Nicolis and Prigogine, 1977) (Allen, 1983) (Lucas, 2005) into the chronological structure of the Harris Matrix itself.
Chronology is indeed too limited a model for representing the archaeological time as it is for Time itself and its use for interpreting the past may heavily bias our full understanding of any archaeological history.
3. PHOTOGRAMMETRY AND TIME
Specific photogrammetry tools dedicated to stone by stone mea-surement have been under development since 2002 to help ar-chaeologists to easily produce photogrammetric surveys. These tools are now integrated in a more complex system which allows automatic production of 2D or 3D representations from archae-ological database queries. The graphic 2D documents produced through this process look like the handmade drawings done by archaeologists using ortho-rectified photos.
The 3D GIS, merging photogrammetry and ontologies, is the last step of this chain and aims at the automatic production of 3D models through archaeological database queries: These 3D mod-els are in fact at the same time a graphic image of the database and the actual interface through which the user can edit the dataset.
This approach enables automatic 3D thematic representation and new archaeological analysis, through bidirectional links between 3D representation and archaeological data
We propose now to work on the link between 3D measurement and temporal relations. Indeed, archaeologists use a set of rules to determine temporal relationships by observing physical rela-tionships. The table below describes the physical conditions nec-essary for establishing the temporal relationships. The temporal relations are deduced from the physical relations, and, often these physical relations can be deduced from the relative position of the US between them using the photogrammetric measurement of their components. As the US are built on measured objects it will be possible to compute the veracity of the physical relations
on the one hand to deduce the temporal relations if they have not been informed by the archaeologist or to ensure a coherence of Time relations .
Physical relations Stratigraphical relations Gli si appoggia (ad A si appoggia B) A Anteriore B Coperto da (A coperto da B) A Anteriore B Tagliato da (A tagliato da B) A Anteriore B Riempito da (A riempito da B) A Anteriore B Appoggiato a (A appoggiato a B) A Posteriore B Copre (A copre B) A Posteriore B Taglia (A taglia B) A Posteriore B Riempie (A riempie B) A PosterioreB Uguale a (A uguale a B) A Contemporaneo B Legato a (A legato a B) A Contemporaneo B Collegato a (A collegato a B) A Contemporaneo B
Table 1. Links between physical relations and stratigraphy
3.1 Ontology
This work is based on a close link between, on the one hand, the software engineering aspects and the operative modeling of the photogrammetry process, the needed computation and arte-facts measurable by photogrammetry in the context of this project and, on the other hand, with the ontological representation of the same photogrammetry process and surveyed artefacts. The present implementation is based on a double formalism, JAVA, used for computation, photogrammetric algorithms, 3D visual-ization of photogrammetric models and Cultural Heritage objects, then OWL for the definition of ontologies describing the concepts involved in this photogrammetric process as well as the surveyed artefacts.
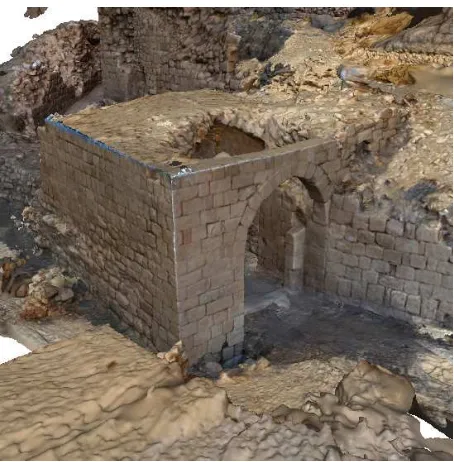
Figure 1. High resolution photogrammetric survey used to extract relevant archaeological artefact.
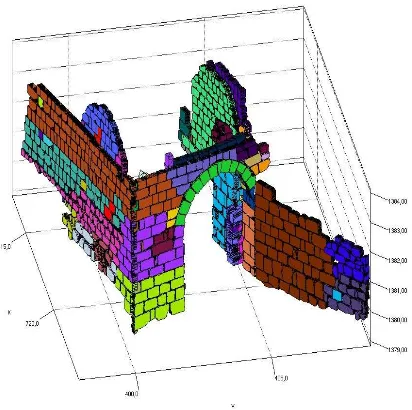
Figure 2. Stratigraphic units identified by their ashlar blocs when they are positive.
The same point of view presides over the elaboration of the JAVA taxonomy, but software engineering constraints involve differ-ences in the two hierarchies of concepts. For each ontology con-cept a procedural attachment method has been developed with OWLAPI. As each concept present in the ontology has an ho-mologous class in the JAVA tree each individual of the ontology can produce a JAVA instance and can take benefit from its com-putational capabilities. In the same way, each JAVA class has a counterpart in the ontology and can produce an individual of that ontology.
Thus, reading an XMl file used to serialize a JAVA instance set representing a statement can immediately (upon reading) popu-late an ontology; similarly reading an OWL file can generate a set of JAVA instance counterparts of the individuals present in the ontology. The link between individuals and instances persists and it can be used dynamically. The huge advantage of this ap-proach is that it is possible to perform logical queries on both the ontology and the JAVA representation. We can thus read an on-tology, visualize in 3D the artefacts present in the ontology and graphically visualize the result of SQWRL queries in the JAVA viewer.
Here the photogrammetric survey is expressed as an ABox: An ontology describing the photogrammetric process as well as the measured objects was populated by the measurements of each block and a set of corresponding data (USM owner, etc.).
It is therefore this ontology which contains the metric informa-tion as geo-posiinforma-tioning of each block and all the physical and stratigraphic relationships provided by archaeologists.
The reading and the geometrical interpretation of this ontology can lead us to validate or invalidate the physical relations by a topological analysis of the relations between the various compo-nents of the USM but also to check the temporal relations consis-tensy by extracting a graph of Constraints and then using a logical solver.
Moreover, a first possible interpretation of these data should be the generation of a graph of temporal relations where the nodes,
instead of having a coded position as in the Harris graphs, should have as the coordinate of the USM center of mass projected in USM main plane.
As illustrated in Figure 3, the graph is superimposed on an unreal-istic representation of the stone-to-stone reading of the building.
Figure 3. Positive stratigraphic relations with the USM node coordinate comming from photogrammetric measurement.
The ontology developed in the framework of this project takes into account the manufactured items surveyed, as well as the method used to measure them; in this case, photogrammetry. The surveyed item is therefore represented from the measure-ment point of view and has access to all the photogrammetri-cal data that contributed to its measurement in space. Two on-tologies are aligned in this context; one dedicated to photogram-metrical measurement and the geo-localisation of the measured items, whereas the other is dedicated to the measured items, prin-cipally the archaeological artefacts, describing their dimensional properties, ratios between main dimensions, and default values. These ontologies are developed closely linked to the Java class data structure that manages the photogrammetric process as well as the measured items. Each concept or relationship in the on-tology has a counterpart in Java (the opposite is not necessarily true). Moreover, surveyed items are also archaeological items studied and possibly managed by archaeologists or conservators in a museum. It is therefore important to be able to connect the knowledge acquired when measuring the item with the on-tology designed to manage the associated archaeological knowl-edge. CIDOC CRM is a generic ontology that does not support the items that it represents from a photogrammetric point of view, a simple mapping would not be sufficient and an extension with new concepts and new relationships would be necessary.
(Hue et al., 2011) (Papini and Drap, 2009) (Seinturier, 2007) (Ser-ayet et al., 2011).
The extension of the CIDOC-CRM ontology is structured around the concept E22 Man-Made Object. The root ofItemMesurable
developed in this project extends this concept. The mapping op-eration is done in Java by interpreting a set of data held by the Java classes as a current identification of the object: 3D bound-ing box, specific dimension. These attributes are then computed in order to express the right CRM properties.
Several methodologies can be chosen regarding mapping two on-tologies. For example, Nicola Amico and his team (Amico et al., n.d.) choose to model the survey location with an activity (E7) in CRM. They also developed a formalism for the digital survey tool mapping the digital camera definition with (D7 Digital Ma-chine Event). We see here that the mapping problem is close to an alignment problem which is really problematic in this case. Aligning two ontologies dealing with digital camera definition is not obvious; a simple observation of the lack of interoperabil-ity between photogrammetric software shows the wildness of the problem. We are currently working on an alignment/extension process with Sensor ML which is an ontology dedicated to sen-sors. Although some work have already been achieved (Hiebel et al., 2010), (Xueming et al., 2010), but not enough to clearly hold the close range photogrammetry process, from image measure-ment to artefact representation.
In addition we use the concepts of time representation present in CIDOC CRM in order to represent the Harris relations and then Allen’s formalism about the time intervals.
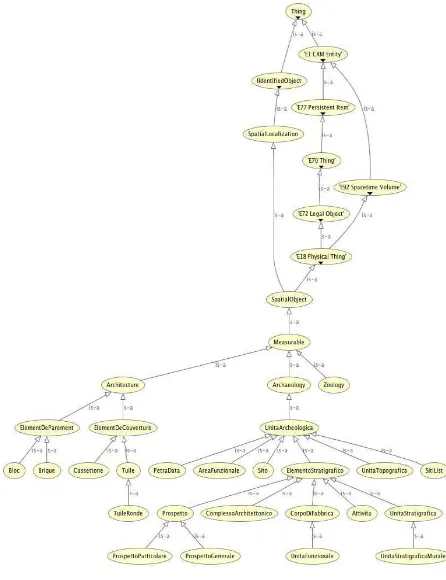
Figure 4. Partial ontology visualization with CIDOC CRM aligmenent.
4. STRATIGRAPHY
4.1 Positive and negative US
Since representing space equals, in archaeology (and not only), to representing time, after 2009 (Pruno and Drap, 2012) (Drap et al., 2009) we started to work on the modeling of Archaeological time, in order to embed this aspect within the system.
By analyzing and breaking up an archaeological deposit into ba-sic, discrete stratigraphic units, archaeologists are able to create (relative) chronologies of all activities performed (by man or by nature) on a site over time, in order to describe and interprehem.
Following the definition by (Harris, 1979) and further develop-ments by (Harris, 1979) (Mannoni, 1976) and (Brogiolo, 1988), stratigraphic units, or contexts, are those material traces of past events which have been preserved in the archaeological record. They can be positive (i. e. Layers), negative (i. e. Cuts) or neutral (i. e. Interfaces). By analyzing and breaking up an archaeological deposit into basic, discrete stratigraphic units, archaeologists are able to create (relative) chronologies of all activities performed (by man or by nature) on a site over time, in order to describe and interpret it. Stratigraphic units are eventually placed into a Harris Matrix, a conceptual scheme of stratigraphic relationships which is the backbone of historical interpretation of almost every archaeological site excavated after 1980s.
As regards to that, until now, we have been working mostly on the survey and representation of positive USM, although since 2009-10 the research for modeling negative and interface units was also started (see figure 5).
The latter ones are in fact 3D surfaces (not volumes) possessing stratigraphic relationships with other units. They are not formed by ashlars and mortar, since they are only signs of, say, a de-struction, like with the traces left by an earthquake or by human (partial to total) destruction of a material feature. Picture 5 shows a negative USM represented by a cloud of 3D points extracted us-ing the perimeters drawn on the photographs by an archaeologist.
Figure 5. Negative USM represented by the set of 3D points extracted using the perimeters designed on the photographs by
archaeologist.
4.2 Toward duration for representing Stratigraphic Unit
Indeed infering all the Allen’s relations directely from the physi-cal relations between US is not trivial and currently the only way to do that is using the expertise of archaeologist.
Nevertheless we start with a few deduced relationships from Har-ris formalism to Allen’s one. Considering a Stratigraphic Unit A it should have a start point named Aminand an end point named Amax.
For example, the Harris relationA is Contemporaneo to Bcan be translated byA starts Bin Allen’s relations and the Harris relation
A Anteriorita Bcan be translated byA precedes BorA meets B. using the bound of intervals as expressed in Table 2.
Stratigraphical relations Start and end of US A Contemporaneo B Amin= Bmin A Anteriore B Amaxanterior Bmin
A Anteriore B Amax= Bmin
A Posteriore B Bmaxanterior Amin
A Posteriore B Bmax= Amin
Table 2. Harris relations seen from an interval point of view.
In order to represent the Stratigraphic Unit duration, using time intervals we use Qualitative Constraints Networks (QCN) suc-cessfully used in the domain of knowledge representation and reasoning in artificial intelligence for representing temporal re-lations. The Allen’s intervals algebra has been used for repre-senting and reasoning with archaeological information in the con-text of archaeological documentation (Accary-Barbier and Cal-abretto, 2008), dating process (Belussi and Migliorini, 2014), however as far as we know this forrmalism has not been used yet for stratigraphy in archaeology. More formally
Definition 1 Let B be a set of basic relations, a QCNN is a tuple (V, C) where V = {v1,· · ·, vn}is a set of n vari-ables representing temporal entities, C is a mapping that as-signs to each tuple(vi1,· · ·, vij)of variables ofV, a relation
C(vi1,· · ·, vij)∈2B.
The stratigraphic relations between U S are temporal binary relations and several QCN could be proposed according the choice of the temporal entities and the set of basic relations.
Time points algebra Considering temporal entities as time points, archaeologists can provide temporal relations between the centers of mass of the US, deduced from stratigraphic relations between US. More formally, the domainDis defined by the set of rational numbers, (line points)D=Qequipped with the linear order<and the time points algebra stems from3atomic relations B={precedes, f ollows, same}. These relations are defined as follows:
precedes={(x, y)∈ Q × Q: x < y}, f ollows={(x, y)∈ Q × Q : y < x}, same={(x, y)∈ Q × Q: x=y}.
Figure 6. Time points algebra atomic relations
The set of time points algebra relations is denoted by2B , where each relation is a disjunction of atomic relations. The set2B
is equipped with the operations: Union (∪), intersection (∩), composition(◦), inverse(−). The following example illustrates
the notion of QCN when the temporal entities are time points.
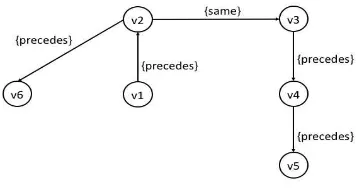
Figure 7. Example of relations between US .
Example 1 LetA,B,C,D,E,F be US, the statigraphic re-lations between these6US according to the Harris Matrix ap-proach are illustrated in Figure 7. Let a, b, c, d, e, f be the centers of mass of these6US, considering temporal entities as time points, the QCN denoted by(V, C) is such that the vari-ables are time points which are the centers of mass of the US and the constraints are the temporal relations between US. More for-mally, the set of variables isV ={v1, v2, v3, v4, v5, v6}, where
v1 =a,v2 =b,v3=c,v4 =d,v5 =e,v6 =fand the set of constraints isC={C12, C23, C26, C34, C45}1, where: The constraintC12={precedes}states thatv1precedesv2, the constraintC23={same}states thatv2is the same thanv3, the constraintC26={precedes}states thatv2precedesv6, the constraintC34={precedes}states thatv3precedesv4, the constraintC45={precedes}states thatv4precedesv5. The QCN is represented in Figure 8.
Figure 8. QCN when temporal entities are time points.
Intervals algebra However, the stratigraphic relations between U Soften involve the notion of duration which cannot be repre-sented with the Harris Matrix approach. In this case intervals are more suitable temporal entities. From stratigraphic relations be-tween US the archaeologists can assign intervals to US and we can consider relations between intervals from the Allen’s interval algebra (Allen, 1983). This algebra stems from13atomic tem-poral relations B = {p, m, o, s, d, f, pi, mi, oi, si, di, f i, eq}. More formally the domainDis defined by the set of intervals of the rationals lineD={x= (x−, x+)∈ Q × Q :
x−< x+}
. Each atomic relation is defined by constraints on the bounds of intervals. For example, the atomic relations(for starts) is de-fined bys ={(x, y) ∈ D×D : x−= y−and y+
> x+ }, the atomic relationm(for meets) is defined bym={(x, y) ∈
D×D : x+=
y−}.
1for the sake of readability the inverse relations and the transitive
Figure 9. Allen’s intervals algebra atomic relations
The set of Allen’s intervals algebra relations is denoted by2B, where each relation is a disjunction of basic relations. The set
2Bis equipped with the operations: Union (∪), intersection (∩), composition(◦), inverse(−). The following example illustrates
the notion of QCN when the temporal entities are intervals.
Example 2 We come back to Example 1, however we now con-sider temporal entities as intervals. The new QCN denoted by (V, C)is such that the variables are intervals consisting in the lower and upper bounds of duration of the US and the constraints are the temporal relations between these intervals. More for-mally the set of variables isV ={v1, v2, v3, v4, v5, v6}, where
v1= (a−, a+),v2 = (b−, b+),v3 = (c−, c+),v4= (d−, d+),
v5 = (e−, e+), v6 = (f−, f+).The set of constraints isC = {C12, C23, C26, C34, C45}2where:
The constraintC12 ={b, m}, states thatv1 precedesv2orv1 meetsv2 since from Figure 7 and Table 2 one can deduce that
a+
< b−ora+=
b−,
the constraintC23 ={f}, states thatv2finishesv3 since from Figure 7 and Table 2 one can deduce thatb−=c−,
the constraintC26 = {b, m}, states thatv2 precedesv6 orv2 meetsv6 since from Figure 7 and Table 2 one can deduce that
b+< f−orb+ =f−,
the constraintC3,4 = {b, m}, states thatv3precedesv4orv3 meetsv4 since from Figure 7 and Table 2 one can deduce that
c+< d−orc+ =d−,
the constraintC45 = {b, m}. states thatv4precedesv5orv4 meetsv5 since from Figure 7 and Table 2 one can deduce that
d+
< e−ord+=
e−. The QCN is represented in Figure 10.
Figure 10. QCN when temporal entities are intervals.
Note that information on the bounds of the intervals may be in-complete, as illustrated in Example 2, the constraintC23only
fol-lows from the lower bounds of the intervalsv2andv3assigned to
US. Table2 does not provide any relations between upper bounds, and we need more information than what is provided by Figure 7.
2for the sake of readability the inverse relations and the transitive
re-lations are omitted.
Archaeologists should be equipped with suitable tools allowing them to complete information on the bounds in the best possible way.
Moreover an important issue is the QCN consistency checking problem. Indeed, a QCN may be inconsistent for several reasons. Errors can be made on the interpretation of stratigraphic relations, discontinuities involved by the 3D complexity of studied struc-tures may exist, the survey may be incomplete (for instance lack of photographies,· · ·). Efficient tools have to be developed in or-der to check the consistency and to pinpoint the inconsistencies in each step of the process from the formal temporal representation to the photogrammetric 3D survey.
Concerning the QCN, three main approaches have been proposed for consistency checking in the artificial intelligence community, stemming from discrete CSP (Dechter et al., 1991), from SAT (Condotta et al., 2016), and more recently from Answer Set Pro-gramming (ASP) (Brenton et al., 2016).
5. CONCLUSION AND FUTURE WORK
Beyond the scientific problems, an important obstacle addressed by this work is that a heavy change of paradigm has a lot of im-plication on the on-going work. Changing paradigm means also changing vocabulary, managing new concepts, changing well-known tools for unwell-known and not completely debugged tools.
In a future work we plan to investigate the ASP approach for sev-eral reasons. ASP is a unified formalism for both representing and implementing the consistency checking problem expressed by a logic program which is very close to natural language. We already used this formalism when dealing with the revision of geographical information within the framework of the REVIGIS project3(Benferhat et al., 2010). More precisely we compared the CSP, SAT and ASP approaches. CSP focuses on the direct res-olution of inconsistencies by means of propagation mechanisms while SAT and ASP concentrate on the identification of inconsis-tencies. However an experimental study on a real world appli-cation benchmark showed that ASP gave better results than SAT (Benferhat et al., 2005). Moreover, ASP can easily interface with ontologies and Java.
ACKNOWLEDGEMENTS
This collaboration was since 2004 funded directly by the two partner institutions, University of Florence and CNRS LSIS Mar-seille, without resorting to substantial grants provided by external donors. Since 2016 this work is partially done in the framework of the GROPLAN project, an Industrial Research project funded by ANR in the framework of Contenus numriques et interactions (CONTINT) 2013.(http://www.groplan.eu)
REFERENCES
Accary-Barbier, T. and Calabretto, S., 2008. Building and using temporal knowledge in archaeological documentation.Journal of Intelligent Information Systems31(2), pp. 147–159.
Allen, J. F., 1983. Maintaining knowledge about temporal inter-vals.Commun. ACM26(11), pp. 832–843.
Althusser, L., 1969.For Marx. London.
Amico, N., Ronzino, P., Felicetti, A. and Niccolucci, F., n.d. Quality management of 3d cultural heritage replicas with cidoc-crm. In:CEUR Workshop Proceedings, CEUR-WS.org.
Belussi, A. and Migliorini, S., 2014. Modeling time in archaeo-logical data: the verona case study.Rapporto di ricerca Research report.
Benferhat, S., Ben-Naim, J., Jeansoulin, R., Khelfallah, M., La-grue, S., Papini, O., Wilson, N. and W¨urbel, E., 2005. Belief revision of GIS systems: The results of rev!gis. In:Symbolic and Quantitative Approaches to Reasoning with Uncertainty, 8th Eu-ropean Conference, ECSQARU 2005, Barcelona, Spain, July 6-8, 2005, Proceedings, pp. 452–464.
Benferhat, S., Ben-Naim, J., Papini, O. and W¨urbel, E., 2010. An answer set programming encoding of prioritized removed sets revision: application to GIS.Appl. Intell.32(1), pp. 60–87.
Brenton, C., Faber, W. and Batsakis, S., 2016. Answer set pro-gramming for qualitative spatio-temporal reasoning: Methods and experiments. In:Technical Communications of the 32nd In-ternational Conference on Logic Programming, ICLP 2016 TCs, October 16-21, 2016, New York City, USA, pp. 4:1–4:15.
Brogiolo, G. P., 1988. Archeologia delledilizia storica. Docu-menti e metodi. Como (Italy).
Condotta, J., Nouaouri, I. and Sioutis, M., 2016. A SAT approach for maximizing satisfiability in qualitative spatial and temporal constraint networks. In:Principles of Knowledge Representation and Reasoning: Proceedings of the Fifteenth International Con-ference, KR 2016, Cape Town, South Africa, April 25-29, 2016., pp. 432–442.
Cure, O., Serayet, M., Papini, O. and Drap, P., 2010. Toward a novel application of cidoc crm to underwater archaeological sur-veys. In:4th IEEE International Conference on Semantic Com-puting, ICSC 2010, pp. 519–524.
Dechter, R., Meiri, I. and Pearl, J., 1991. Temporal constraint networks.Artif. Intell.49(1-3), pp. 61–95.
Doerr, M., 2001. The cidoc crm an ontological approach to se-mantic interoperability of metadata.AI Magazine.
Drap, P., Durand, A., Nedir, M., Seinturier, J., Papini, O., Gabrielli, R., Peloso, D., Kadobayashi, R., Gaillard, G., Chap-man, P., Viant, W., Vannini, G. and Nucciotti, M., 2007. Pho-togrammetry and archaeological knowledge: toward a 3dinfor-mation system dedicated to medieval archaeology: a case study of shawbak castle in jordan. In: S. E.-H. Fabio Remondino (ed.),
3D-ARCH 2007: ”3D Virtual Reconstruction and Visualization of Complex Architectures.
Drap, P., Durand, A., Seinturier, J., Vannini, G. and Nucciotti, M., 2005. Full xml documentation from photogrammetric survey to 3d visualization. the case study of shawbak castle in jodan. In: T. C. I. A. f. D. o. C. Heritage (ed.),CIPA 2005 XX International Symposium, Vol. 2, FIORDO srl - Galliate, pp. 771–776.
Drap, P., Seinturier, J., Chambelland, J.-C. and Pruno, E., 2009. Going to shawbak (jordan) and getting the data back: toward a 3d gis dedicated to medieval archaeology. In:3D Arch 2009, 3D Vir-tual Reconstruction and Visualization of Complex Architectures.
Gallina, D., 2012. Sillogismo deduttivo o abduzione? alcune pro-poste per labbandono/superamento del matrix di harris nellanalisi dellarchitettura. In: A. d. Giglio (ed.),VI COngresso Nazionale di Archeologia Medievale.
Harris, E. C., 1979. Principles of Archaeological Stratigraphy. Academic press edn, London.
Harris, E. C., 2003. The stratigraphy of standing structures con alcune considerazioni in nota di r. parenti. Archeologia dellAr-chitetturaVIII, pp. 9–16.
Hiebel, G., Hanke, K. and Hayek, I., 2010. Methodology for cidoc crm based data integration with spatial data. In: CAA, Melero, F.J., Cano, P., Revelles, J., Granada.
Hue, J., Serayet, M., Drap, P., Papini, O. and Wurbel, E., 2011. Underwater archaeological 3d surveys validation within the re-moved sets framework. In: Proceedings of the 11th European conference on Symbolic and quantitative approaches to reason-ing with uncertainty, Springer-Verlag, 2026133, pp. 663–674.
Lowe, D., 2004. Distinctive image features from scale-invariant keypoints. International Journal of Computer Vision60, pp. 91– 110.
Lucas, G., 2001. Critical Approaches to Fieldwork. Contempo-rary and Historical Archaeological Practice. London, Routledge.
Lucas, G., 2005. The archaeology of time. Themes in archae-ology, julian thomas, university of manchester. edn, Routledge, Madisson av. New York, Simultaneously published in the USA and Canada.
Mannoni, T., 1976. Lanalisi delle tecniche murarie medievali in liguria. Atti del Colloquio Internazionale di Archeologia Me-dievalePalermo, pp. 291–300.
Niccolucci, F., Hermon, S. and Doerr, M., 2015.The Formal Log-ical Foundations of ArchaeologLog-ical Ontologies. book section 3, pp. 86–99.
Nicolis, G. and Prigogine, I., 1977. Self-Organization in Nonequilibrium Systems. From Dissipative Structures to Order through Fluctuations. J. Wiley and Sons, New York, London, Sydney, Toronto.
Papini, O. and Drap, P., 2009. The revision of partially preordered information in answer set programming. In:Proceedings of EC-SQARU , Lecture Notes in Computer Science, pp. 421–433.
Pruno, E. and Drap, P., 2012. Dalla stratigrafia allarcheologia teorica: il matrix di harris e larcheologia del tempo. In:VI Con-gresso Nazionale di Archeologia Medievale, LAquila, pp. 16–18.
Ronzino, P., 2015. CIDOC CRMBa, a CRM extension for build-ings archaeology information modeling. Thesis.
Seinturier, J., 2007. Fusion de connaissances : Applications aux relevs photogrammtriques de fouilles archologiques sous-marines. Thesis.
Serayet, M., Drap, P. and Papini, O., 2011. Extending removed sets revision to partially preordered belief bases. International journal of approximate reasoning52(1), pp. 110–126.
Vannini, G., Nucciotti, M., Cardini, F., Bonacchi, C., Stanta, L., Tuliozi, R., Piccirillo, M., Falahat, H., Bikai, P. M., Lee Saunders, S., Kanellopoulos, C., Joukowsky, M. S., Nashef, K., Arce, I., Damgaard, C., Ligato, G., Bini, M., Schmid, S. G., Parise, M., Mancini, M., Germani, C., Burri, E., Hamarneh, B., Desideri, A. V., Rugiadi, M., Agnoletti, S., Dotti, F., La Bianca, O., Scalini, M., Alisi, T. M., Del Bimbo, A., Drap, P., Gabrielli, R., Mazza, P., Corbino, C., Franchi, R., Gobbi, L., Raffaelli, G., Ruschi, P. and Sodi, E., 2009. Da Petra a Shawbak, Archeologia di una frontiera. Guido vannini, michele nucciotti edn, p. 190.