MODELLING THE EFFECTS OF LAND-USE CHANGES ON CLIMATE: A CASE STUDY
ON YAMULA DAM
¨
U. K¨oyl¨ua, A. Geymena∗
a
ERU, Engineering Faculty, Dept. of Geomatic Engineering, 38039 Melikgazi Kayseri, Turkey (umrank, ageymen)@erciyes.edu.tr
KEY WORDS:Geographical Information Systems, Remote Sensing, Time Series, Trend Analysis, Artificial Reservoir Effect, Curve Number
ABSTRACT:
Dams block flow of rivers and cause artificial water reservoirs which affect the climate and the land use characteristics of the river basin. In this research, the effect of the huge water body obtained by Yamula Dam in Kızılırmak Basin is analysed over surrounding spatial’s land use and climate change. Mann Kendal non-parametrical statistical test, Theil&Sen Slope method, Inverse Distance Weighting (IDW), Soil Conservation Service-Curve Number (SCS-CN) methods are integrated for spatial and temporal analysis of the research area. For this research humidity, temperature, wind speed, precipitation observations which are collected in 16 weather stations nearby Kızılırmak Basin are analyzed. After that these statistical information is combined by GIS data over years. An application is developed for GIS analysis in Python Programming Language and integrated with ArcGIS software. Statistical analysis calculated in the R Project for Statistical Computing and integrated with developed application. According to the statistical analysis of extracted time series of meteorological parameters, statistical significant spatiotemporal trends are observed for climate change and land use characteristics. In this study, we indicated the effect of big dams in local climate on semi-arid Yamula Dam.
1. INTRODUCTION
Many studies about the relation between the region’s land use and the climate have been conducted. The changes on the land use have triggered the changes of hydrological and climate parame-ters naturally. Huge water bodies such as rivers, lakes, and dams located in one region effect that region’s humidity and rainfall characteristics (Degu et al., 2011, Deshmukh et al., 2013, Isik et al., 2013, Jeffry Swingly Frans Sumarauw, 2012, Lal et al., 2015). The correlation between land use and physical measurements of water resources (rainfall and flow) is an important area in hy-drological studies (Avissar and Liu, 1996, Caviedes-Voulli`eme et al., 2012, Deshmukh et al., 2013). Climate and land use correla-tions are analyzed by Geographic Information Systems (GIS) and Remote Sensing techniques (Serpico et al., 2012, Singh, 1989, Weng, 2011). Yamula Dam is a dam constructed on Kızılırmak River basin. In this research the effect on region’s land use char-acteristics and the climate of the huge water body hold on Yamula Dam, is studied.
2. METHODOLOGY 2.1 Study Area
The studied area is located in Kayseri and includes Kızılırmak basin and Yamula Dam which has 66.880 square kilometers area. Yamula Dam was constructed on Kızılırmak Basin and completed in 2003. The total area of the collected water body was reached in 2005 as planned before and electricity production started (C¸ evlik and Elibol, 2009).
The curve number calculations are conducted for 2000, 2006, 2010, and 2011. The changes for the land use before and after the construction of the dam are examined. The correlation between climate, land use, and water mass is analyzed. Analyzed meteoro-logical data was collected in 16 stations which are located nearby
∗Corresponding author
the studied area. The calculations are done on the region which has 5.773-hectare area and loacated between 38°52’- 39°05’ N latitudes, 35°12’- 35°2’ E longitudes. The climate characteristics of the area is semi-arid.
2.2 Data
In this study land use & land cover information, hydrological soil groups, land use capability maps, and precipitation values are used for calculation of Soil Conservation Service-Curve Number (SCS-CN) and weighted Curve Number (wCN). Land use & land cover maps are calculated by the classification of Landsat 5 The-matic Mapper satellite images. Hydrological soil groups maps cluster the lands according to the soil characteristics determined by precipitation, drain, infiltration values of the soil (Musgrave, 1955). Land use capability has 7 classes and they are determined by the slope of that land region. A land which belongs to the class I is flat and a land with class VII is a steep slope. The other classes define the gradual slopes between flat and steep lands. Meteoro-logical data are collected in 16 stations which are located in Kay-seri, Sivas, Yozgat, and Nevs¸ehir nearby Yamula Dam between 1970 and 2013.
2.3 Method
2.3.1 Curve Number SCS-CN (NRCS, 2004, USDA/NRCS, 1986, Caviedes-Voulli`eme et al., 2012) predicts the runoff value of ungauged stations. Relation between runoff and precipitation is given in Equation 1.
F S=
Q (P−Ia)
(1)
where F= actual retention
S= potential maximum retention Q= direct runoff (mm)
Ia= initial abstraction
P= rainfall depth (mm)
The International Archives of the Photogrammetry, Remote Sensing and Spatial Information Sciences, Volume XLII-2/W1, 2016 3rd International GeoAdvances Workshop, 16–17 October 2016, Istanbul, Turkey
This contribution has been peer-reviewed.
The initial abstraction is defines the first absorption water amount by the soil.
Actual retention is calculated by Equation 2.
F=P−Ia−Q (2)
Equation 3 is obtained by combining Equation 1 and 2.
Q= (P−Ia)
2
P−Ia+S
(3)
Ia/Sratio is taken 0.2 in Equation 3. In this way Equation 4 is
Q= (P−0.2S)
2
P+ 0.8S ⇒P >0.2S (4)
By using of precipitation and runoff equations in the CN method; S value is convert to the value of CN.
CN= 25400
254 +S (5)
Value of wCN is calculated by Equation 6.
wCN =
2.3.2 Trend Analysis Techniques Trend analysis is used to determine monotonic trends, which means increasing or decreas-ing continuously, bedecreas-ing statistically meandecreas-ingful over time series. Prewhitening method has been used for cleaning serial effect on time series (von Storch, 1999). Serial effect present on current data defines the value affected by previously value and how af-fects the next value. The presence of a serial effect is calculated by autocorrelation function as stated in Equation 7 (Salas et al., 1985). If any relation is present in time series, it is corrected by Equation 8 (von Storch, 1999, Yue and Wang, 2002). Non-parametric Mann Kendall Test determines the monotonic trend in trend analysis (Kendall, 1948, Mann, 1945). Theil Sen Slope method determines the power of the trend (Sen, 1968, Theil, 1950).
rk=
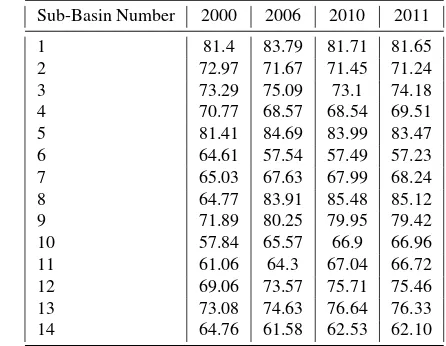
Yamula Dam basin is determined by evaluation of Digital Ele-vation Model (DEM) and divided into 14 sub-basins. Landsat 5 satellite images for years 2000, 2006, 2010, and 2011 are classi-fied according to the land use/vegetation by supervised classifi-cation algorithm, and the thematic maps are obtained.
Table 1. Estimated curve number values of sub-basins.
Sub-Basin Number 2000 2006 2010 2011
1 81.4 83.79 81.71 81.65
2 72.97 71.67 71.45 71.24
3 73.29 75.09 73.1 74.18
4 70.77 68.57 68.54 69.51
5 81.41 84.69 83.99 83.47
6 64.61 57.54 57.49 57.23
7 65.03 67.63 67.99 68.24
8 64.77 83.91 85.48 85.12
9 71.89 80.25 79.95 79.42
10 57.84 65.57 66.9 66.96
11 61.06 64.3 67.04 66.72
12 69.06 73.57 75.71 75.46
13 73.08 74.63 76.64 76.33
14 64.76 61.58 62.53 62.10
First, land use capability and hydrological soil groups maps are organized and merged with ArcGIS union tool using analysis toolbox. After combining the maps CN and wCN values are esti-mated by using the table given in (S¸en et al., 2010). An applica-tion is developed for value estimaapplica-tion according to the reference table in Python programming language and applied on 56 maps for 14 sub-basins and 4 years (Table 1). ArcGIS commands are also embedded in this application with ArcPy module. Thus ap-plication is performed fast and efficiently. SQL module are also applied with ArcGIS commands.
3.2 Trend Analysis
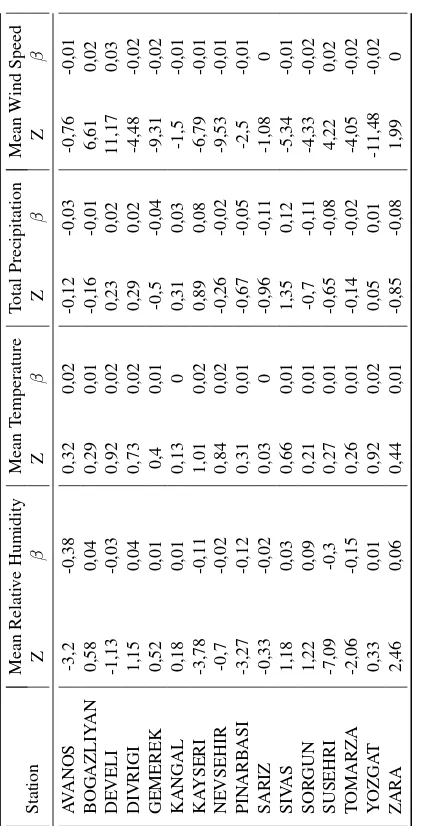
There are 16 meteorological stations located in cities nearby Ya-mula Dam. The numerical values such as maximum, minimum and average values of relative humidity and temperature values, total precipitation amount, average wind speed, have been col-lected daily in these stations. Before applying statistical analy-sis, meteorological values are translated to time series monthly and seasonal. Correlation matrices are calculated of time series. According to the statistical information obtained by correlation matrix and its correlograms, the serial correlation effects are dis-covered in time series. So prewhitening method is applied over time series to remove periodical pattern. Significant trends are de-termined by the Mann Kendall non-parametric test. Amounts of changes in the identified statistical meaningful trends have been calculated by Theil Sen Slope Technique. Statistical analyzes are applied in the R Project for Statistical Computing. The results of trend analysis are represented in Table 2.
4. CONCLUSION
In this study the effects of Yamula Dam on local climate of Kızılırmak River Basin over years have been investigated. According to the obtained results, the construction of dam which formed a huge water body (artificial reservoir) exposed enormous changes on the land characteristics. With facilitation of irrigation facilities, increase cropped areas increase and barren lands around dam de-crease, thus soil water retention capacity increases. Effects of land use changes on climate are modelled with this application.
5. ACKNOWLEDGEMENTS
This work was supported by the Research Fund of the Erciyes University. Project Number: FDK-2013-4304. We would like The International Archives of the Photogrammetry, Remote Sensing and Spatial Information Sciences, Volume XLII-2/W1, 2016
3rd International GeoAdvances Workshop, 16–17 October 2016, Istanbul, Turkey
This contribution has been peer-reviewed.
Table 2. Calculated trend analysis results (Z is Mann Kendall statistical test results andβis Theil Sen Slope results)
Station
to thank The Turkish State Meteorological Service and the Ge-ographic Information Systems Department of the General Di-rectorate of Agricultural Reform and the Republic of Turkey’s Ministry of Food, Agriculture and Livestock for supplying data. Also we would like to thank The Scientific and Technological Research Council of Turkey (TUBITAK).
REFERENCES
Avissar, R. and Liu, Y., 1996. Three-dimensional numerical study of shallow convective clouds and precipitation induced by land surface forcing. Journal of Geophysical Research: Atmospheres
101(D3), pp. 7499–7518.
Caviedes-Voulli`eme, D., Garc ˜Aa-Navarro, P. and Murillo, J., 2012. Influence of mesh structure on 2d full shallow water equa-tions and scs curve number simulation of rainfall/runoff events.
Journal of Hydrology448-449(0), pp. 39–59.
Degu, A. M., Hossain, F., Niyogi, D., Pielke, R., Shepherd, J. M., Voisin, N. and Chronis, T., 2011. The influence of large dams on surrounding climate and precipitation patterns. Geophysical Research Letters38(4), pp. n/a–n/a.
Deshmukh, D. S., Chaube, U. C., Ekube Hailu, A., Aberra Gudeta, D. and Tegene Kassa, M., 2013. Estimation and
comparision of curve numbers based on dynamic land use land cover change, observed rainfall-runoff data and land slope. Jour-nal of Hydrology492(0), pp. 89–101.
Isik, S., Kalin, L., Schoonover, J. E., Srivastava, P. and Graeme Lockaby, B., 2013. Modeling effects of changing land use/cover on daily streamflow: An artificial neural network and curve number based hybrid approach. Journal of Hydrology
485(0), pp. 103–112.
Jeffry Swingly Frans Sumarauw, K. O., 2012. Analysis on curve number, land use and land cover changes and the impact to the peak flow in the jobaru river basin, japan. International Journal of Civil Environmental Engineering IJCEE-IJENS.
Kendall, M., 1948. Rank correlation methods. C. Griffin, Lon-don.
Lal, M., Mishra, S. K. and Pandey, A., 2015. Physical verification of the effect of land features and antecedent moisture on runoff curve number.CATENA133(0), pp. 318–327.
Mann, H. B., 1945. Nonparametric tests against trend. Econo-metrica13(3), pp. 245–259.
Musgrave, G. W., 1955. How much of the rain enters the soil? Report, U.S. Department of Agriculture.
NRCS, 2004. Estimation of Direct Runoff from Storm Rainfall. Vol. Chapter 10, United States Department of Agriculture, Wash-ington D.C., book section Chapter 10, pp. 1–28.
Salas, J., Delleur, J. and Yevjevich, V., 1985. Applied Modeling of Hydrologic Time Series. Water Resources Publications.
Sen, P. K., 1968. Estimates of the regression coefficient based on kendall’s tau.Journal of the American Statistical Association
63(324), pp. 1379–1389.
Serpico, S., Dellepiane, S., Boni, G., Moser, G., Angiati, E. and Rudari, R., 2012. Information extraction from remote sensing images for flood monitoring and damage evaluation.Proceedings of the IEEE100(10), pp. 2946–2970.
Singh, A., 1989. Digital change detection techniques using remotely-sensed data. International Journal of Remote Sensing
10(6), pp. 989–1003.
Theil, H., 1950. A rank-invariant method of linear and polyno-mial regression analysis. Nederlandse Akademie Wetenchappen Series A53, pp. 386–392.
USDA/NRCS, 1986. Urban hydrology for small watersheds tech. release-55. United States Department of Agriculture Soil Conser-vation Service, Washington D.C.
von Storch, H., 1999. Misuses of statistical analysis in climate research. In: H. von Storch and A. Navarra (eds),Analysis of Climate Variability, Springer Berlin Heidelberg, pp. 11–26.
Weng, Q., 2011. Advances in Environmental Remote Sensing: Sensors, Algorithms, and Applications. Remote Sensing Appli-cations Series, CRC Press.
Yue, S. and Wang, C. Y., 2002. Applicability of prewhitening to eliminate the influence of serial correlation on the mann-kendall test.Water Resources Research38(6), pp. 4–1–4–7.
C¸ evlik, H. and Elibol, M. A., 2009.Yamula Baraj G¨ol¨u Limnolo-jisi. Devlet Su ˙Is¸leri Genel M¨ud¨url¨u˘g¨u, Ankara.
S¸en, Z., Uyumaz, A., Oztopal,¨ A., Cebeci, M., K¨uc¸¨ukmehmeto˘glu, M., Erdik, T. and Sırdas¸, e. a., 2010. ˙Iklim de˘gis¸ikli˘ginin ˙Istanbul ve t¨urkiye su kaynakları gelece˘gine tesirleri projesi nihai raporu. Report, ˙ISK˙I.
The International Archives of the Photogrammetry, Remote Sensing and Spatial Information Sciences, Volume XLII-2/W1, 2016 3rd International GeoAdvances Workshop, 16–17 October 2016, Istanbul, Turkey
This contribution has been peer-reviewed.