www.elsevier.com / locate / econbase
The information content of lagged equity and bond yields
*
´
´
Richard D.F. Harris , Rene Sanchez-Valle
School of Business and Economics, University of Exeter, Exeter EX4 4PU, UK
Received 12 July 1999; accepted 16 December 1999
Abstract
This paper compares the equity return forecasting ability of several measures of the equity-bond yield differential, and investigates the gain from allowing equity and bond yields to freely enter the forecasting equation. Both in-sample and out-of-sample evidence is provided. 2000 Elsevier Science S.A. All rights reserved.
Keywords: Equity return predictability; Gilt-equity yield ratio; Long bond yield; Equity dividend yield
JEL classification: G10; G14
1. Introduction
The gilt–equity yield ratio (GEYR), defined as the ratio of the coupon yield on long government bonds to the dividend yield on equity, has been shown to have substantial explanatory power for UK equity returns (Clare et al., 1994; Levin and Wright, 1998; Buckle et al., 1999; Harris and
´
Sanchez-Valle, 2000). The explanatory power of the GEYR arises from its ability to capture the relative value of bonds and equities reflected in the differential of their income yields. However, there are a number of ways to capture this yield differential, and there is no reason a priori to suppose that the GEYR is the optimal measure. The first objective of this paper is to compare the GEYR with two alternative measures of the yield differential between equity and bonds, namely the natural logarithm of the GEYR (LGEYR) and the reverse yield gap (RYG), defined as the difference between the yields on bonds and equity, rather than their ratio.
The second objective of this paper is to evaluate the gain from allowing lagged equity and bond yields to freely enter the forecasting equation. Any single measure of the equity-bond yield differential, such as the GEYR, LGEYR or RYG, imposes an arbitrary restriction on the equilibrium
*Corresponding author. Tel.: 144-1392-263-215; fax: 144-1392-263-242.
E-mail address: [email protected] (R.D.F. Harris)
relationship between the consol yield and equity dividend yield, which can only serve to reduce its explanatory power. From an econometric point of view, the inclusion of variables as ratios or differences is often motivated by concern about their stationarity. In particular, allowing equity and bond yields to freely enter a regression would lead to spurious inference if either variable were integrated. However, the primary use of these variables is to provide parsimonious models of expected returns that maximise predictive ability. The ultimate tests of such models are their out-of-sample performance based on forecast accuracy or the trading strategy return that they are able to generate, neither of which rely directly on the integrity of the econometric analysis.
Furthermore, the decision to combine variables into a ratio or difference is usually the consequence of a statistical test that is unable to reject the null hypothesis of non-stationarity. However, such tests are well known to have extremely poor finite sample performance against stationary but highly persistent alternatives, with power that is often only marginally higher than their size (see, for instance, Dickey and Fuller, 1981). While the use of such tests may be important to ensure the validity of statistical inference, in the present context it might be more useful to appeal to economic theory to justify the assumption of stationarity for both equity and bond yields. Moreover, even if equity and bond yields were non-stationary but cointegrated, it would be preferable to estimate the cointegrating relationship between them, rather than imposing it a priori. This paper therefore compares the performance of the GEYR, the LGEYR and the RYG, with two models that include lagged equity and bond yields without restriction. The first is specified in levels, corresponding to an unrestricted version of the RYG model, while the second is specified in logarithms, corresponding to an unrestricted version of the LGEYR model. The paper provides evidence on both in-sample explanatory power and out-of-sample predictive ability for each of the five models.
2. Data
The analysis is based on a recursive regression procedure described in the following section. The dependent variable in each regression is the continuously compounded monthly return on the FT All Share index, including dividends. The explanatory variables are the lagged consol yield, defined as the month-end redemption yield on an irredeemable bond, the lagged equity dividend yield, defined as the dividend yield on the FT All Share index, and various combinations of the two. The gilt–equity yield ratio (GEYR) is defined as the ratio of the consol yield to the equity dividend yield. The log GEYR (LGEYR) is the natural logarithm of the GEYR. The reverse yield gap (RYG) is the difference between the consol yield and the equity dividend yield. The risk free rate used in the trading strategy is the month-end 1 month deposit rate. All the data are taken from Datastream. The estimation sample is the 352 observations from 1968M8 to 1997M11.
3. Methodology
The paper evaluates the performance of the following regression models
rt5a01a LGEYR1 t211 ? ? ? 1a LGEYRp t2p1et (2)
rt5a01a RYG1 t211 ? ? ? 1a RYGp t2p1et (3)
rt5a01a ln Y1 t211 ? ? ? 1a ln Yp t2p1b ln D1 t211 ? ? ? 1b ln Dp t2p1et (4)
rt5a01a Y1 t211 ? ? ? 1a Yp t2p1b D1 t211 ? ? ? 1b Dp t2p1et (5)
where r is the return in month t, Y is the consol yield, D is the dividend yield, and GEYR , LGEYRt t t t t and RYG are defined in the previous section. Models (4) and (5) are the unrestricted LGEYR andt
RYG models, respectively. The lag length, p, varies from one to six, yielding a total of 30 separate models to be estimated. A 60-month rolling regression procedure is used to generate one-step ahead forecasts for each model. In each case, an initial regression is estimated using the first 60 monthly observations of the estimation sample. The estimated model is then used to compute a one-step ahead forecast of the return for the following month. At each subsequent iteration, the estimation sample is moved forward by 1 month, and a one-step ahead forecast for the following month is computed. This is repeated until the end of the estimation sample is reached. This procedure yields a series of 293 regressions for each model, with a corresponding series of 293 one-step ahead forecasts.
Each model is evaluated in terms of both in-sample explanatory power and out-of-sample predictive ability. The in-sample explanatory power of each model is measured by the adjusted R-squared averaged over all 293 estimated rolling regressions. Out-of-sample predictive ability is measured by the root mean square error (RMSE) of the one-step forecasts, and by the return to a trading strategy based on those forecasts. The trading strategy uses the forecasts of each model as a signal for investors to switch funds between the equity and bond markets. Specifically, the one-step ahead forecast of each model is compared with the current 1 month risk free rate of interest. If the forecast return is higher than the risk free rate, then it is assumed that funds are invested in the equity market, while if the forecast return is less than the risk free rate, the funds are invested in the bond market. The return on the investment each month is then calculated using the actual equity return or the risk free rate, respectively. A transaction charge of one half of 1% is deducted each time that funds are switched from the bond market to the equity market, or vice-versa. The average annualised compounded monthly return to the trading strategy is then computed over all 293 forecast months. As a benchmark against which the trading strategy profits can be compared, the analysis also reports the return to simple buy-and-hold strategies for both equity and bonds.
4. Results
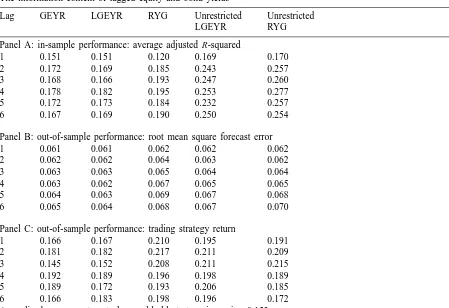
Panel A of Table 1 reports the in-sample performance of each model, measured by the adjusted
R-squared, averaged over all 293 rolling regressions. When only the first lag is considered, as is
Table 1
a
The information content of lagged equity and bond yields
Lag GEYR LGEYR RYG Unrestricted Unrestricted
Panel B: out-of-sample performance: root mean square forecast error
1 0.061 0.061 0.062 0.062 0.062
Annualised average return to buy-and-hold strategy in equity: 0.153 Annualised average return to buy-and-hold strategy in bonds: 0.099
a
The estimation sample is 1968M8 to 1997M11. The initial regression is estimated using the first 60 observations of the estimation sample. Each model is then estimated in each of the following months using the 60 most recent observations. Each regression is used to compute a one-step ahead forecast of the return for the following month. The trading strategy is implemented by comparing the one step ahead forecast of each model with the 1-month risk free rate. If the forecast return exceeds the risk free rate then the investment earns the actual 1-month equity return, otherwise the investment earns the 1-month risk free rate. Each time there is a switch between equity and bonds, or vice-versa, the return is reduced by a transaction charge of 0.5%. The table reports the annualised average return of the trading strategy over the 293 forecast months.
lagged dividend and bond yields to freely enter the forecasting equation substantially increases its explanatory power, with the best performance again provided by the unrestricted RYG model. The explanatory power of all five models initially increases with lag length, but then declines. In terms of in-sample performance, therefore, the GEYR is dominated by the RYG, but the best performance is achieved by the unrestricted RYG model.
more than offset by the loss in efficiency resulting from the estimation of additional parameters. In contrast with panel A, therefore, the GEYR and LGEYR models are the most accurate, while the RYG model is the least accurate.
Panel C reports the annualised average return to the trading strategy based on the one-step ahead forecasts from each model. Interestingly, the trading strategy results do not reflect the results on explanatory power or forecast accuracy. The most profitable model at one lag is the RYG model, which generates an annualised return of 21%, which is almost 6% above the return to a buy-and-hold strategy. This is substantially higher than the returns to both the GEYR and the LGEYR models, and somewhat higher than the return to either of the unrestricted models. Increasing the lag length increases the profitability of all five models, but the RYG model remains the most profitable at all lags, except lag three, where it is marginally dominated by the two unrestricted models. The profitability of the GEYR and LGEYR models increases quite substantially with lag length, but they remain dominated by the RYG model and the unrestricted models.
Comparing the three panels of Table 1, it is clear that there is no simple correspondence between explanatory power, forecast accuracy and trading strategy profitability. The profitability of a trading strategy is determined by the ability of the model to identify the months in which the equity risk premium is negative. This is not necessarily related to the overall forecast accuracy of the model, nor its ability to explain the in-sample variation in returns. The RYG model (and, to a lesser extent, the unrestricted models), are able to provide more reliable signals about the sign of the equity risk premium, despite the fact that its forecasts are in general less accurate than those of the GEYR and the LGEYR models.
5. Summary and conclusion
There is now considerable evidence that the GEYR has substantial explanatory power for UK equity returns. The GEYR captures the relative value of equity and bonds, reflected by the ratio of their income yields. In this paper, it has been shown that substantial improvements in in-sample explanatory power can be gained by allowing lagged equity and bond yields to freely enter the forecasting equation, particularly when longer lags are considered. However, this increase in in-sample explanatory power is not matched by increased out-of-sample forecast accuracy, suggesting that it is outweighed by the cost of estimating additional parameters. Nevertheless, it is matched by increased trading strategy profitability, implying that while the forecasts of the unrestricted models are marginally less accurate than those of the GEYR model, they contain more information about the sign of the equity risk premium, and thus provide more reliable signals about when to switch out of equity when equity returns are forecast to be low. Of the single measures of the equity-bond yield differential, the GEYR is dominated by both the LGEYR and the RYG, in terms of both in-sample explanatory power and trading strategy profitability.
References
Clare, A., Thomas, S., Wickens, M., 1994. Is the gilt–equity yield ratio useful for predicting UK stock returns? Economic Journal 104, 303–315.
Dickey, D., Fuller, W., 1981. Likelihood ratio statistics for autoregressive time series with a unit root. Econometrica 49, 1057–1072.
´
Harris, R.D.F., Sanchez-Valle, R., 2000. The gilt–equity yield ratio and the predictability of UK and US stock returns. Journal of Business Finance and Accounting, In press.