Error in Health-Care Survey Research
Debi Prasad Mishra
STATEUNIVERSITY OFNEWYORK ATBINGHAMTON
This article estimates the average amount of error variance in a typical Buckley, 1989). Commenting on the deleterious impact of
health-care measure by reanalyzing published multitrait–multimethod measurement error on validity, Lowe and Ryan-Wenger (1992)
(MTMM) matrices via the confirmatory factor analysis (CFA) procedure. note that “the discipline of nursing needs to be more
sophisti-For the set of studies under consideration, a typical health-care measure cated in its study of construct validity,” and that “the questions
contains a relatively high proportion (64%) of error variance (method of convergence and discrimination are central to the validity
and random). The magnitude of this error variance estimate seems to be of the instruments being developed” (p. 74). Likewise, Cote
higher than corresponding variance estimates reported in the other social and Buckley (1987) observe that “measures used in social
sciences. Using principles from psychometric theory, we note how measure- science research have a large error component” (p. 318), and
ment error can confound validity, and we provide directions to researchers go on to say that “in the future, researchers must be more
for improving the quality of survey-based health-care measures.J BUSN RES resolute in their desire to develop construct measures that are
2000. 48.193–205. 2000 Elsevier Science Inc. All rights reserved. valid and free of measurement error” (p. 318).
Given the potential of measurement error to confound the reliability and validity of constructs seriously, we would expect that summary psychometric analyses (c.f., Cote and Buckley,
I
n recent years, the use of paper and pencil items for measur- 1987) of paper and pencil items used in health-care research ing theoretical concepts has become widespread in the would be readily available. However, a careful scrutiny of the health-care discipline. For example, researchers have used literature belies this expectation and underscores the paucity survey-based questionnaires for gauging theoretical constructs of research on measurement and validity issues in health-care involving patient satisfaction (Singh, 1991), depression (Beck, research. For example, in the context of nursing, Gustafson, 1967), sleep patterns (Fontaine, 1989), juvenile health (Green- Sainfort, Van Konigsveld, and Zimmerman (1990) note that baum, Dedrick, Prange, and Friedman, 1994; Marsh and “there have been few detailed evaluations of measures of qual-Gouvernet, 1989), family health (Sidani and Jones, 1995), ity of care in nursing homes” and that “much research on caregiving (Phillips, Rempusheski, and Morrison, 1989), nurs- factors affecting nursing home quality has used measures of ing (Gustafson, Sainfort, Van Konigsveld, and Zimmerman, questionable reliability and validity . . . some measures cur-1990), and total quality management in hospitals (Lammers, rently in use have been developed using methodologies not Cretin, Gilman, and Calingo, 1996), among others. based on solid conceptual grounds, offering little reason to Although the use of subjective paper and pencil measures expect them to have much internal or external validity” (p. 97). has advanced our understanding of theoretical concepts in a Our objective in this paper is twofold: (1) to provide empir-number of health-care areas, it has also been recognized that ical estimates of the amount of measurement error in paper the presence of error in such measures can seriously under- and pencil health-care measures; and in a related vein, (2) to mine the reliability and validity of concepts being measured illustrate the use of the confirmatory factor analysis (CFA) (Bagozzi, Yi, and Phillips, 1991; Bagozzi and Yi, 1990; Cole, method for modeling measurement error in health-care re-Howard, and Maxwell, 1981; Cote and Buckley, 1987; search. By conducting such an empirical analysis, we seek to Churchill, 1979; Figuerdo, Ferketich, and Knapp, 1991; Fer- address three important issues in the health-care field. First, ketich, Figuerdo, and Knapp, 1991; Lowe and Ryan-Wenger, by ascertaining the pervasiveness of measurement error and 1992; Waltz, Strickland, and Lenz, 1984; Williams, Cote, and understanding its deleterious impact upon construct validity, health-care researchers will be in a position to interpret prop-erly the results of statistical analyses conducted to uncoverAddress correspondence to Debi Prasad Mishra, School of Management,
State University of New York, Binghamton, NY 13902, USA. relationships among theoretical constructs. For example, Cote
Journal of Business Research 48, 193–205 (2000)
2000 Elsevier Science Inc. All rights reserved. ISSN 0148-2963/00/$–see front matter
194
J Busn Res D. P. Mishra 2000:48:193–205Figure 1. Process for establishing construct validity of latent constructs.
and Buckley (1987) found that on average, measures in the ing TQM practices. Again, the presence of measurement error may seriously impinge upon efforts to implement, analyze, social sciences contained 41.7% trait variance, 26.3% method
and modify TQM efforts in health care. variance, and 32% error variance. Consequently, using these
In keeping with out objectives, this paper is organized as estimates, Cote and Buckley reported that “the true value for
follows. The first section offers a perspective on construct the slope in a two-variable (regression) case would be 2.4
validity and ties in the notion of measurement error with times the estimated value for measures containing 50% error
related psychometric concepts (i.e., scaling, validity, reliabil-variance” (p. 318). In other words, interpreting statistical
re-ity). The next section details the plan of data analysis. Spe-sults without assessing measurement error can seriously
un-cifically, the nested confirmatory factor analysis approach of dermine construct validity. Second, much of the concern over
Widaman (1985) based on MTMM (multitrait–multimethod) an appropriate regulatory role in health care has focused on
matrices (Campbell and Fiske, 1959) is outlined. The third efforts to define, measure, and ensure the quality of care of
section describes those health-care studies from which MTMM nursing homes and hospitals (Lemke and Moos, 1986). Given
data were reanalyzed. This is followed by a discussion of the that quality of care measures are often of the paper and pencil
results of our analysis. Finally, we describe the limitations of type, greater attention to measurement issues is warranted.
our study together with some implications for future research. Finally, there is a growing need for health-care institutions to
adopt “total quality management” (TQM) practices for
manag-ing the efficient delivery of health care (Casalou, 1991; Lam-
A Psychometric Perspective on
mers, Cretin, Gilman, and Calingo, 1996). The central themeConstruct Validity
of TQM is patient satisfaction, which is a latent construct that
implement-related to the question of what the instrument is in fact measur- stones were tossed on one occasion might correlate highly with how far they were tossed on another occasion, and thus, ing—what construct, trait, or concept underlies a person’s
performance or score on a measure” (p. 70). In other words, being repeatable, the measure would be highly reliable; but obviously the tossing of stones would not constitute a valid constructs are latent entities constructed by researchers for
describing and understanding an underlying phenomenon of measure of intelligence” (pp. 191–192). In other words, “relia-bility is a necessary but not sufficient condition for validity” interest. Because these constructs are latent, they can only be
indirectly determined by using a set of observable measures. (Nunnally, 1978, p. 192). The fundamental construct validity question can be phrased
as follows.Given that a set of items purportedly measures a latent
Measurement Error and Validity
construct, how confident is the researcher about a correspondence According to classical test theory (Gulliksen, 1950), the
vari-between these measures and the construct in question?For
exam-ance can be partitioned into trait variexam-ance and error variexam-ance. ple, when a researcher measuresdepressionby using
physiolog-Furthermore, error variance can be subdivided into method ical indicators (e.g., heartbeat), can he or she assert that
heart-variance and random error heart-variance. Mathematically, this rela-beat is in fact a valid measure of anxiety?
tionship is expressed as Equation (1): Although the fundamental premise of construct validity is
rather simple, investigators must pay careful attention to the so5 st 1 sm1 sr (1)
underlying psychometric processes that are related to validity.
wheresois the observed variance,stthe trait (or valid)
vari-More specifically, the relationship between scaling, reliability,
ance,smthe method variance, andsrthe random error
vari-measurement error, and validity must be fully explored by
ance. Construct validity entails explaining the trait variance researchers. The following paragraphs discuss the
interrela-only. Note that method variance and random error variance tionship between validity and other psychometric concepts
may serve to attenuate or inflate theoretical relationships (scaling, reliability, measurement error). Let us consider the
among measures (Cote and Buckley, 1988). To this extent, a conceptual process involved in measuring a latent construct
rigorous estimation of method variance and random error as depicted in Figure 1.
variance should necessarily precede any attempt at investigat-As a first step, a researcher specifies the domain of the
ing construct validity. construct from which items are sampled to form a scale. The
The effect of measurement error (method variance and process of selecting a relevant subset of items from a universal
random error variance) can be highlighted with the following set of items is termed “domain sampling” (Nunnally, 1978).
example. Let us assume that a researcher administers the Note that this universal set is an infinite set of all possible
Beck Depression Inventory (BDI; Beck, 1967) to respondents. items that tap the latent construct. Because of constraints of
Furthermore, let us assume that approximately half the items time and costs, a researcher typically selects a few
representa-on the BDI are negatively scored. It is entirely possible that tive items from the universal set to form a “scale” where
re-some items on the scale may correlate highly (and conse-spondents assign numbers to questions. This process of
trans-quently load on a latent factor) just because of the particular forming responses into scores is calledscaling. Scores obtained
method (i.e., negatively worded items). In such a situation, from scales are calledobserved scores. Before proceeding
fur-it is erroneous to conclude that the set of negatively worded ther, researchers determine the relationship of the observed
items measure a trait factor. On the other hand, these items score to the score that would have been obtained had all
merely tap a method factor. In a similar vein, we can visualize items from the infinite set (i.e., the construct domain) been
how random error (respondent fatigue, length of questions, administered to aninfinite set of respondentsacross aninfinite
format) may also produce a spurious factor. In sum, measure-set of situations. The score on such an infinite set (of items,
ment error seriously compromises the construct validity of situations, and respondents) is called thetrue score.
measures. The relationship between the observed score (from a finite
Given the potential of measurement error to undermine set) and the true score (from an infinite set) is calledreliability.
construct validity severely, researchers first must estimate the Mathematically, reliability is calculated as the ratio of the
amount of error variance (both method variance and random observed variance to the true variance (Churchill, 1979). Note
error variance) in their measures before addressing the ques-that high reliability for a set of items merely implies ques-that
the correlations among items constituting a scale reflect an tion of validity. Such as exercise will help investigators ascer-tain the degree to which measurement error bias may be underlying latent factor. In other words, if one administered
a scale with high reliability across multiple situations and present. Furthermore, health-care researchers will also be compelled to make use of such statistical estimation tech-respondents, the amount of variance in the observed score
would be low; that is, the scale would beconsistentandrepeat- niques as latent variables structural equations modeling (Ben-tler, 1992), which explicitly permits the estimation of mea-able. Whether a scale exhibiting high reliability actually
mea-sures the underlying construct of interest is a question of surement error while studying theoretical relationships among constructs.
196
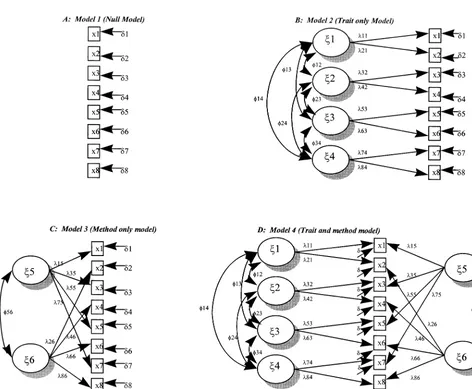
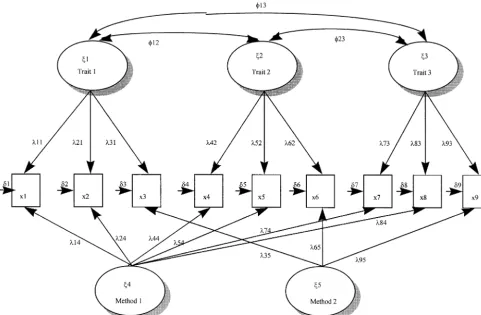
J Busn Res D. P. Mishra 2000:48:193–205Figure 2. Nested confirmatory factor analysis models for analyzing MTMM data. j1,j2,j3,j45trait factors;j5,j65method factors;
l 5factor loading;φ5factor correlation; x5measured variable;d 5random error.
pointed out several problems with Campbell and Fiske’s
Method
(1959) method (see Schmitt and Stutts, 1986 for a good
The Use of MTMM Matrices for
discussion). Most of the criticism against the MTMM techniqueEstimating Variance Components
has been directed at its underlying assumption of the use of “maximally dissimilar methods” (Marsh, 1989), because Per conventional research practice (Bagozzi and Yi, 1991;methods are rarely maximally dissimilar in practice. In this Bentler, 1992; Byrne, 1994; Cote and Buckley, 1987, 1988;
vein, Williams, Cote, and Buckley (1989) note that “if maxi-Williams, Cote, and Buckley, 1989), variance components
mally dissimilar methods are not used in MTMM analysis, it of measures can be estimated by analyzing MTMM matrices
becomes difficult to identify the existence of methods effects,” (Campbell and Fiske, 1959) by means of CFA. Briefly, a
(p. 462). Furthermore, the inability of the MTMM technique MTMM matrix represents intercorrelations of more than one
to provide meaningful statistical estimates of different variance trait measured by more than one method. In its original
formu-components of measures (i.e., trait, method, and random er-lation, Campbell and Fiske (1959) assumed that methods
ror) provides, at best, an incomplete assessment of validity were maximally dissimilar and that traits and methods were
(Schmitt and Stutts, 1986). not correlated.
In contrast to the well-documented shortcomings of the Despite the widespread use of MTMM matrices for assessing
MTMM technique, CFA of MTMM data represents a viable construct validity of measures (Fiske and Campbell, 1992),
alternative for assessing the construct validity of measures and researchers (Lowe and Ryan-Wenger, 1992; Marsh 1989;
its various components. The present study empirically assesses to the data than the baseline model. In the second step, M4 the amount of measurement error in measures by using CFA was compared with M3. A significantx2difference test further to reanalyze published MTMM matrices in health care. The indicates that trait factors are present. Likewise, the presence nested CFA approach that formed the basis for analyzing of method factors was determined by comparing M3 with M1,
MTMM data is described next. and M4 and M2, respectively. Once trait and method factors
were detected, a confirmatory factor analysis model was esti-mated and different variance components calculated per
stan-Nested CFA Approach
dard procedures (Cote and Buckley, 1987, 1988; Williams, The nested CFA approach subsumes two interrelated
tech-Cote, and Buckley, 1989). niques for partitioning an item’s total variance: (1) estimating
While estimating the variance components of health-care a sequence of successively restricted nested models; and (2)
measures we assume that measure variation is a linear combi-comparing these nested models to determine incremental
nation of traits, methods, and error. In other words, we assume goodness-of-fit.
that trait and method factors do not vary. In contrast, recent For each of the studies in the health-care area that used
research (Bagozzi and Yi, 1991; Browne, 1989; Kim and Lee, the MTMM approach, the amount of measurement error in
1997) using the direct product (DP) model permits the estima-indicators of latent constructs was assessed by estimating a set
tion of models where trait and method factors interact. The of four hierarchically nested models per guidelines originally
multiplicative effect of trait and method factors on measure offered by Widaman (1985) and subsequent modifications
suggested in recent research that use the MTMM technique variation may be justified when differential augmentation or (Bagozzi and Yi, 1990, 1991; Bagozzi, Yi, and Phillips, 1991; differential attenuation is expected to be present among trait Williams, Cote, and Buckley, 1989). To implement the nested and method factors (Bagozzi and Yi, 1991). However, in the approach, four confirmatory factor analysis models were esti- absence of compelling reasons for considering these interac-mated and compared to yield meaningful tests of hypotheses. tions, using multiplicative models may not be justified. Based The nested models that show the possible sources of variation upon our interpretation of the studies from where data have in measures and their representation in a confirmatory factor been reanalyzed, we did not find any strong rationale for analytic model are graphically depicted in Figure 2 and de- including trait and method interations. Consequently, we have
scribed in more detail below. refrained from specifying and estimating DP models.
Recall that from the set of hierarchically nested models Model 1 (M1): is a “null” model that assumes the
intercorre-described earlier, M1 represents a situation where intercorrela-lations among measures can be explained by random error
tions among measures are caused by random error alone. It only and no trait or method factors are present. This null
is highly unlikely that M1 alone can explain the data very model is depicted in panel A of Figure 2.
well, because various measures used in a study are likely to Model 2 (M2): is a “trait-only” model that hypothesizes stem from a conceptual framework and are expected to contain variation in measures can be explained completely by traits some amount of trait and method variances as well. Likewise, assumed to be correlated and by random error. Panel B in M3 holds that method factors and error variances alone can Figure 2 depicts the trait-only model. explain all the variation in measures. This situation of method
Model 3 (M3): depicted in Panel C of Figure 2 is a “method- and error variances accounting for all the variance in measures only” model that hypothesizes variation in measures can does not seem reasonable, because a researcher who employs be completely explained by correlated method factors plus the MTMM technique has likely used some theoretical
guide-random error. lines to develop measures. Although M1 and M3 are not
related to theory at all, M2 suggests that measure variance is Model 4 (M4): is a “trait and method” model where variance
a function of trait factors and error variance. The situation among measures is explained completely by traits,
meth-depicted by M2 is also unlikely, because paper and pencil ods, and random error, with freely estimated correlations
measures used to measure latent constructs are expected to among trait factors and correlated method factors. Panel
contain some degree of method variance. Hence, M4, which D in Figure 2 depicts the trait and method model.
is a trait and method model, is expected to outperform M1, To implement the nested approach and determine the best M2, and M3. In other words, M4 is more representative of fitting model, a sequence ofx2difference tests were conducted.
actual data than the other nested models. Given these observa-First, Model 2 (M2) was compared with the null model (M1) tions we hypothesize that:
to determine whether trait factors were present or not. Model
H1: For the studies under consideration, the trait and comparison entails computing thex2difference between two
method model (M4), which holds that the variance models and calculating the corresponding difference in the
in measures of latent constructs can be explained by degrees of freedom. A rejection of the null hypothesis (H0:
traits, methods, and random error, will outperform The compared models offers no incremental fit of model to
198
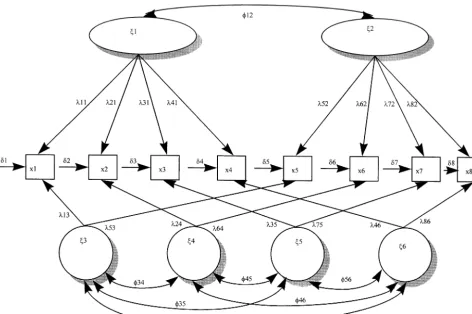
J Busn Res D. P. Mishra 2000:48:193–205Figure 3. CFA model of MTMM data in Saylor Finch, Baskin, Furey, and Kelly’s (1984)j1,j2,5trait factors;j3,j4,j5,j65method factors;l 5factor loading;φ5factor correlation; x5measured variable;d 5random error.
only), M2 (trait plus error), and M3 (method plus tional Journal of Nursing Studies, and American Journal of Public
error). Health.
Based upon our search, we uncovered 19 studies that claimed to have used the MTMM method for examining the
Data Collection
convergent and discriminant validity of measures. Of these To identify studies in the health-care area that have used
19 studies, 15 articles were excluded, because either they did MTMM matrices for assessing the validity of measures, we
not publish the MTMM matrices at all (e.g., Greenbaum, turned to several published sources and implemented a
sys-Dedrick, Prange, and Friedman, 1994) or published a partial tematic search process along the lines followed by Cote and
MTMM matrix (e.g., Sidani and Jones, 1995) that could not Buckley (1987). First, we examined Turner’s (1981) article,
be used for reanalyzing the data. Hence, our empirical analysis which lists 70 studies in which the MTMM method was used.
is based upon correlation data provided in four different stud-Second, we examined the PSYCHLIT database for the 1979–
ies that have used the MTMM design. 1994 time period and searched for studies in the health-care
Although the few studies that have used the MTMM method area by using “MTMM,” “multitrait,” and “multimethod” as
in health-care research might seem atypical, a closer scrutiny keywords. In addition, we also examined the MEDLINE and
of available evidence from other streams in the social sciences ABI-INFORM databases for the 1980–1995 time period to
suggests that this is not so. For example, Bagozzi and Yi (1991) identify published studies that used the MTMM technique.
reported that only four studies that used the MTMM design Finally, we visually examined all articles that appeared in
were published over a 17-year period in theJournal of Con-major health-care journals between 1990 and 1994 for
evi-sumer Research. Explaining the relatively infrequent use of the dence of use of the MTMM procedure. The major journals
MTMM method in social science research, Bagozzi and Yi that we examined wereResearch in Nursing and Health, Medical
(1991) note that “one explanation [for this paucity of pub-Care, Heart and Lung, Journal of Health Care Marketing,
Ad-lished studies] is the difficulty in obtaining multiple measures vances in Nursing Science, Journal of Consulting and Clinical
of each construct in one’s theory and using different methods Psychology, Nursing Research, Journal of the American Medical
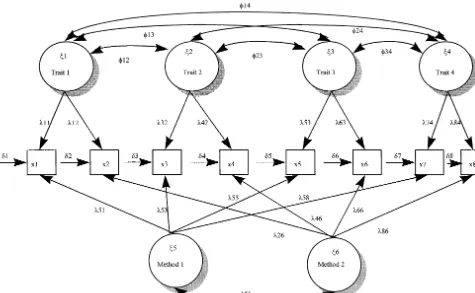
(1992) in a review article note that over a 10-year period, WOLFE (1991). The authors developed the “Children’s Impact of Traumatic Events Scale (CITES)” for assessing the impact only six studies that reported the use of the MTMM procedure
of sexual abuse from the child’s perspective. Seventy-eight were published in the major nursing journals. Given the
rela-scale items were used to measure four traits;PTSD(a compos-tively infrequent use of MTMM matrices for construct
valida-ite factor of intrusive thoughts, avoidance, hyperarousal, and tion across a number of disciplines, the present dataset seems
sexual anxiety),Social Reactions,Abuse Attributions, and Eroti-adequate enough to estimate empirically the extent to which
cism. Two methods were used for construct validation: (1) measurement error is present in health-care research measures.
the CITES-R scale; and (2) a combined scale comprising items from a number of scales (i.e., SAFE, CBCL-FTSD etc.; Wolfe,
Description of Studies
Gentile, Michienzi, Sas, and Wolfe, 1991). In a sample size A few studies in health-care research (e.g., Marsh and
Gouver-of 60 respondents, the researchers found some evidence Gouver-of net, 1989; Saylor, Finch, Baskin, Furey, and Kelly, 1984;
convergent and discriminant validity but acknowledged that Sidani and Jones, 1995; Wolfe, Gentile, Michienzi, Sas, and
their results were prone to measurement error biases. The Wolfe, 1991) have used MTMM matrices for examining the
CFA model for the Wolfe study is shown in Figure 4. construct validity of measures. Specifically, the Saylor and
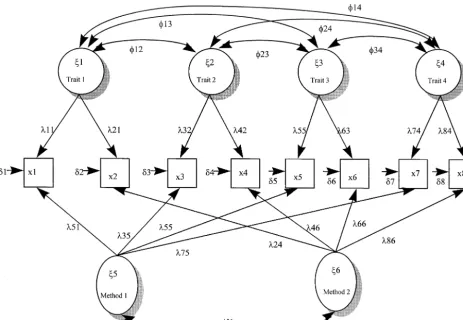
colleagues study investigates the construct validity for mea- MARSH AND GOUVERNET (1989). The construct validity of sures of “childhood depression” using an MTMM approach, children’s responses to two multidimensional self-concept and the Wolfe and colleagues study develops and validates a scales (methods) for measuring four traits (physical skill, social scale for assessing the impact of sexual abuse from the child’s skill, general skill, and cognitive skill) was assessed by means perspective. In both these articles, a reasonable degree of of an MTMM analysis based on 508 responses. The authors “convergent” and “discriminant” validity was reported by the of this study found “strong support for both the convergent authors. However, these studies did not use a CFA framework, and discriminant validity of responses to these two multidi-rendering the observed results prone to measurement error mensional self-concept instruments” (p. 63). Figure 5 illus-biases. In fact, Wolfe and colleagues explicitly acknowledge trates the CFA model pertaining to the Marsh and Gouvernet that “of concern is the magnitude of error variance . . . which (1989) study.
means that scores on the tests are more subject to unknown
SINGH (1991). In a study involving 368 subjects, the author sources of variance than they are to the recognized sources,”
used a pseudo-MTMM approach, where three different traits and go on to say that “these results call for a subsequent
(i.e., physician satisfaction, hospital satisfaction, and insurance confirmatory factor analysis of the items” (p. 382). We hope
satisfaction) were measured by two different methods; namely, that the results of our analysis will answer some of their
the over-all item and multi-item ratings. Convergent and dis-concerns. We describe these aforementioned studies more
criminant validity of measures was evaluated by means of fully in the following paragraphs.
CFA. Although the MTMM matrix was not reported in the study, estimates of trait and method loadings were provided
SAYLOR, FINCH, BASKIN, FUREY, AND KELLY (1984). This study
by the author, which, in turn, permits us to estimate the investigated the construct validity of childhood depression
amount of trait, method, and error variances in the measures. measures. Specifically,two trait factors,angerand depression,
Note that because Singh’s (1991) study does not publish the were measured byeight items(four each for anger and
depres-pseudo-MTMM matrix, we do not reanalyze the MTMM ma-sion) and four methods. The CFA model pertaining to this
trix by CFA. On the other hand, we use the factor loadings study is depicted in Figure 3. The first method used was a
(for traits and methods) reported in the study to compute “Children’s Depression and Anger” inventory (Kovacs, 1981;
variance estimates for the measures. Figure 6 depicts the CFA Nelson and Finch, 1978). The second format was the “Peer
model for the Singh (1991) study. Nomination Inventory of Depression and Anger” (Finch and
MTMM matrices reported in the studies described above Eastman, 1983; Lefkowitz and Tesiny, 1980). The last two
(with the exception of Singh, 1991) were reanalyzed by using methods were the “Teacher Nominated Inventory of
Depres-the CFA procedure (Bentler, 1992). Specifically, Depres-the nested sion and Anger” (Saylor, Finch, Baskin, Furey, and Kelly,
approach of Widaman (1985) described earlier was used to 1984), and the “AML Rating Form” (Cowen, Door, Clarfield,
estimate a set of hierarchical (nested) factor analytic models. and Kreling, 1973), respectively. Construct validity of
mea-The results of our analysis are discussed in the next section. sures was investigated by means of an 838 multitrait (2 traits)
multimethod (4 methods) matrix based on 133 responses.
Interestingly, although the authors found some support for
Results
convergent and discriminant validity, they also expressedcon-Model Estimation Results
cern over measurement error, which was an important source
200
J Busn Res D. P. Mishra 2000:48:193–205Figure 4. CFA model of MTMM data in Wolfe, Gentile, Michienzi, Sas, and Wolfe’s (1991) study.j1,j2,j3,j45trait factors;j5,j65
method factors;l 5factor loading;φ5factor correlation; x5measured variable;d 5random error.
EQS was preferred over Lisrel VII (Joresko¨g and Sorbo¨m considered in the present study, intercorrelations among items can be best explained by a combination of random error, 1989), because the EQS program automatically imposes
bounds on negative error variances (Heywood cases), which method factors, and trait factors.
For estimating the amount of trait, method, and random are constrained at the lower limit of “0,” yielding stable
param-eter estimates. As Williams, Cote, and Buckley (1989) note error variance in each measure, we squared the loading of each item in the final model (M4) on its corresponding trait “Heywood cases are quite common in MTMM analyses using
confirmatory factor analyses” (p. 463). By using the EQS soft- and method factor. Error variances were freely estimated by the EQS program. Note that for some items, error variances ware we attempted to minimize estimation problems
associ-ated with negative error variances. had to be fixed at the lower bound of zero for model identifica-tion (Dillon, Kumar, and Mulani, 1987) and for avoiding For each dataset we analyzed, thetrait and methodmodel
(M4) provides the best fit of data to theory, thereby supporting Heywood cases. The results of variance partitioning are de-tailed in Table 2.
H1. Specifically, different model comparisons yield significant values of thex2 difference test for the various nested model
Variance Partitioning Results
comparisons. For example, in the Saylor, Finch, Baskin, Furey,
and Kelly (1984) study, each model comparison is significant For the Saylor, Finch, Baskin, Furey, and Kelly (1984) study, (M2–M1: Dx2 5 156, df 5 9, p, .0001; M4–M3:Dx2 5
estimates of trait variance vary from a low of 7% to a high of 133,df5 14, p, .0001; M3–M1:Dx2 5 95,df 59,p ,
Figure 5. CFA model of MTMM data in Marsh and Gouvernet (1991).j1,j2,j3,j45trait factors;j5,j65method factors;l 5factor loading;φ5factor correlation; x5measured variable;d 5random error.
of 21% to a high of 77%, and both the method (17–50%) in health-care research seem to perform more poorly than their social science counterparts in measuring trait variance. and error variance (1–34%) estimates seem moderately high.
For the Singh (1991) study, estimates of trait variances vary Specifically, although the typical health-care measure in this study contains an average of only 35.6% trait variance, Cote from a low of 2% to a high of 74%, and the method (25–64%)
and error variance (2–53%) values seem to be high. Across and Buckley (1987) reported that, on average, measures in the social sciences contained 41.7% trait variance.
all studies (including two published studies that were not
reanalyzed), the mean values of trait (35.6%), method (30%), We can only speculate on some of the possible reasons for the presence of high measurement error in health-care and random error (34.4%) variances suggest the widespread
prevalence of measurement error in health-care measures. We research. First, because some subdisciplines within health-discuss these results in greater detail in the following sections. care research (e.g., patient satisfaction, TQM) are relatively new, a number of new instruments are being developed by researchers to understand phenomena without paying
ade-Conclusions
quate attention to the construct validity of these instruments.Consequently, measures have not been successively refined This paper has two main objectives: (1) to estimate the amount
and validated. For example, many studies in the Journal of of measurement error in health care research; and (2) to
Clinical Psychology represent attempts at developing new
illustrate the use of the CFA technique as a viable method
scales. Such an emphasis on new scales is understandable for modeling measurement error in health-care research. We
given the relative “youth” of the discipline where new concepts hoped to estimate empirically the degree of measurement error
and scales have to be developed for tackling the impact of in health-care measures so that researchers would be sensitized
changing social mores on everyday life (e.g., industrialization to the interaction between construct validity and error variance.
on depression; alternative life styles on AIDS). Although the The results of our reanalysis underline the presence of
direction of research effort toward the development of new high levels of measurement error in health-care research. In
202
J Busn Res D. P. Mishra 2000:48:193–205Figure 6. CFA model for MTMM data in Singh (1991).j1,j2,j35trait factors;j4,j55method factors;l 5factor loading;φ5factor correlation; x5measured variable;d 5random error.
attention to refining existing scales. To this extent, scale purifi- undertaken in line with guidelines established by psychomet-ric theory (Nunnally, 1978). Several excellent illustrations of cation efforts may be greatly aided by placing a relatively
greater emphasis on replication studies (Hubbard and Arm- the use of proper procedures for developing better measures of latent constructs exist in the literature (Churchill, 1979; strong, 1994).
Another reason for the presence of high amounts of mea- Gerbing and Anderson, 1988; Kim and Lee, 1997; Singh and Rhoads, 1991; Suen 1990). Second, researchers should surement error seems to be the dominance of a paradigm that
has historically emphasized the assessment of technical aspects undertake more replication studies in the future (Hubbard and Armstrong, 1994). Specifically, researchers may use existing of health-care quality. For example, a historical quality
mea-scales as a basis for replication and consequent purification sure for nursing homes may involve computing composite
of measures. Finally, in undertaking statistical analyses, re-scores on such tangible and objective entities as room odor,
searchers may make use of such techniques as covariance rodent control, and soiled linen handling (Gustafson, Sainfort,
structure modeling, which allows the decomposition and esti-Van Konigsveld, and Zimmerman, 1990). In contrast to the
mation of total variance in measures into its various error use of such direct measures, today’s health-care quality
mea-components. Covariance structure modeling is easily imple-sures are often more perceptual in nature (e.g., patient
satisfac-mented by using such a technique as EQS (Bentler 1992). tion). Consequently, while making a transition from the use of
Although covariance structure models do not eliminate mea-direct measures to more perceptual measures, construct
valida-surement error in measures, they provide less biased estimates tion efforts have lagged behind.
of true relationships among various theoretical constructs. How should health-care researchers improve upon the
rela-tively poor quality of measures? We suggest a multipronged
approach to this problem. First, irrespective of the chronologi-
Limitations
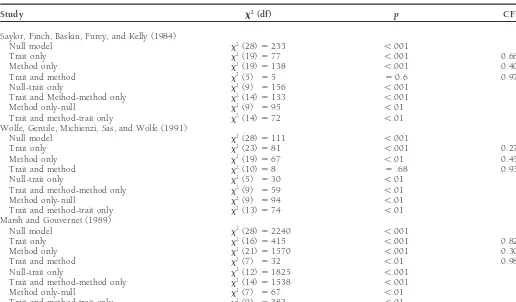
cal stage of the discipline, health-care researchers should payTable 1. Statistics for Nested Models and Model Differences
Study x2(df) p CFIa
Saylor, Finch, Baskin, Furey, and Kelly (1984)
Null model x2(28)5233 ,.001
Trait only x2(19)577 ,.001 0.668
Method only x2(19)5138 ,.001 0.408
Trait and method x2(5) 55 50.6 0.978
Null-trait only x2(9) 5156 ,.001
Trait and Method-method only x2(14)5133 ,.001
Method only-null x2(9) 595 ,.01
Trait and method-trait only x2(14)572 ,.01
Wolfe, Gentile, Michienzi, Sas, and Wolfe (1991)
Null model x2(28)5111 ,.001
Trait and method-method only x2(14)51538 ,.001
Method only-null x2(7) 567 ,.01
Trait and method-trait only x2(9) 5383 ,.01
All models were estimated by the EQS software package.
aCFI per Bentler (1990).
Bentler, P. M.: Comparative Fit Indexes in Structural Models.
Psycho-matrices. As a result, our findings may not be sufficiently
logical Bulletin107 (1990): 238–246.
generalizable. However, as Bagozzi and Yi (1991) note, there
Bentler, P. M.: EQS: Structural Equations Program Manual. BMDP
is a paucity of published MTMM matrices in many disciplines.
Statistical Software, Los Angeles, CA. 1992.
To the extent that many studies have not measured traits
Blalock, Hubert M.:Conceptualization and Measurement in the Social
using different methods, we suspect that the overall picture
Sciences.Sage, Thousand Oaks, CA. 1982.
in terms of measurement error may be even worse. However,
Browne, Michael W.: Relationship Between an Addictive Model and
the results of our analyses are in line with extant literature on
a Multiplicative Model for Multitrait Multimethod Matrices, in
measurement error and validity in the social sciences (Blalock,
Multiway Data Analysis. R. Coppi and S. Bolaco, eds.,
North-1982; Venkatraman and Grant, 1986), and may serve as a Holland, Amsterdam. 1989, pp. 507–520.
starting point for calling more attention to construct validity Byrne, Barbara:Structural Equation Modeling with EQS and
EQS/Win-issues in health-care research. dows. Sage, Thousand Oaks, CA. 1994.
Campbell, Donald T., and Fiske, Donald W.: Convergent and Dis-criminant Validation by the Multitrait–Multimethod Matrix.
Psy-References
chological Bulletin56 (March 1959): 81–105. Bagozzi, Richard P., and Yi, Youjae: Assessing Method Variance in
Casalou, Robert F.: Total Quality Management in Health Care.
Hospi-Multitrait–Multimethod Matrices: The Case of Self-Reported
Af-tal and Health Services Administration36(1) (Spring 1991): 134– fect and Perceptions at Work.Journal of Applied Psychology 75
146. (1990): 547–560.
Churchill, Gilbert A., Jr.: A Paradigm for Developing Better Measures Bagozzi, Richard P., and Yi, Youjae: Multitrait–Multimethod Matrices
of Marketing Construct.Journal of Marketing Research16 (Febru-in Consumer Research.Journal of Consumer Research17 (March
ary 1979): 64–72. 1991): 426–439.
Cole, D. A., Howard, G. S., and Maxwell, S. E.: Effects of Mono Bagozzi, Richard P., Yi, Youjae, and Phillips, Lynn W.: Assessing
versus Multiple Operationalization in Construct Validation Ef-Construct Validity in Organizational Research.Administrative
Sci-forts.Journal of Consulting and Clinical Psychology49 (1981): 395–
ence Quarterly36 (September 1991): 421–458.
405. Beck, A. T.:Depression: Clinical, Experimental, and Theoretical Aspects.
204
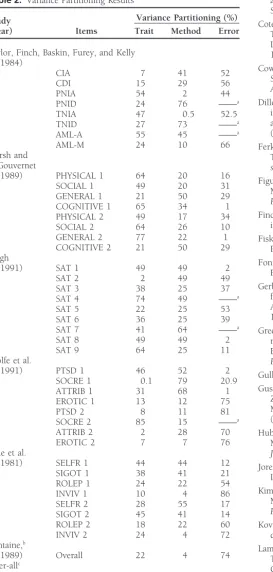
J Busn Res D. P. Mishra 2000:48:193–205Table 2. Variance Partitioning Results and Error Variance: Generalizing Across 70 Construct Validation Studies.Journal of Marketing Research24 (August 1987): 315–318.
Variance Partitioning (%)
Study Cote, Joseph A., and Buckley, M. Ronald: Measurement Error and (Year) Items Trait Method Error Theory Testing in Consumer Research: An Illustration of the
Importance of Construct Validation.Journal of Consumer Research
Saylor, Finch, Baskin, Furey, and Kelly 14 (March 1988): 579–582. (1984)
Cowen, E., Door, D., Clarfield, S., and Kreling, B.: The AMLIA
Quick-CIA 7 41 52
Screening Device for Early Identification of School Maladaptation.
CDI 15 29 56
American Journal of Community Psychology1 (1973): 12–35.
PNIA 54 2 44
Dillon, William R., Kumar, A., and Mulani, N.: Offending Estimates
PNID 24 76 ——a
in Covariance Structure Analysis: Comments on the Causes of
TNIA 47 0.5 52.5
and Solutions to Heywood Cases.Psychological Bulletin 101(1)
TNID 27 73 ——a
(1987): 126–135.
AML-A 55 45 ——a
AML-M 24 10 66 Ferketich, Sandra L., Figuerdo, Aurelio J., and Knapp, Thomas R.: Marsh and The Multitrait–Multimethod Approach to Construct Validity.
Re-Gouvernet search in Nursing and Health14 (August 1991): 315–320. (1989) PHYSICAL 1 64 20 16 Figuerdo, Aurelio J., Ferketich, Sandra L., and Knapp, Thomas R.:
SOCIAL 1 49 20 31 More on MTMM: The Role of Confirmatory Factory Analysis. GENERAL 1 21 50 29 Research in Nursing and Health14 (October 1991): 387–391.
COGNITIVE 1 65 34 1
Finch, A. J., and Eastman, E. S.: A Multimethod Approach to
Measur-PHYSICAL 2 49 17 34
ing Anger in Children.Journal of Psychology115 (1983): 55–60.
SOCIAL 2 64 26 10
GENERAL 2 77 22 1 Fiske, Donald W., and Campbell, Donald T.: Citations Do Not Solve COGNITIVE 2 21 50 29 Problems.Psychological Bulletin112(3) (1992): 393–395. Singh Fontaine, D. K.: Measurement of Nocturnal Sleep Patterns in Trauma
(1991) SAT 1 49 49 2 Patients.Heart and Lung18 (1989): 402–410.
SAT 2 2 49 49
Gerbing, David W., and Anderson, James C.: An Updated Paradigm
SAT 3 38 25 37
for Scale Development Incorporating Unidemensionality and its
SAT 4 74 49 ——a
Assessment.Journal of Marketing Research25 (May 1988): 186–
SAT 5 22 25 53
192.
SAT 6 36 25 39
SAT 7 41 64 ——a Greenbaum, Paul E., Dedrick, Robert F., Prange, Mark E., and
Fried-SAT 8 49 49 2 man, Robert M.: Parent, Teacher, and Child Ratings of Problem SAT 9 64 25 11 Behaviors of Youngsters With Serious Emotional Disturbances. Wolfe et al. Psychological Assessment6(2) (1994): 141–148.
(1991) PTSD 1 46 52 2 Gulliksen, H.:Theory of Mental Tests, Wiley, New York. 1950.
SOCRE 1 0.1 79 20.9
Gustafson, David H., Sainfort, F. C., Van Konigsveld, Richard, and
ATTRIB 1 31 68 1
Zimmerman, David R.: The Quality Assessment Index (QAI) for
EROTIC 1 13 12 75
Measuring Nursing Home Quality.Health Services Research25(1)
PTSD 2 8 11 81
(1990): 97–127.
SOCRE 2 85 15 ——a
ATTRIB 2 2 28 70 Hubbard R., and Armstrong, J. S.: Replications and Extensions in EROTIC 2 7 7 76 Marketing: Rarely Published but Quite Contrary. International
Cole et al. Journal of Research in Marketing11 (1994): 233–248.
(1981) SELFR 1 44 44 12 Joresko¨g, Karl G., and Sorbo¨m, Dag:Lisrel 7: User’s Reference Guide. SIGOT 1 38 41 21 Indiana Scientific Software. 1989.
ROLEP 1 24 22 54
Kim, Chankon, and Lee, Hanjon: Development of Family Triadic
INVIV 1 10 4 86
Measures for Children’s Purchase Influence.Journal of Marketing
SELFR 2 28 55 17
Research35 (August 1997): 307–321.
SIGOT 2 45 41 14
ROLEP 2 18 22 60 Kovacs, M.: Rating Scales To Assess Depression in School-Age Chil-INVIV 2 24 4 72 dren.Acta Paedopsychiatry23 (1981): 437–457.
Fontaine,b
Lammers, John C., Cretin, Shan, Gilman, Stuart, and Calingo, E.: (1989) Overall 22 4 74 Total Quality Management in Hospitals: The Contributions of Over-allc
Commitment, Quality Councils, Teams, Budgets, and Training estimates 35.6 30 34.4 to Perceived Improvement at Veterans Health Administration
Hos-pitals.Medical Care34(5) (1996): 463–478.
aValue of this estimate was fixed at zero for identification purposes.
Lefkowitz, M. M., and Tesiny, E. P.: Assessment of Childhood
De-bOver-all value estimated by ANOVA by Rowe and Ryan-Wenger (1992).
pression.Journal of Consulting and Clinical Psychology48 (1980):
cFontaine (1989) excluded.
43-50.
Lemke, S., and Moos, R.: Quality of Residential Settings for Elderly Adults.Journal of Gerontology4(2) (1986): 268–276.
and Fiske: Assessment of Convergent and Discriminant Validity. Sidani, Souraya, and Jones, Elaine: Use of Multrait Multimethod (MTMM) to Analyze Family Relational Data. Western Journal of Research in Nursing and Health15 (1992): 67–75.
Nursing Research17(5) (1995): 556–570. Marsh, Herbert W.: Confirmatory Factor Analyses of Multitrait–
Singh, Jagdip: Understanding the Structure of Consumers’ Satisfaction Multimethod Data: Many Problems and a Few Solutions.Applied
Evaluations of Service Delivery.Journal of the Academy of Marketing Psychometric Measurement13(4) (December 1989): 335–361.
Science19(3) (1991): 223–244. Marsh, Herbert W., and Hocevar, Dennis: A New More Powerful
Singh, Jagdip, and Rhoads, Gary K.: Boundary Role Ambiguity in Approach to Multitrait–Multimethod Analyses: Application of
Sec-Marketing Oriented Positions: A Multidimensional, Multifaceted, ond-Order Confirmatory Factor Analysis.Journal of Applied
Psychol-Operationalization.Journal of Marketing Research28 (August 1991):
ogy73(1) (1988): 107–117.
328–338. Marsh, Herbert W., and Gouvernet, Paul J.: Multidimensional
Self-Suen, Hoi K.:Principles of Test Theories.Lawrence Erlbaum, Hillsdale, Concepts and Perceptions of Control: Construct Validation of
Re-NJ. 1990. sponses by Children.Journal of Educational Psychology81(1) (1989):
Turner, Carol J.:The Multitrait–Multimethod Matrix: 1967–1980.JSAS
57–69.
Catalog of Selected Documents in PsychologyMs. 2280. 1981. Nelson, W. M., and Finch, A. J.: The Children’s Inventory of Anger
Venkatraman, N., and Grant, John H.: Construct Measurement in (CIA). Unpublished manuscript, Medical University of South
Caro-Organizational Strategy Research: A Critique and Proposal.Academy
lina. 1978.
of Management Review11(1) (1986): 71–87. Nunnally, Jum C.:Psychometric Theory.McGraw-Hill, New York. 1978.
Waltz, C. F., Strickland, O. L., and Lenz, E. R.:Measurement in Nursing
Phillips, L. R., Rempusheski, V. F., and Morrison, E.: Developing and Research.Davis, Philadelphia. 1984.
Testing the Beliefs about Caregiving Scale.Research in Nursing and Widaman, Keith F.: Hierarchically Nested Covariance Structure Models Health12 (1989): 207–220. for Multitrait–Multimethod Data.Applied Psychological Measurement
9 (March 1985): 1–26. Saylor, Conway Fleming, Finch, A. J. Jr., Baskin, Cathy Haas, Furey,
William, and Kelly, Mary Margaret: Construct Validity for Measures Williams, L. J., Cote, J. R., and Buckley, M. R.: Lack of Method Variance of Childhood Depression: Application of Multitrait–Multimethod in Self-Reported Affect and Perceptions at Work: Reality or Artifact? Methodology.Journal of Consulting and Clinical Psychology52(6) Journal of Applied Psychology74 (1989): 462–468.
(1984): 977–985. Wolfe, Vicky Veitch, Gentile, Carole, Michienzi, Teresa, Sas, Louise, Schmitt, Neal, and Stutts, Daniel M.: Methodology Review: Analysis of and Wolfe, David A.: The Children’s Impact of Traumatic Events Multitrait–Multimethod Matrices.Applied Psychological Measurement Scale: A Measure of Post-Sexual-Abuse PTSD Symptoms.Behavioral