Sadokat Narmetova, 2014
The Role Of Video Animation On students Concept Mastery In Title Separation Of Pure substances and Mixtures
Universitas Pendidikan Indonesia | repository.upi.edu | perpustakaan.upi.edu
CHAPTER III
RESEARCH METHODOLOGY
A. Research Method
This research aims to see the students concept mastery in concept separation
pure substances and mixtures. The method was used in this study is a quasi
experimental with design nonequivalen control group.
This research uses quantitative approach (John 2006), based on research
objectives that want to be achieved then research method that chosen by
researcher. In this research identify the students concept mastery when using
video animation in the learning process.
B. Research Design
This research was chose two classess as a sample. The research design in this
paper was comparing Pretest – Posttest (Oskar 2008) in two classess. In learning
process in the control group, the concept was given by using Power Point
Presentation. While in the experimental class, the concept was given by using
video animation as a media.
In this research, pretest was given in both classess before the concept was
delivered. After the concept has been delivered, the students were given the post
test.
Table.3.1
Scheme of Two Group Pretest-Posttest Design.
Pre-test Treatment Post-test
Control
Group
Sadokat Narmetova, 2014
The Role Of Video Animation On students Concept Mastery In Title Separation Of Pure substances and Mixtures
Universitas Pendidikan Indonesia | repository.upi.edu | perpustakaan.upi.edu Experimental
Group
O1 X2 O2
O1 = Pre-test of students’ concept mastery on concept Separation of Pure
Substances and Mixtures
X1 = Power Point Presentation
X2 =Video Animation
O2 = Post-test of students’ concept mastery on concept Separation Pure
Substances and Mixtures. (Martyn 2009).
C. Population and Sample of Study
In this research random sampling used. The research was conducted in the 7th
grade which are 7A and 7B in Junior High School in Lab School Bandung. The
students in second semester of the year 2013/2014 will be involved into this
research. The research will conduct for two weeks at 3 meetings. Population
of this research is in 7th grade students. The 7A consist of 28 students, while the
7B consist of 27 students. So, the number of population in this study 55 students.
D. Instructional Tools
1. Lesson Plan
Lesson plan is the design of instructional arrangement that used to conduct the
learning process. It is used to be teacher’s guidance in conduct learning process to
achieve the intended learning outcome and learning objectives. Learning
objectives of each meeting is different.
2. Learning Scenario
Learning scenario is briefly illustration of lesson plan. Learning scenario is the
design of classroom activity for each meeting that describes initial activity until
closing activity. Learning scenario in experimental group and control group is
Sadokat Narmetova, 2014
The Role Of Video Animation On students Concept Mastery In Title Separation Of Pure substances and Mixtures
Universitas Pendidikan Indonesia | repository.upi.edu | perpustakaan.upi.edu
E. Treatment
In this research, two kinds of treatment was used, which are showing video
animation and power point presentation. Both of treatments are implemented into
different groups, showing video animation and power point presentation were
implemented in experimental group and power point presentation was
implemented in control group.
1. Showing Video Animation
Animated visualization that show both structures and processes help teachers
convey important scientific concepts in chemistry. According to Sorina (2010),
“When running an animation it is important to distinguish between knowledge that involves animation (when the movement is essential to understand the
acquired information) and knowledge with emphasis on animation (when the
movement is not part of the context to be learned, but it is used in order to draw
attention to some aspects of content).” The concept that used in this study is
separation of pure substances and mixtures. This concept is divided into two sub
topic, first topic is about pure substances and mixtures, second topic is about
tecniques of separation. Both topic is delivered by using video animation. Video
animations for those topics was taken from Youtube. Researcher was selected
those video animations carefully. After that those video animations were
eliminated by experts. They eliminated it based on their clarity of voice,
suitability of topic, and time duration. Beacuse it should be understandable for
the students.
2. PowerPoint Presentation
Microsoft PowerPoint is a presentation program in computer that developed
by Microsoft in the Microsoft Office application package. Microsoft PowerPoint
is an application that is widely used for presentation purpose, such as seminar,
promotion of products, as well as scientific activity. PowerPoint is an application
program that is used to create presentation in the form of text, table, picture,
graph, diagram and etc. PowerPoint Presentation should be able to attract the
Sadokat Narmetova, 2014
The Role Of Video Animation On students Concept Mastery In Title Separation Of Pure substances and Mixtures
Universitas Pendidikan Indonesia | repository.upi.edu | perpustakaan.upi.edu
Presentation was used to describe two sub topic, which is about pure substance
and mixtures, and techniques of separation. The PowerPoint Presentation was
made by researcher.
F. Research Instrument
Research instrument is the process of collecting data, analyzing, and find the
solution. The aim of the technique for collecting the data is to support the success
of the research. According to Arikunto (2006:149), the technique of collecting
data is the way that can be used by the research to collect data. There are pre-test
and post-test for two classess. The pre-test conducted at the beginning of the
research. Meanwhile, post-test will be given after conducting of the research.
1. Learning Achievement Test (Pretest and Posttest)
Learning achievement test is an instrument that used to collect the
development of students’ concept mastering in the concept of separation pure
substance and mixture. Learning achievement test that used in this study in the
form of pretest and posttest.
Pretest is conducted before students implementing video animation in the
learning process. Pretest is to investigate basic knowledge of the students in the
concept of separation of pure substance and mixture.
On the other hand, posttest is conducted after students already have
implementing video animation in the learning process. The purpose of conducting
posttest is to measure the development of students’ concept mastering after using
video animation. Posttest activity could be conducted immediately after given the
treatment.
The type of question that used in pretest and posttest is multiple choices about
separation of pure substances and mixtures. It consists of five cognitive level
based on Revised Bloom Taxonomy from C1 until C5. There are 30 questions
used in pretest and posttest. Those questions spread of five cognitive level and
have indicator for each question. Pretest and posttest is shown on the table below.
Sadokat Narmetova, 2014
The Role Of Video Animation On students Concept Mastery In Title Separation Of Pure substances and Mixtures
Universitas Pendidikan Indonesia | repository.upi.edu | perpustakaan.upi.edu Indicator for Pretest-Postest Questions
Indicator Test Item Number
Describe the characteristics of mixtures and pure
substance
1
Classify a variety of substances used in daily life as
pure substance, solutions or mixtures
2, 3, 4
Differentiate the difference between homogeneous
and heteregeneous mixture
5, 8, 10
Describe the other name of homogeneous mixture 6
Describe the parts of solutions 7
Describe the characteristics of suspension and
emulsion
9
Describe the methods used to separate the
components of filtration, dissolving, vaporization,
evaporation, magnetism, and etc
11, 12, 13, 14, 15, 21,
26
Explain and understand about separation methods 16, 17, 18, 19, 20, 22
Compare the separation methods with other methods 30
Conclude the trapped substance in the filter paper 25, 27, 28, 29
Differentiate the properties of components 23
Evaluate and understand about mixtures 24
Instrument or test items should be tested before given to the students to know
the quality of tests. Testing of instruments that have characteristics of both and
must comply with several rules:
a) Validity of Test Items
“Validity of instrument is accuracy of instrument toward the concept that will be measured, so an instrument is called valid if it measure what is purpose”
(Suherman, 2003: 102). An evaluation instrument said to be good when having
high validity. High and low validity of the instrument can be calculated with the
Sadokat Narmetova, 2014
The Role Of Video Animation On students Concept Mastery In Title Separation Of Pure substances and Mixtures
Universitas Pendidikan Indonesia | repository.upi.edu | perpustakaan.upi.edu
study is using judgement from the subject matter experts. The experts who judge
the item test in this study is chemistry experts, they are two chemistry lecturers
from University of Education in Indonesia. In this study, judges evaluate the
appropriateness of item with the criteria such as indicator and level of cognitive.
According to Lawshe, (1975), “if more than half the judges indicate that an item
test is essential, that item test has at least some content validity. Greater levels of
content validity exist as larger numbers of judges agree that an item is essential”.
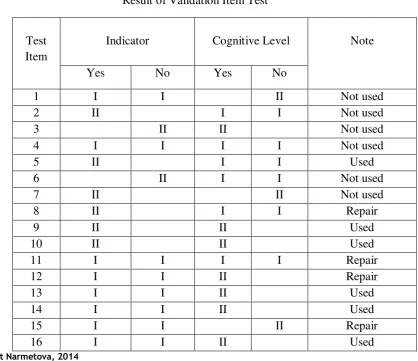
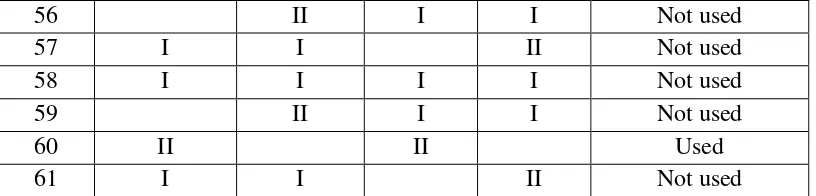
The item test could be rejection or repaired. Because of the judgement in this
study 2 experts, so the item test will be rejection if only one person who agree
with item test. They judge 61-item test, every item test have their indicator and
level of cognitive. After judge with the expert, 19-test items are rejected, 13-test
items are repaired, and 29-item tests are accepted.
Table 3.3
Result of Validation Item Test
Test Item
Indicator Cognitive Level Note
Sadokat Narmetova, 2014
The Role Of Video Animation On students Concept Mastery In Title Separation Of Pure substances and Mixtures
Universitas Pendidikan Indonesia | repository.upi.edu | perpustakaan.upi.edu
Sadokat Narmetova, 2014
The Role Of Video Animation On students Concept Mastery In Title Separation Of Pure substances and Mixtures
Universitas Pendidikan Indonesia | repository.upi.edu | perpustakaan.upi.edu
56 II I I Not used
57 I I II Not used
58 I I I I Not used
59 II I I Not used
60 II II Used
61 I I II Not used
b) Reliability
Reliability of an instrument is intended as a tool that gives the same results if
the measurement is given on the same subject although done by different people,
at different times and different places (Suherman, 2003: 131). It is not affected by
the behavior, circumtances, and conditions. High reliability measurement tool
called a reliable gauge. Reliability of item test is conducted by test it to be
students after test item was evaluated by the experts. Students who test the item
doesn’t come from experimental group and control group. It used 61 test items to calculate reliability. In this research, calculating reliability is using Anatest
progrom to make it efficient.
Table 3.4
Reliability of Item Test
Table 3.4 shows the result of reliability of item test. Reliability value in this
table can be seen in the Reliability test column, it is about 0,51. As general
interpretation, if the reliability value > 0,40 it means that the test item which used
is reliable.
Reliability Statistics
Reliability
test
N of Items
Sadokat Narmetova, 2014
The Role Of Video Animation On students Concept Mastery In Title Separation Of Pure substances and Mixtures
Universitas Pendidikan Indonesia | repository.upi.edu | perpustakaan.upi.edu
After instrument has been tested, it is given to experimental group and control
group in the form of pretest and posttest. Pretest is given to determine prior
knowledge of students in both group, meanwhile posttest is given to show the
development of students’ concept mastering in both group. All test items spread
out into five cognitive level, as follow as:
Table 3.5
Distribution of Test Items in Cognitive Level
Cognitive Level Test Item
C1 – Remembering 1, 6, 26
C2 – Understanding 2, 3, 4, 5, 7, 8, 9, 10, 16, 25 C3 – Applying 11, 12, 13, 14, 17, 18, 19, 20, 21,
22
C4 – Analyzing 23, 27, 28, 29 C5 – Evaluating 15, 24, 30
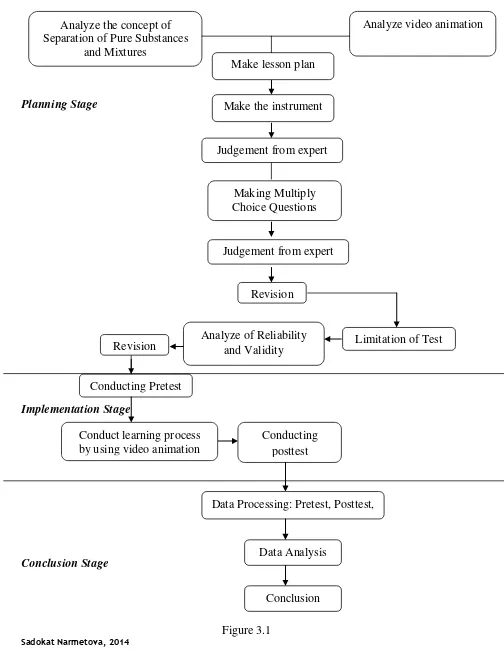
G. Research Procedure
In this research, there are three stages that have done. Which are preparation
stage, data implementation, and the last stage is data analysis stage that descripted
as follows:
1. Preparation stage
Before conduct the research , the researcher should prepare everything
that needed in the research. In the preparation stage are mainly about the steps
when the researcher preparing all instrument being used in research, as follow:
a. Identify issues to be used as research material through observations or
problem that happening nowadays.
b. Reading some literature study such as journal as the foundation to determine
Sadokat Narmetova, 2014
The Role Of Video Animation On students Concept Mastery In Title Separation Of Pure substances and Mixtures
Universitas Pendidikan Indonesia | repository.upi.edu | perpustakaan.upi.edu
c. Determine the material that will be used in the research. In this research,
researcher choose Separation of Pure Substances and Mixtures because this
concept is one of complex concept that students need media.
d. Making lesson plan appropriate with the material taken and video animation
used in the learning process.
e. Making instrument that will be used in the research. Some instruments need
to support the research to be conducted such as Concept Mastery Test which
is Pretest and Posttest.
f. Before the instrument used, firstly it must be validated. In this research two
experts judge the instrument to use in the learning process or not.
g. Doing revision of the instrument to revise mistakes after judged by the
expert.
h. Giving instruments to the students to test the quality of questions.
i. Calculating the reliability of test items.
j. Select the test item which has a good validity and reliability.
k. Determine research sample by using random sampling technique.
2. Implementation stage
In the conduct of research done stages as follows:
a. Conducting the pretest with the same question to the control group and
experimental group to know the basic knowledge of the students before the
learning process.
b. Teach the experimental group by using video animation as an media in
learning activity. Meanwhile the control group using traditional
teaching-learning model by powerpoint presentation that given by teacher during the
lesson activity.
c. After third meeting students given posttest with the exactly same questions as
pretest question distributed to measure the improvement of student’s concept
mastery in both experimental and control group.
Sadokat Narmetova, 2014
The Role Of Video Animation On students Concept Mastery In Title Separation Of Pure substances and Mixtures
Universitas Pendidikan Indonesia | repository.upi.edu | perpustakaan.upi.edu In the final stage performed the following steps:
a. Data analysis done to process the data obtained from the whole research
pretest and posttest data processing done by using SPSS 17.0.
b. Making conclusion from data obtained, namely the improvement of student’s
imrovement in concept mastery.
Sadokat Narmetova, 2014
The Role Of Video Animation On students Concept Mastery In Title Separation Of Pure substances and Mixtures
Universitas Pendidikan Indonesia | repository.upi.edu | perpustakaan.upi.edu Planning Stage
Implementation Stage
Conclusion Stage
Figure 3.1 Analyze the concept of
Separation of Pure Substances and Mixtures
Conducting posttest Conduct learning process
by using video animation
Revision Analyze of Reliability and Validity Limitation of Test Judgement from expert
Make the instrument Make lesson plan
Analyze video animation
Making Multiply Choice Questions
Judgement from expert
Revision
Conducting Pretest
Data Processing: Pretest, Posttest,
Data Analysis
Sadokat Narmetova, 2014
The Role Of Video Animation On students Concept Mastery In Title Separation Of Pure substances and Mixtures
Universitas Pendidikan Indonesia | repository.upi.edu | perpustakaan.upi.edu Research Flow
H. Data Analysis
Data that has been acquired from research instrument then will be processed
by using statistic. Statistic was used to analyze data. Researcher used SPSS 17.0
software (Statistic Product and Service Solution) which is a statistical computer
program that capable to processing statistic data quickly and accurately, as well as
serving in a variety of output.
A. Analysis the role of video animation in students’ concept mastery
To simplify the data processing, all statistical tests in this research was used
SPSS 17.0 software for windows. Details are written in below as follows:
1. Normality Analysis
Normality is identified to search whether gain from experimental and
control group are distributed normally or not. This analysis will be used as the
consideration in analysis data whether the analysis use of parametric or
non-parametric analysis test. If both data distribute normally, we can continue the data
processing to homogeneity test. If the data show that the distribution from one or
all the data not normally distribute, the data processing can continue using
non-parametric statistic it is using Mann-Whitney test.
2. Homogeneity Analysis
After the normality has been identified, the consideration of analysis
method is not able to considered yet. Still another aspect which needs to be
identified is homogeneity. If both data normally distribute and homogeous, the
hypothesis test will be use is t-test, meanwhile if the data comes from normal and
did not have homogenous variences then hypothesis test that will be use is t’test.
3. Score of Mean Difference
Score of mean difference is done to determine whether both experimental
and control group have the same mean score or not. If the data obtained normally
distribute and has homogenous variences the next test will be t-test (independent
t-test). If the data normally distribute and did not have homogenous variences
Sadokat Narmetova, 2014
The Role Of Video Animation On students Concept Mastery In Title Separation Of Pure substances and Mixtures
Universitas Pendidikan Indonesia | repository.upi.edu | perpustakaan.upi.edu
distribute normally and did not have homogenous variences the test will be use is
non-parametric test which is Mann-Whitney test.
4. Significant Test
To analyze the correlation of pretest and posttest result, the determination
of normalized gain index is conducted. Normalized gain is calculated by using of
the formula proposed by Hake (1998):
< g > = % � � � −% � � � �
100 %−% � � �� �
Table 3.6
Table of N-Gain Criteria
Gain Interprets
g > 0,7 High
0,3 <g < 0,7 Medium
g < 0,3 Low
B. Analysis of the improvement of Students’ Concept of Mastery in Cognitive
Level
To simplify the data processing, all statistical tests in this research was used
SPSS 17.0 software for windows. Details are written in below as follows:
1. Normality Analysis
Normality is identified to search whether gain of each cognitive level from
experimental and control group are distributed normally or not. This analysis will
be used as the consideration in analysis data whether the analysis use of
parametric or non-parametric analysis test. If both data distribute normally, we
Sadokat Narmetova, 2014
The Role Of Video Animation On students Concept Mastery In Title Separation Of Pure substances and Mixtures
Universitas Pendidikan Indonesia | repository.upi.edu | perpustakaan.upi.edu
distribution from one or all the data not normally distribute, the data processing
can continue using non-parametric statistic it is using Mann-Whitney test.
2. Homogeneity Analysis
After the normality has been identified, the consideration of analysis
method is not able to considered yet. Still another aspect which needs to be
identified is homogeneity. If both data normally distribute and homogeous, the
hypothesis test will be use is t-test, meanwhile if the data comes from normal and
did not have homogenous variences then hypothesis test that will be use is t’test.
3. Score of Mean Difference
Score of mean difference is done to determine whether both experimental
and control group have the same mean score or not. If the data obtained normally
distribute and has homogenous variences the next test will be t-test (independent
t-test). If the data normally distribute and did not have homogenous variences
then taht will be tested with t’test. Meanwhile if the data obtained did not
distribute normally and did not have homogenous variences the test will be use is
non-parametric test which is Mann-Whitney test.
4. Significant Test
To analyze the correlation of pretest and posttest result, the determination
of normalized gain index is conducted. Normalized gain is calculated by using of
the formula proposed by Hake (1998):
< g > = % � � � −% � � � �