*Corresponding author/Dopisni autor: E-mail:[email protected]
Original scientific paper - Izvorni znanstveni rad UDK: 637.352
Effects of added caper on some physicochemical
properties of White Cheese
Oktay Yerlikaya, Cem Karagozlu*
Ege University Faculty of Agriculture Department of Dairy Technology, 35100 Bornova/İzmir, Turkey
Received - Prispjelo: 27.06.2013. Accepted - Prihvaćeno: 20.01.2014.
Abstract
In this study, the effects of caper berries addition on some physicochemical and functional properties of White Cheese were investigated. Three batches of White Cheese were produced: a control group with no caper addition (C), a group with whole grain caper addition (W) and a group with minced caper addition (M). Caper berries were added to the cheese vat after cutting at a level of 8 g per 100 g of curd weight. Changes in chemical compositions, proteolysis (ripening index), lipolysis (acid degree value), free amino acids, free fatty acids (FFAs), and some mineral substances of White Cheese samples were analysed during the ripening period for 90 days at + 4 °C. According to the results obtained from statistical analyses, when compared to control sample, there was a significant difference by adding caper to White Cheese for salt %, lactic acid %, and mineral contents (p<0.05). Generally, the data obtained from this study showed that adding caper to White Cheese reduced some quality characteristics, while some properties such as physicochemical were improved.
Key words: cheese, ripening, caper, proteolysis, lipolysis
Introduction
Capparies is called capers (Capparis L.) of the Capparaceae family are the fruit of a shrub, a peren-nial plant having medicinal and aromatic properties, and grown wildly at various regions of the world were profited for several purposes since ancient times (Ozcan et al., 2004). The roots, fruits, flower buds and leaves of caper are used in medical action. Also it is used in cosmetic and food industry. The proc-essed flowers (or capers) and fruits (or caper ber-ries) of the shrub Capparis spp. (Capparidaceae) are very popular in the Mediterranean countries for their flavour and digestive properties. Approxi-mately 10.000 tonnes are produced annually, while the main producer and exporter countries are Spain, Morocco, Turkey and Italy. The caper fruits and plant are regarded as an important source of protein. Caper plays an important role in the human diet, since caper fruits contain approximately 67 mg cal-cium, 65 mg phosphorus, 9 mg iron and 24.01 mg protein in 100 g of edible dried substance (Sessiz
et al., 2007). Capers and caper berries have gained importance in the food industry and the international trade, but manufacturing processes are expensive due to the lack of extensive farming of Capparis spp. (production often relies on wild growing plants), the seasonal availability of the raw materials and the absence of processing industries with adequate pro-duction capacities (Pérez - Pulido et al., 2007).
In many countries, young shoots, flower buds, fruits and seeds of C. spinosa are used as nutritional additive. Also, Capparis species were used in the tra-ditional medicine as a poultice and for their diuretic, antihypertensive and tonic properties as well as in cer-tain pathological conditions related to an uncontrolled lipid peroxidation. The fresh aerial parts, including the fruit and the flower buds, are usually stored in salt and vinegar, or brined and used as an appetizer with olives, cheese and nuts or as a complement to meat, salads or pasta. Additionally, fruits with small, soft seeds are preferred for the production pickles (Trombetta et al., 2005; Tlili et al., 2009).
Cheese evolved in the “Fertile Crescent” region between the Tigris and Euphrates rivers, about 8000-9000 years ago. This area now forms part of Turkey, Iraq and Iran. More than 1000 varieties of cheese are produced around the world. In Turkey, nearly 40 different cheeses are known, but only few of them have national and economic value (Hayaloglu et al., 2002). White Cheese is one of the most com-mercially significant types of cheese. Turkish White Cheese has a soft texture when fresh, while after ripening for 3 months in brine, it can be classified as “semi - hard” or “semi - soft” (Oner et al., 2006). White Cheese is made in different ways according to the area of production: using cow’s, water buffalo’s, ewes’ or goat’s milk, or a combination of these with varying proportions of fat and salt. Also a variety of packaging materials are used to store White Cheese, and it may be packaged dry or in brine, with or with-out ripening (Kamber, 2008).
In cheese production, various kinds of herbs are added to cheese curd produced from raw or pasteur-ized milk. After production, the cheese is usually ripened for 3 months. The herbs commonly used in dairy products are as follows: Allium sp., Prangos sp., Silene vulgaris, Tymus sp., and Mentha sp., and these herbs are added to cheese in different ratios. In the herb added dairy products these herbs have odour, flavour and bio-preservative characteristics (Tarakci and Kucukoner, 2008).
Cheese ripening is a complex microbiological and enzymatic process characterized by the produc-tion of compounds that contribute to certain aroma and texture characteristics of cheese. From the tech-nological point of view it is important to determine the changes occurring during the course of ripening in order to standardize and control the manufac-turing process. Also, in some cases, this might help to prevent the alteration of sensory properties of cheese (Temiz et al., 2009).
In this study, caper was used in order to create White Cheese with different flavours and to offer new products with improved nutritional features to the consumers. The aim of this study was also to develop a new cheese making process through addi-tions of whole grain caper and minced caper as well as to create a new food product with improved func-tional properties.
Materials and methods
For cheese production raw cow’s milk sup-plied from Ege University, Menemen Practise and Research Farm in Faculty of Agriculture (Izmir, Tur-key) was used. The average composition character-istics of raw cow’s milk used in making cheese with caper were, 12.70 ± 0.69 % total solids , 4.5±0.42 % fat, 3.65±0.35 % lactose, 0.68±0.02 % total ni-trogen and 0.18±0.01 % acidity as lactic acid.
Rennet was obtained from Mayasan Gida Sa-nayi ve Ticaret A.S. (Yenibosna, Istanbul, Turkey) and used to coagulate milk in liquid form (coagu-lating power 1:8000). Calcium chloride was ob-tained commercially from Horasan Kimya (Ankara). Cheese starter cultures Lactococcus lactis subsp.
lactis and Lactococcus lactis subsp. cremoris (1:1)
were obtained from Maysa Gida Sanayi ve Ticaret A.S. (Kozyatagi, Istanbul, Turkey). Freeze-dried con-centrated cultures were activated by incubating at 37 °C overnight in de Mann, Ragosa, Sharpe (MRS) broth (Fluka Chemie GmbH, Buchs, Switzerland) and this procedure was repeated twice (Halkman, 2005). Activated cultures were incubated overnight at 37 °C in heat-treated (110 °C for 15 min) 12 g per 100 mL reconstituted skim milk before the addition into the cheese vats.
Canned caper berries were obtained from Susi-tas A.S. (Cigli, Izmir) and added to the cheese vat after cutting the curd. The added amount of caper in pickled form was 8 % of curd weight, acidity 1 %, pH=3.5, salt 10 % while the control cheese contained no caper. The experiment was repeated three times and the analyses were carried out in du-plicate.
Methods
Cheese-making and sampling
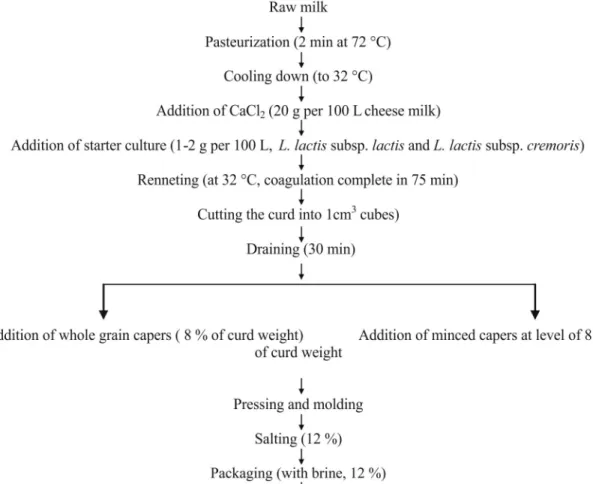
The production of White Cheese with caper addition was carried out in the pilot plant of Dairy Technology Department of Ege University, Izmir, Turkey. Raw milk was first filtered, pasteurized at 72 °C for 2 min and cooled down to 32 °C. Starter cultures were added in amount of 0.5 mL per 100 mL of milk and CaCl2 in amount of 0.2 g per 1000 mL of milk. The milk was then coagulated by using calf rennet. After coagulation, the curd was cut into 1 cm3 cubes. After the removal of whey, curd was
divided into 3 equal groups. One of them was used as control group without caper. After draining of brined capers and keeping them in water for 12 h, capers were drained again and added to curds (in % 8 ratio) in two different ways, as whole and minced, and mixed well. The curd was weighed and cut into blocks of 7 x 7 x 7 cm3. Fresh cheeses were soaked
in brine of 16 % salt for 3 h. Afterwards, the brined blocks were dry salted, taken out and left for 12 h uncovered on a cheese table at room temperature. Cheeses were put into cans with 12 % brine and transferred to cold rooms (4-5 °C), and ripened for 90 days at this temperature (Figure 1).
In the study, the experimental cheese sample without caper addition (control) was labelled as “C”; the sample with addition of whole grain as “W” and the one with minced caper as “M”. From each batch,
samples were taken out on the 1st, 30th, 60th, 90th
days of ripening. In each sample chemical composi-tion, degrees of proteolysis and lipolysis, and mineral elements were analysed.
Caper analysis
Caper samples were analysed for curd weight, acidity, pH and salt content according to Ozcan et al. (2004) and Ozcan and Aydin (2004).
Cheese analysis Chemical analysis
Grated cheese samples were analysed for total solids by oven drying at 102 °C (Anonymous, 2006), fat by the method of Gerber-Van Gulik (Anony-mous, 2006), salt by the Mohr method (Oysun,
2001), pH by the combined electrode Hanna 211 pH meter (Hanna Instruments Inc., Portugal), ti-tratable acidity according to Anonymous (Anony-mous, 2006). The total nitrogen (TN) was meas-ured by the Kjeldahl method according to Gripon et al. (1975). Water soluble nitrogen (WSN) and non-protein nitrogen (NPN) were determined by the Kjeldahl method according to Anonymous (1980). Proteose-peptone nitrogen (PPN) was cal-culated by subtracting WSN from TN. The ripening index was estimated using the formula of WSN / TN x 100 (Venema et al., 1987).
Acid degree value (ADV)
The acid degree value (ADV) is an indicator of fat hydrolysis and was determined according to the method described by Renner (1993).
Free fatty acid analysis
Free fatty acid analyses of cheese samples were determined according to Paquot (1979) in TU-BITAK Marmara Research Centre Food Institute Laboratory.
Tyrosine
Tyrosine was determined by using a spectropho-tometer (722 Grating Spectrophospectropho-tometer Analyti-cal Instrument Factory, Shanghai) at a 650 nm wave-length according to the method described by Citti (1963).
Free amino acid analysis
Free amino acid analyses of cheese samples were determined according to Ozcan and Senyuva (2006)in TUBİTAK Marmara Research Centre Food Institute Laboratory.
Mineral analysis
Contents of calcium, manganese and potassium in cheese samples were determined according to the AOAC 985.35.2005a method. The content of Phosphorus analyses was determined according to the AOAC 986.24.2005b method. Zinc content of cheese samples was determined according to AOAC 999.10.2005c. All minerals analyses were performed in TUBİTAK Marmara Research Centre Food Insti-tute Laboratory.
Statistical analysis
Statistical analysis of the data was performed using the analysis of variance in SPSS© v.9.05 (SPSS
Inc., Chicago, USA). Means with significant dif-ferences were compared by the Duncan’s multiple range tests. All analyses were performed in dupli-cate.
Results and discussion Chemical properties
Mean values for pH, lactic acid, fat, dry matter, salt, salt in dry matter, and fat in dry matter through-out the ripening of cheese samples are presented in Table 1-2.
As presented in Table 1, there was a significant effect of storage on dry matter contents in cheese samples (p<0.05). Also, when compared to the con-trol group, caper addition as whole grain had a sig-nificant effect on the dry matter contents (p<0.05). While an increase was observed in the dry matter content of the control sample after 30 and 90 days of ripening, a decrease was observed in the sample with whole grain caper. During the ripening process, peptide ties in the αS1- casein are being destructed and new ionic groups are formed. These ionic groups play an important role in binding the water in the brine and influence the increase in the water ab-sorption capabilities of proteins during the storage at low temperatures which causes a decrease in the dry matter contents of cheeses (Tzanetakis et al., 2002; Sarantinopoulos et al., 2002; Gursoy and Kinik, 2010). Dry matter contents and changes in the cheese samples during ripening are in agreement with results of other researchers (Sarantinopou-los et al., 2002; Hayaloglu (2003), Gursoy and Kinik (2010), Karaman (2005), Kesenkas and Akbulut (2008).
While the fat content of the control sample increased during ripening, the fat contents of sam-ples with caper addition decreased. Since dry matter contents change during ripening in brine, the com-position of cheese might also change (Kesenkas and Akbulut, 2008). Therefore, components such as fat and salt were evaluated based on their ratios within the dry matter (Anonymous, 2006). The effect of storage was statistically significant (p<0.05) in rela-tion to fat contents in the dry matter hence the fat ratio in the dry matter with minced caper decreased,
while it slightly increased in the control sample and the sample with whole grain caper.
Salt content in a dry matter of samples increased during storage and it was higher in sam-ples with caper than in the control sample (p<0.05). It is obvious that this difference relays on the use of pickled capers. The effect of storage on the salt content in the dry matter was statistically significant (p<0.05) in all of the tested cheese samples. Since salt is water soluble, it’s content is highly affected by the amount of water in the cheese or in other words, by the dry matter ratio. Differences between the dry matter contents most probably also affected the penetration of salt into cheese. Thus, the salt content in cheese can be defined as “salt in dry mat-ter”. Therefore, differences among the cheeses and the changes during storage were found significant (p<0.05). The high ratios of salt contents meas-ured in this study were observed in other studies on white pickled cheeses as well (Gonc and Gahun, 1982; Kinik, 1987). Such findings were probably influenced by factors like the cheese brining, the temperature during brining process; the salt ratio of packaging brine; the acidity of cheese and brine; the composition of cheese and the size of molds (Kinik, 1987; Gursoy et al., 2001; Kesenkas and Akbu-lut, 2008; Gursoy and Kinik, 2010).
While the effect of storage period on pH change in the control sample was significant (p<0.05), it was insignificant in cheeses with caper addition (p>0.05). In comparative examinations among cheese samples, average pH values of cheeses with whole grain caper and minced caper were found close but that of control sample was lower (p<0.05). The pH levels of cheeses with caper addition were lower probably due to the acidity originating from caper brine. Studies on pickled cheeses have reported that pH value of cheeses changed depending on the type and amount of the starter culture, the ripening du-ration, the temperature and garnishes added during the cheese making process (Gardiner et al., 1998; Corbo, 2001; Hannon et al., 2003; Hayaloglu, 2003).
There was a statistically significant (p<0.05) effect of storage on lactic acid percentages in the control sample whereas it was insignificant for the samples with capers (p>0.05). Addition of whole grain caper and minced caper showed a statisti-cally significant influence (p<0.05) on acidity de-velopment in cheese samples In ripening period of cheese, lactic acid metabolism; formation of base by-products such as ammonia and carbonyl and fi-nal products of amino acid catabolism were found interrelated (Gursoy et al., 2000). While acidity Table 1. Changes in chemical composition of cheeses during storage
Cheese
Ripening
(Days) pH Lactic acid(%) (%)Fat Dry Matter(%) Salt(%)
Salt (Dry Matter Basis) (%) Fat (Dry Matter Basis) (%) C 1 5.23±0.04dX 0.67±0.05aY 23.00±1.41aY 45.55±0.07aY 3.52±0.06aZ 7.74±0.06aZ 51.50±0.00aZ 30 5.13±0.04bZ 0.88±0.04bX 24.00±0.00bX 45.80±0.07aX 3.84±0.05bZ 8.39±0.05bZ 52.34±0.00bY 60 4.93±0.04cZ 1.00±0.01cX 24.00±0.00bX 43.33±0.04cY 4.42±0.04cZ 10.22±0.10cZ 55.43±0.00dY 90 4.78±0.04aY 1.09±0.01dX 24.00±1.41bX 43.87±0.04bY 4.50±0.03dZ 10.27±0.04dZ 54.74±0.00cY W 1 5.13±0.39bZ 0.81±0.13aX 23.00±0.02cY 43.84±2.39aZ 4.62±0.05aX 10.58±1.51aY 53.28±8.53cY 30 5.63±0.39aX 0.85±0.18aY 22.00±0.04bY 39.72±0.66Bz 4.67±0.02bY 11.78±1.05bY 55.34±6.21bX 60 5.13±0.11bY 0.88±0.22aY 21.00±0.00aZ 38.51±3.71cZ 5.17±0.00cY 13.43±1.29cX 56.00±3.55aX 90 5.18±0.11bX 0.86±0.26aY 21.00±0.00aZ 38.39±3.08cZ 5.48±0.04dY 14.29±0.24dX 55.80±3.11aX M 1 5.20±0.28bY 0.69±0.07aY 26.00±0.06dX 46.64±1.89aZ 4.46±1.51aX 9.57±0.77aX 55.56±9.89aX 30 5.43±0.25aY 0.70±0.09aZ 24.00±0.05cX 44.17±0.61bY 5.58±0.05bX 13.25±1.31bX 55.52±8.77aX 60 5.20±0.07bX 0.72±0.13aZ 22.00±0.02aY 44.11±2.79bX 5.86±0.04cX 13.29±0.59bY 49.75±3.30bZ 90 5.15±0.21bX 0.75±0.24aZ 23.00±0.00bY 45.13±0.61cX 5.78±0.02dX 12.81±1.48cY 50.12±3.63bZ
C: control, W: whole grain caper, M: minced caper
X,Y,Z,T: Values with the same capital letters in the same column for each analysis differ significantly (P<0.05) a,b,c,d: Values with the same lower-case letters in the same row differ significantly (P<0.05)
development of the control sample showed similarities to those of other studies, it was slower in samples with caper which led us to consider probability of a suppressing capacity of caper on acid bacteria.
Changes in total nitrogen amounts of con-trol samples during storage was found statisti-cally insignificant (p>0.05), but it was signifi-cant in samples with caper (p<0.05). While total nitrogen decreased in the control sample and in sample with whole grain caper during storage, it slightly increased in the sample with minced caper until 60th day and decreased from
then on.
Total nitrogen and protein contents of sam-ple cheeses probably increased due to additions of caper (p<0.05). The highest total nitrogen and protein content was measured in the sam-ple with minced caper and it was followed by the sample with whole grain caper and finally the control sample. According to the literature, fruit of caper contains 24 % protein (Sessiz et al., 2007). This high ratio resulted in increase in total nitrogen and protein contents of cheeses. Protein ratio of the control sample remained almost unchanged during the storage period, while it increased and reached the maximum on the 60th day of storage in the sample with
minced caper. Proteolysis is the most com-plex and perhaps the most important primary biochemical process during ripening of most cheese varieties (Barać et al., 2013). Decrease in protein contents depending on the decrease in total nitrogen can occur due to tendencies of peptides and amino acids with low molec-ular weights to be infused in the brine which emerges from the enzymatic proteolysis of casein (Gursoy and Kinik, 2010). Tyrosine content belongs to one of the indicators which is often used for identifying proteolysis degree in cheese. In this study there was a statistically significant (p<0.05) effect of storage on the amount of tyrosine in the control sample. How-ever, it was insignificant in samples with caper addition (p>0.05). The increase in proteolysis, especially in the control group, most probably resulted from the autolysis of starter culture at final phases of the ripening period (Gursoy and Kinik, 2010; Collins et al., 2003). Table 2. P
roteolysis parameters of cheeses during ripening
Cheese Ripening (Days) TN (%) Protein (%) WSN (%) NPN (%) PPN (%) RI (%) A DV (%) Tyrosin (mg per g) C 1 1.97±0.01 aZ 12.57±0.01 aZ 0.15±0.02 aX 0.13±0.07 dZ 0.02±0.00 cZ 7.56±0.08 aZ 1.33±0.10 aX 1.38±0.01 dZ 30 1.97±0.01 aZ 12.57±0.00 aZ 0.30±0.02 bY 0.22±0.01 cY 0.08±0.00 aY 15.22±0.02 bY 1.38±0.03 abX 3.16±0.03 aY 60 1.96±0.00 aY 12.50±0.00 aY 0.41±0.02 cY 0.33±0.07 bX 0.08±0.00 aZ 20.91±0.02 cX 1.51±0.05 bX 2.66±0.03 bZ 90 1.96±0.00 aY 12.50±0.00 aY 0.52±0.06 dY 0.47±0.01 aY 0.05±0.00 bZ 26.52±0.02 dX 1.54±0.00 bX 1.94±0.02 cZ W 1 2.87±0.10 aY 18.31±0.01 aY 0.29±0.06 bY 0.16±0.01 cY 0.13±0.00 bY 9.76±0.08 aY 1.22±0.00 aY 3.16±0.91 bY 30 2.17±0.69 bY 13.84±0.69 bY 0.34±0.05 cY 0.21±0.01 bY 0.14±0.01 bX 15.67±0.03 bY 1.33±0.00 bY 2.90±1.89 cZ 60 1.96±0.40 cY 12.50±0.40 cY 0.40±0.05 aY 0.25±0.02 aY 0.16±0.01 bX 20.41±0.04 cY 1.40±0.00 cY 4.37±3.42 aY 90 1.81±0.58 dZ 11.55±0.58 dZ 0.52±0.32 dY 0.28±0.00 aZ 0.24±0.00 aX 28.73±0.04 dX 1.54±0.00 dX 4.43±2.38 aX M 1 2.66±0.20 cX 16.97±1.26 dX 0.56±0.01 aZ 0.33±0.01 cX 0.24±0.01 aX 21.05±0.01 aX 1.28±0.07 aZ 4.04±2.31 bX 30 3.07±1.20 bX 19.59±7.97 cX 0.56±0.01 aX 0.41±0.01 bX 0.15±0.00 bX 18.24±0.03 cX 1.33±0.10 abZ 4.19±1.17 bZ 60 3.50±0.00 aX 22.33±0.00 aX 0.58±0.10 aX 0.37±0.01 bX 0.12±0.01 cY 16.57±0.00 dZ 1.47±0.10 abZ 6.18±0.85 aX 90 3.43±0.10 aX 21.89±0.63 bX 0.60±0.00 aX 0.53±0.01 aX 0.08±0.01 dY 17.55±0.06 bZ 1.54±0.00 bX 3.64±3.30 cY C: control, W
: whole grain caper
, M: minced caper
, TN: total nitrogen, WSN: water
-soluble nitrogen,
NPN: non-protein nitrogen, PPN: proteose-peptone nitrogen, RI: ripening index, AD
V
: acid degree value
X,Y
,Z,T
: V
alues with the same capital letters in the same column for each analysis differ significantly (P<0.05)
a,b,c,d: V
alues with the same lower
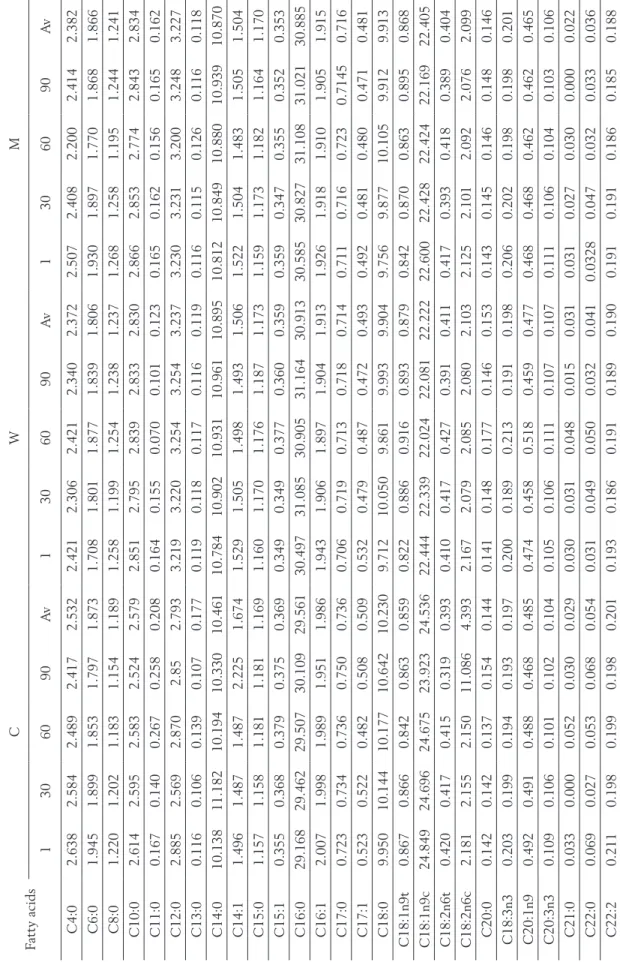
Table 3. Mean free fatty acid composition (%) of cheese samples during 90 days of ripening Fatty acids C W M 1 30 60 90 Av 1 30 60 90 Av 1 30 60 90 Av C4:0 2.638 2.584 2.489 2.417 2.532 2.421 2.306 2.421 2.340 2.372 2.507 2.408 2.200 2.414 2.382 C6:0 1.945 1.899 1.853 1.797 1.873 1.708 1.801 1.877 1.839 1.806 1.930 1.897 1.770 1.868 1.866 C8:0 1.220 1.202 1.183 1.154 1.189 1.258 1.199 1.254 1.238 1.237 1.268 1.258 1.195 1.244 1.241 C10:0 2.614 2.595 2.583 2.524 2.579 2.851 2.795 2.839 2.833 2.830 2.866 2.853 2.774 2.843 2.834 C11:0 0.167 0.140 0.267 0.258 0.208 0.164 0.155 0.070 0.101 0.123 0.165 0.162 0.156 0.165 0.162 C12:0 2.885 2.569 2.870 2.85 2.793 3.219 3.220 3.254 3.254 3.237 3.230 3.231 3.200 3.248 3.227 C13:0 0.116 0.106 0.139 0.107 0.177 0.119 0.118 0.117 0.116 0.119 0.116 0.115 0.126 0.116 0.118 C14:0 10.138 11.182 10.194 10.330 10.461 10.784 10.902 10.931 10.961 10.895 10.812 10.849 10.880 10.939 10.870 C14:1 1.496 1.487 1.487 2.225 1.674 1.529 1.505 1.498 1.493 1.506 1.522 1.504 1.483 1.505 1.504 C15:0 1.157 1.158 1.181 1.181 1.169 1.160 1.170 1.176 1.187 1.173 1.159 1.173 1.182 1.164 1.170 C15:1 0.355 0.368 0.379 0.375 0.369 0.349 0.349 0.377 0.360 0.359 0.359 0.347 0.355 0.352 0.353 C16:0 29.168 29.462 29.507 30.109 29.561 30.497 31.085 30.905 31.164 30.913 30.585 30.827 31.108 31.021 30.885 C16:1 2.007 1.998 1.989 1.951 1.986 1.943 1.906 1.897 1.904 1.913 1.926 1.918 1.910 1.905 1.915 C17:0 0.723 0.734 0.736 0.750 0.736 0.706 0.719 0.713 0.718 0.714 0.711 0.716 0.723 0.7145 0.716 C17:1 0.523 0.522 0.482 0.508 0.509 0.532 0.479 0.487 0.472 0.493 0.492 0.481 0.480 0.471 0.481 C18:0 9.950 10.144 10.177 10.642 10.230 9.712 10.050 9.861 9.993 9.904 9.756 9.877 10.105 9.912 9.913 C18:1n9t 0.867 0.866 0.842 0.863 0.859 0.822 0.886 0.916 0.893 0.879 0.842 0.870 0.863 0.895 0.868 C18:1n9c 24.849 24.696 24.675 23.923 24.536 22.444 22.339 22.024 22.081 22.222 22.600 22.428 22.424 22.169 22.405 C18:2n6t 0.420 0.417 0.415 0.319 0.393 0.410 0.417 0.427 0.391 0.411 0.417 0.393 0.418 0.389 0.404 C18:2n6c 2.181 2.155 2.150 11.086 4.393 2.167 2.079 2.085 2.080 2.103 2.125 2.101 2.092 2.076 2.099 C20:0 0.142 0.142 0.137 0.154 0.144 0.141 0.148 0.177 0.146 0.153 0.143 0.145 0.146 0.148 0.146 C18:3n3 0.203 0.199 0.194 0.193 0.197 0.200 0.189 0.213 0.191 0.198 0.206 0.202 0.198 0.198 0.201 C20:1n9 0.492 0.491 0.488 0.468 0.485 0.474 0.458 0.518 0.459 0.477 0.468 0.468 0.462 0.462 0.465 C20:3n3 0.109 0.106 0.101 0.102 0.104 0.105 0.106 0.111 0.107 0.107 0.111 0.106 0.104 0.103 0.106 C21:0 0.033 0.000 0.052 0.030 0.029 0.030 0.031 0.048 0.015 0.031 0.031 0.027 0.030 0.000 0.022 C22:0 0.069 0.027 0.053 0.068 0.054 0.031 0.049 0.050 0.032 0.041 0.0328 0.047 0.032 0.033 0.036 C22:2 0.211 0.198 0.199 0.198 0.201 0.193 0.186 0.191 0.189 0.190 0.191 0.191 0.186 0.185 0.188 A v: average values C: control. W
: whole grain caper
Findings in terms of the increase in the amount of tyrosine depending on proteolysis in different cheese types are confirmed by other studies such as Dinkci and Gonc (2000), Güven and Karaca (2001), Ozer et al. (2002), Gursel et al. (2003), Kesenkas and Akbulut (2008).
The content of water soluble nitrogen (WSN) during ripening was statistically significant (p<0.05) in the control sample and in the sample with minced capers, while it was insignificant in the sample with whole grain caper (p>0.05). No significant changes were observed in WSN values of the control sam-ple. In samples with whole grain caper and minced caper WSN values decreased until 60th day of
ripen-ing, while the highest values were obtained for both cheeses on the 90th day. Comparative examinations
showed that the sample with minced caper had the highest WSN value on the 90th day of ripening. The
WSN value for both, the control sample and the sample with whole grain caper, were the same.
The protease-peptone nitrogen (PPN) that con-stitutes the coagulated part of WSN together with 12 % trichloroacetic acid (TCA) is used for evalu-ation of ripeness in cheese. PPN changes in cheese samples were statistically significant (p<0.05).
In defining ripeness levels of cheese samples, a correlation factor obtained from the ratio of WSN to total nitrogen (TN) was used. Changes in ripen-ing indexes of all cheese samples durripen-ing ripenripen-ing were statistically significant (p<0.05). The amount of WSN, which is accepted as an indicator of ripen-ing, might differ depending on the TN and humid-ity of cheeses (Gursoy and Kinik, 2010). Results obtained in this study showed similarities to those of Ozer et al. (2002), Gursel et al. (2003), Karaman (2005), Oner et al., 2006, Kesenkas and Akbulut (2008), Gursoy and Kinik (2010).
During the ripening of cheese, a certain amount of present fat undergoes the hydrolysis. Among the hydrolytic products, volatile fatty acids like butyric, caproic, caprylic and capric acids, belong to the most important ones. Considerable amounts of acetic and propionic acids are fromed during hydrolysis of fat and fermentation of lactate. Free fatty acids, with 4-16 carbon atoms have considerable effect on aroma of the cheese (Ayar and Akyuz, 2003). There was a statistically significant (p<0.05) effect of storage on the percentage of free fatty acids in this study. Total
free fatty acids content expressed as ADV increased during ripening in all cheese samples, which occurred probably due to lipolysis originating from microbio-logical activity. Also, in all cheese samples similar val-ues of free fatty acid contents, or ADV, were detected at the early stages of storage. However on the final day of storage, the total free fatty acid values of all cheese samples were equal (1.54 %). The increase in total free fatty acid content through the ripening period in different cheese types was also reported by Georgala et al. (1999), Dinkci and Gonc (2000), Katsiari et al. (2000), Mallatou et al. (2003), Geor-gala et al. (2005), Kesenkas and Akbulut (2008).
Free fatty acid composition
Free fatty acid compositions of all samples are presented in Table 2. Among the saturated fatty acids (SFA), the most abundant was palmitic acid (C16:0), followed by myristic acid (C14:0) and stearic acid (C18:0). Oleic acid (C18:1) content predominated and was the highest among the total unsaturated fatty acids (TUFA). These results were not significantly different among the samples.
From results presented in Table 3 it can be ob-served that fatty acid contents were very similar between samples produced without and with ca-pers. In addition, the ratio of fatty acids to the total amount did not change significantly during ripening. Butyric acid (C4:0) is known as a fatty acid with capabilities that have effect on rancid taste forma-tion in cheese types ripened in brine (Georgola et al., 1999). When compared to the control sample, cheese samples with caper had lower butyric acid contents. In lots of cheese types similar to White Cheese, acids such as, butyric, caproic (C6:0) and caprilic (C8:0) are reported to be indicators of lipo-lytic activities caused by the starter (Akalin et al., 1998). The results concerning ADV contents in this study also support such findings.
As shown in Table 3, ratios of capric (C:10), lauric (C:12) and miristic (C14:0) acids of cheese samples with caper addition were higher in com-parison to the control sample. The above quoted results mentioned related to fatty acids content are relatively higher than those obtained by Kesen-kas (2005). Also, as presented in Table 2, among the long chained fatty acids (C:16-C:20) palmitic acid (C16:0) had the highest proportion within the
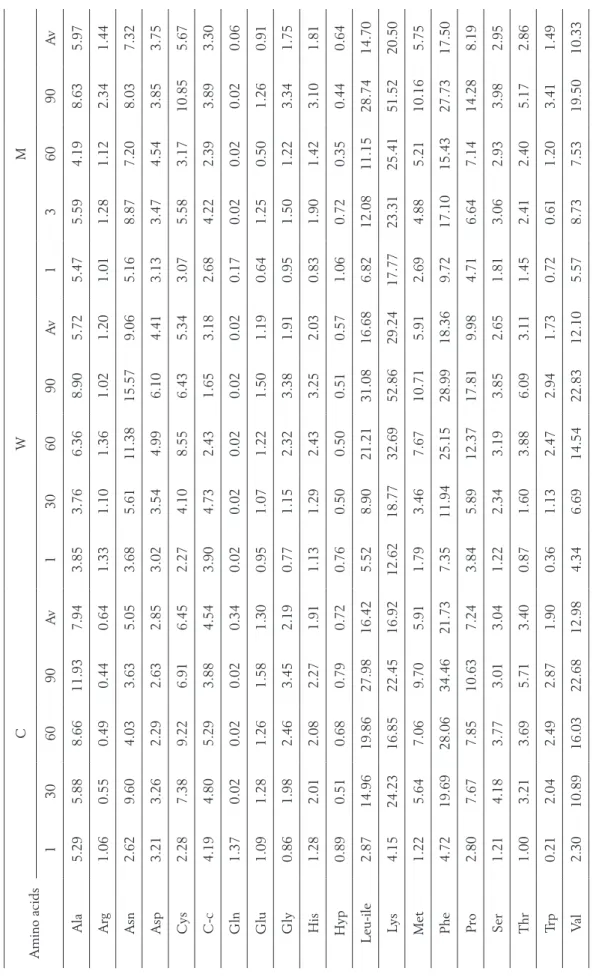
Table 4. Mean free amino acid composition (%) of cheese samples ripened for 90 days (average values) Amino acids C W M 1 30 60 90 Av 1 30 60 90 Av 1 3 60 90 Av Ala 5.29 5.88 8.66 11.93 7.94 3.85 3.76 6.36 8.90 5.72 5.47 5.59 4.19 8.63 5.97 Arg 1.06 0.55 0.49 0.44 0.64 1.33 1.10 1.36 1.02 1.20 1.01 1.28 1.12 2.34 1.44 Asn 2.62 9.60 4.03 3.63 5.05 3.68 5.61 11.38 15.57 9.06 5.16 8.87 7.20 8.03 7.32 Asp 3.21 3.26 2.29 2.63 2.85 3.02 3.54 4.99 6.10 4.41 3.13 3.47 4.54 3.85 3.75 Cys 2.28 7.38 9.22 6.91 6.45 2.27 4.10 8.55 6.43 5.34 3.07 5.58 3.17 10.85 5.67 C -c 4.19 4.80 5.29 3.88 4.54 3.90 4.73 2.43 1.65 3.18 2.68 4.22 2.39 3.89 3.30 Gln 1.37 0.02 0.02 0.02 0.34 0.02 0.02 0.02 0.02 0.02 0.17 0.02 0.02 0.02 0.06 Glu 1.09 1.28 1.26 1.58 1.30 0.95 1.07 1.22 1.50 1.19 0.64 1.25 0.50 1.26 0.91 Gly 0.86 1.98 2.46 3.45 2.19 0.77 1.15 2.32 3.38 1.91 0.95 1.50 1.22 3.34 1.75 His 1.28 2.01 2.08 2.27 1.91 1.13 1.29 2.43 3.25 2.03 0.83 1.90 1.42 3.10 1.81 Hyp 0.89 0.51 0.68 0.79 0.72 0.76 0.50 0.50 0.51 0.57 1.06 0.72 0.35 0.44 0.64 L eu-ile 2.87 14.96 19.86 27.98 16.42 5.52 8.90 21.21 31.08 16.68 6.82 12.08 11.15 28.74 14.70 Ly s 4.15 24.23 16.85 22.45 16.92 12.62 18.77 32.69 52.86 29.24 17.77 23.31 25.41 51.52 20.50 Met 1.22 5.64 7.06 9.70 5.91 1.79 3.46 7.67 10.71 5.91 2.69 4.88 5.21 10.16 5.75 Phe 4.72 19.69 28.06 34.46 21.73 7.35 11.94 25.15 28.99 18.36 9.72 17.10 15.43 27.73 17.50 Pr o 2.80 7.67 7.85 10.63 7.24 3.84 5.89 12.37 17.81 9.98 4.71 6.64 7.14 14.28 8.19 Ser 1.21 4.18 3.77 3.01 3.04 1.22 2.34 3.19 3.85 2.65 1.81 3.06 2.93 3.98 2.95 Thr 1.00 3.21 3.69 5.71 3.40 0.87 1.60 3.88 6.09 3.11 1.45 2.41 2.40 5.17 2.86 Tr p 0.21 2.04 2.49 2.87 1.90 0.36 1.13 2.47 2.94 1.73 0.72 0.61 1.20 3.41 1.49 V al 2.30 10.89 16.03 22.68 12.98 4.34 6.69 14.54 22.83 12.10 5.57 8.73 7.53 19.50 10.33 C: control. W
: whole grain caper
. M: minced caper
. A
v: avarage values
Ala: alanine. Arg: arginine. Asn: asparagine. Asp: aspartic acid. Cys; cycteine. C
-c: Gln: glutamine. Glu: glutamic acid. Gly
: glycine. His: histidine. Hyp: Hydro
xyproline. L
eu-ile:
leucine-isoleucin. L
ys: lysine. Met: methionine. Phe: phenylalanine. P
ro: proline. Ser: serine. Thr: threonine. T
rp: tryptophan. V
total fatty acid content and varied between 29.561-30.913 %. When samples were compared in terms of palmitic acid contents, samples with caper addi-tion had higher values than control samples while the highest value was measured in the sample with whole grain caper addition (30.913 %). No signifi-cant difference was detected between the samples with minced and whole grain caper addition. Follow-ing palmitic acid, the second highest fatty acid con-tent was detected for oleic (C18:1n9c) and stearic acid (C18:0). The average ratio of palmitoleic acid (C16:1), which is reported to indicate the level of lipolysis and to even cause defects in taste and aro-ma, within the composition of fatty acids varies be-tween 1.913 and 1.986 %. Another important fatty acid in the total fatty acids composition is linoleic acid (C18:2 cis-9.12) and it varied from 2.099 % to 4.393 %. When compared to the control samples, caper added samples had lower linoleic acid con-tents.
The composition of fatty acids in cheese sam-ples with caper addition also showed some simi-larities to of the control sample. The amount of fatty acids such as butyric (C4:0), caprolic (C6:0), caprilic (C8:0), which are the indicators of the start-er-dependant lipolytic activity, were almost identical in samples with and without caper addition. This is may indicate that caper addition does not encour-age lipolytic activity. Palmitoleic fatty acid, which indicates the level of lipolysis in cheese and causes defects in cheese taste and aroma, was also found in similar amounts in samples with and without ca-per addition. The content of palmitic acid (C16:0) was higher in samples with caper than in the con-trol sample. Contrary to that, oleic (C18:1 cis-9.12) and stearic (C18:0) acid contents were higher in the control sample.
Free amino acid composition
The content and ratio of FAAs significantly influenced the texture and sensory characteristics of cheese. The relationship between the release of amino acids and the flavour formation in cheese has been assumed by many researchers. Amino acids may contribute to flavour either directly or indirectly by serving as precursors for volatile aroma compounds such as aldehydes, acids, alcohols, esters and sulphur compounds (Eren-Vapur and Ozcan, 2012).
Free amino acid contents in cheese samples with caper and the control sample and changes dur-ing storage are presented in Table 4. The contents of free amino acids such as alanine, cysteine, gly-cine, threonine and valine were high in the control sample, while the contents of arginine, asparagine, aspartic acid, lysine and proline levels were high in samples with caper addition. In general, tryptophane contents in all cheese samples increased during stor-age. Threonine and tryptophan content ratios were the highest in the control sample (Table 4). The contents of leucine and isoleucine were the highest in the sample with grain caper addition, and were followed by the sample with minced caper and the control sample respectively. Valine is mostly found in food products of animal origin. The highest con-tent was detected in the control sample and showed an increasing trend during storage. Lysine, limited in vegetative nutriments but abundant in animal based food (meat, milk, egg), is an important amino acid for human health. While it was detected in quite high amounts in samples with whole grain capers, the content was quite low in the control sample. Similarly to other analysed free amino acids, lysine content also increased during storage.
The highest content of histidine, which exists together with arginine and lysine within globulin structure, was detected in the sample with grain capers and was followed by the control sample and the one with minced caper respectively. The high-est amount of arginine, which constitutes 87 % of protamines, was detected in the sample with whole grain capers. While a decrease of arginine was ob-served in the control sample and the sample with whole grain capers, an increase was observed in the sample with minced capers. Alanine is present in almost all proteins. There is a number of aliphatic and aromatic amino acids are substitution products of alanine. As presented in Table 4, the highest aver-age level of alanine content was detected in the con-trol sample and showed an increase during storage. Asparagine content in the control sample decreased during storage, while it increased in samples with caper addition. According to the average values, the highest asparagine content was detected in the sam-ple with grain caper and was followed by the samsam-ple with chopped/minced caper and the control sample. Cystine was found in highest amounts in the con-trol sample and was followed by the sample with
minced caper and the one with whole grain caper respectively. Proteins containing cysteine are not de-structed easily. Glycine is very important amino acid since it is not available in most proteins and is taking part in disposal of toxic substances out of the body. The contents of glycine increased in all samples during storage and were the highest in the control sample. The highest proline content was measured in the sample with grain capers. Proline contents of samples with caper addition were higher than in the control sample. Serine contents of experimental cheeses varied between 2.65 g / kg and 3.04 g / kg, while the highest content was detected in the con-trol sample. Similar results were obtained by Eren-Vapur and Ozcan (2012).
Mineral substances
Variations in the calcium, potassium, zing, man-ganese and phosphorus contents of cheese samples are presented in Table 5.
There was a statistically significant (p<0.05) ef-fect of storage on the calcium content in the tested
cheese samples. Referring to the obtained average values, calcium content of the control sample was higher in comparison to the samples with caper ad-dition. While calcium contents decreased in the samples with whole grain and minced caper during storage, it increased in the control sample (Table 5). Changes in calcium contents are most probably caused by transfers of minerals from/to brine and cheese (Kesenkas, 2005). Results obtained in this study were higher than those of Mendil (2006) and Karagozlu et al. (2008), but similar to those of Kilic et al. (2002). Thereby, it should be taken into consideration that calcium amounts in raw milk and cheese depend on the season, lactation, feeding and also on the use of CaCl2 in different proportions in cheese making process and their origins as well.
Average phosphorous contents of cheese sam-ples varied between 58.00 and 85.98 mg/kg and the highest phosphorous contents were measured on the 30th day of the storage. The effect of storage on
phosphorous contents of cheese samples was statisti-cally significant (p<0.05). Similar to calcium content Table 5. Changes in mineral composition of cheeses during ripening (mg/1000 g)
Mineral elements Ripening,
days C W M Calcium 1 7530±21.75bX 6274±513.71aZ 7214±605.28aY 30 6762±21.76cX 5523±851.00bZ 6265±279.66bY 90 7893±21.75aX 5081±1170.62cZ 5716±865.15cY x±sd 7062 21.75X 5626±873.35Z 6398±835.77Y Phosphorus 1 34.71±1.81aZ 38.93±36.37cY 57.67±26.45cX 30 123.05±1.81cX 83.73±22.09aZ 92.44±3.92aY 90 100.19±1.81bX 51.35±1.17bZ 78.53±5.09bY x±sd 85.98±1.81X 58.00±28.11Z 76.21±19.82Y Potassium 1 2148±67.88bY 1949±346.48aZ 2663±387.14aX 30 1779±0.00aZ 1944±368.40aY 2530±424.97bX 90 2273±4.24cY 2024±20.15aZ 2625±223.45aX x±sd 2067±231.73Y 1972±229.85Z 2606±282.52X Zinc 1 30.44±0.62aY 29.78±1.97aZ 31.41±12.76aX 30 30.98±0.03aY 27.65±3.85aY 28.28±12.94aY 90 28.18±025bY 25.66±2.40aY 24.83±21.00aY x±sd 29.87±1.36X 27.70±2.88Z 28.17±64.51Y Mangan 1 140.80±1.13aZ 283.63±6.26aX 206.58±9.37aY 30 133.95±1.34bY 184.25±21.07bX 184.95±12.94bX 90 99.99±0.35cY 164.33±61.62cX 162.40±21.00cX x±sd 124.91±19.69X 210.74±64.21Y 184.64±23.01Z
C: control. W: whole grain caper. M: minced caper
X,Y,Z,T: Values with the same capital letters in the same column for each analysis differ significantly (P<0.05) a,b,c,d: Values with the same lower-case letters in the same row differ significantly (P<0.05)
results, phosphorus content was also the highest in the control sample and was followed by the samples with whole grain caper and the one with minced ca-per respectively. Such results probably origin from the lower phosphorus and salt content of the added capers in comparison to the phosphorus content of cheese. In the literature, phosphorus contents of white pickled cheeses varied between 314 and 519 mg per 100 g cheese (Ozdemir, 1990; Dira-man and Demirci, 1998; Demirci, 1998; Kilic et al., 2002; Karagozlu et al. 2008). Also, Greek and Danish Feta cheeses, which have similar proper-ties to Turkish White Cheese, had phosphorus con-tents varying between 377 and 392.06 mg per 100 g cheese (Vafopoulou-Mastroyannaki, 1977). Phosphorus values obtained in this study were lower than those of the above mentioned studies.
Average potassium contents of the cheese sam-ples varied between 1972 mg per kg and 2606 mg per kg and the highest potassium content was de-tected in the sample with minced caper. The effect of storage on potassium contents was statistically significant (p<0.05) for all samples Kilic et al. (2002) reported potassium contents of their cheese samples between 1160-2859 mg/kg, which is almost identical to results obtained in this study. However, these were considerably different from the results obtained by Mendil (2006) and Karagozlu et al. (2008).
The effect of storage on zinc contents was also statistically significant (p<0.05) for all cheese sam-ples. Zinc content of the control sample was higher than in the samples with caper addition. Mendil (2006) reported the zinc content of White Cheeses as; 12.0±1.1 μg per g. Compared to the above pre-sented values, zinc amounts detected in this study were higher.
Capers contain a certain amount of manganese which most probably caused the higher manganese contents in samples with caper addition when com-pared to the control sample. According to the results of the variance analysis and Duncan test, the effect of storage on manganese contents of cheeses was sta-tistically significant (p<0.05).
Conclusion
In this study, effect of capper addition on some physical and chemical properties of White Cheese was investigated. In the overall composition, pa-rameters of the tested cheeses were in compliance with the characteristics of white pickled cheese. Capper addition to cheese showed some negative effects to certain properties, while the chemical properties were improved, particularly the mineral content and the amino acid composition. In cheese making it is possible to make cheese with low salt content by using brine with low salt concentration. In samples with caper addition salt contents were higher than the values recommended by Standards for Turkish White Cheese. To decrease this high salt content, either brine with lower salt concentration or producing, pickled capers in brine with lower salt concentration could be considered. At the time this study was carried out, no publication on mak-ing cheese with capers was available. Evaluatmak-ing the data that this study presents, making cheese with ca-per using different milks (sheep, goat) or with their mixtures could be suggested. In conclusion, we sug-gest conducting further research on improvement of making cheese with caper, considering the growing demand on flavoured cheese types in constantly growing functional food market.
Učinci dodanog kapara na neka
fizikalno-kemijska svojstva
bijelog sira
Sažetak
U ovom radu je istraživan učinak dodatka bobi-ca kapara na neka fizikalno-kemijska i funkcionalna svojstva bijelog sira. Proizvedene su tri serije bijelog sira: kontrolna skupina bez dodatka kapara (C), sku-pina s dodatkom cijelog zrna (W) te skusku-pina s dodat-kom mljevenih kapara (M). Bobice kapara dodane su u sirnu kadu nakon rezanja u količini od 8 g na 100 g gruša. Tijekom zrenja u trajanju od 90 dana +4 °C izuzimani su uzorci bijelog sira te su praće-ne promjepraće-ne kemijskog sastava, proteoliza (indeks zrenja), lipoliza (vrijednost kiselinskog stupnja), a određivan je udjel slobodnih aminokiselina, slobod-nih masslobod-nih kiselina (FFAs) i nekih mineralslobod-nih tvari.
Prema rezultatima dobivenim statističkom analizom, u odnosu na kontrolni uzorak, značajna razlika dobi-vena je dodavanjem kapara u bijeli sir za udjel soli, mliječne kiseline i mineralnih tvari (p<0,05). Opće-nito, podaci iz istraživanja pokazali su da je dodava-nje kapara u bijeli sir smanjilo neka svojstva vezana uz kvalitetu, ali su poboljšana određena fizikalno-ke-mijska svojstva.
Ključne riječi: sir, dozrijevanje, kapara,
proteoliza, lipoliza
Acknowledgements
This work was supported by Turkish Scientific Research Council (TUBITAK) (Project Number: TOVAG 107 O 305) and Ege University Scientific Research Fund (Project Number: 2006-ZRF-042). Author thank Dr. Erdem Tonguç foreign languages for the revisions of the English version of this pa-per.
References
1. Akalin, A.S., Kınık, O., Gonç, S. (1998): Researches on
fatty acid composition of some cheese variaties in İzmir marked. J. Food 10, 357-363. (in Turkish)
2. Anonymous (1980): Milk and Milk Products Guide to Sampling Techniques: IDF Standard, 50 A, Brussels, Bel-gium.
3. Anonymous, TS 591. 2006. White Cheese Standard. Turkish Standards Institute, Ankara. (in Turkish) 4. AOAC Official Method. (2005c): 999.10, Lead,
cad-mium, zinc, copper, and iron in foods.
5. AOAC Official Method. (2005a): 985.35, Minerals in infant formula, enteral products, and pet foods. 6. AOAC Official Method. (2005b): Phosphorus in infant
formula and enteral products, 986.24.
7. Ayar, A., Akyuz, N. (2003): Effect of some spice extracts added on lypolysis of White Cheese during ripening. J. Food 28, 295-303. (in Turkish)
8. Barać, M.B., Smiljanić, M., Pešić, M.B., Stanojević, S.P., Jovanović, S.T., Maćej, O.D. (2013): Primary proteolysis of white brined goat cheese monitored by high molar-ity Tris buffer SDS- PAGE system. Mljekarstvo 63 (3), 122-131
9. Citti, L.E., Sandine, W.E., Elikler, P.R. (1963): Some Observations on the Hull method for measurement of proteolysis in milk. J. Dairy Sci. 46, 337.
10. Collins, Y.F., Mcsweeney, P.L.H.,Wilkinson, M.G. (2003): Lipolysis and free fatty acid catabolism in cheese: A review of current knowledge. Int. Dairy J. 13, 841-866.
11. Corbo, M.R., Albenzio, M., De Angelis, M., Sevi, A., Gobetti, M. (2001): Microbiological and biochemical properties of Canestrato Pugliese hard cheese supple-mented with Bifidobacteria. J. Dairy Sci. 84, 551-561. 12. Demirci, M. (1998): Level and caloric values of our
country’s major mineral varieties of cheese. J. Food 13, 17-21. (in Turkish)
13. Diraman, H., Demirci, M.A. (1998): Study on calcium and phosphorus contents of White Cheese produced in Trakya region. J. Food 23, 217-219. (in Turkish) 14. Dinkci, N., Gonc, S. (2000): Research on using of
li-pase (Piccantase A) from Mucor michei on the ripening of White pickled cheese. J. Agric. Fac. of E.U. 37, 141. (in Turkish)
15. Eren-Vapur, U., Ozcan, T. (2012): Determination of free amino acids in whole-fat Turkish White Brined Cheese produced by animal and microbial milk-clotting enzymes with and without the addition of starter culture. Mljek-arstvo 62 (4), 241-250
16. Gardiner, G.I., Ross, R.P., Collins, J.K., Fitzgerald, G., Stanton, C. (1998): Development of a probiotic cheddar cheese contining human-derived Lactobacillus paracasei strains. Appl. Envir. Microbiol. 64, 2192-2199.
17. Georgala, A., Moshopoulou, E., Aktypis, A., Massouras, T., Zoidou, E., Kandarakis, I., Anifantakis, E. (2005): Evolution of lipolysis during the ripening of traditional Feta cheese. Food Chemistry 93, 73-80.
18. Georgala, A.K., Kandarakis, I.G., Kaminarides, S.E., Anifntakis, E.M. (1999): Volatile free fatty acid content of Feta and white brined cheeses. Aust. J. Dairy Tech. 54, 5-8.
19. Gonc, S., Gahun, Y. (1982): The resulting brine cheese during salting and research on some changes. J. Agric. Fac. of E.U. 19, 99-113. (in Turkish)
20. Gripon, J.C., Desmazeaud, M., Et. Le Baes, D., Bergere, J.H. (1975): Role of organisms and enzymes during mat-uration. Le Lait 55, 502-516.
21. Guinee, T.P. (2004): Salting and the role of salt in cheese. Int. J. Dairy Tech 57, 99- 109.
22. Gursel, A., Gursoy, A., Senel, E., Deveci, O., Karademir, E. (2003): The use of freeze-shocked Lactobacillus hel-veticus and Lactobacillus delbrueckii subsp. bulgaricus in low fat White pickled cheese. SEYES, 22-23 May, (2003) İzmir, Turkey p.57-60. (in Turkish)
23. Gursoy, O., Gokce, R., Gokalp, H.Y. (2000): Proteolysis in fermented dairy products- Proteolysis in cheese. Food Sci. Tech. 5, 34-42.
24. Guven, M., Karaca, O.B. (2001): Proteolysis levels of White Cheeses salted and ripened in brines prepared from various salts. Int. J. Dairy Tech. 54, 29-33.
25. Gursoy, A., Senel, E., Gursel, A., Deveci, O., Karademir, E., Yaman, S.S. (2001). Use of heat-treated cultures of Lactobacillus helveticus and Lactobacillus bulgaricus for the manufacture of reduced fat White pickled cheese. J. Food 26, 303-306.
26. Gursoy, O., Kinik, O. (2010): Incorporation of adjunct cultures of Enterococcus faecium, Lactobacillus paraca-sei subsp. paracaparaca-sei and Bifidobacterium bifidum into White Cheese. J. Food Agric. Envir. 8, 107-112. 27. Halkman, A.K. (2005): Anonymous: Merck Food
Micro-biology Practices, Başak Press Ltd. Şti., Ankara. 28. Hannon, J.A., Wilkinson, M.G., Delahunty, C.M.,
Wal-lace, J., Morrissey, P.A., Beresford, T. (2003): Use of autolytic starter systems to accelerate the ripening of Cheddar cheese. Int. Dairy J. 13, 313-323.
29. Hayaloglu, A.A. (2003): Influence of the Strains of Lac-tococcus used as a starter on the characteristics and rip-ening properties of Turkish White Cheese, PhD Thesis, Dept. Food Engineering, Cukurova University, Adana, Turkey. (in Turkish).
30. Hayaloglu, A.A., Guven, M., Fox, P.F. (2002): Micro-biological, biochemical and technological properties of Turkish White Cheese ‘Beyaz Peynir’. Int. Dairy J. 12, 635-648.
31. Kamber, U. (2008): The traditional cheeses of Turkey: Cheeses Common to all regions. Food Rev. Int. 24, 1-38.
32. Karagozlu, C., Kinik, O., Akbulut, N. (2008): The ef-fects of fully and partial substition of NaCl by KCl on physico-chemical and sensory properties white pickled cheese. Int. J. Food Sci. Nutr. 59, 181 -191.
33. Karaman, A.D. (2007): Effects of homogenisation on low-fat White Cheese production and their properties, PhD Thesis, Ege University, Faculty of Agriculture, De-partment of Dairy Technology, İzmir, Turkey. (in Turk-ish).
34. Katsiari, M.C., Alichanidis, E., Voutsinas, L.P., Roussis, I.G. (2000): Lipolysis in reduced Feta cheese made by partial substitution of NaCl by KCl. Int. Dairy J. 10, 369-373.
35. Kesenkas, H. (2005): The using possibilities of some yeasts as starter culture in the production of White Cheese. PhD Thesis, Ege University, Faculty of
Agricul-ture, Department of Dairy Technology, İzmir, Turkey. (in
Turkish).
36. Kesenkas, H., Akbulut, N. (2008): Yeasts as ripening adjunct cultures in Turkish white brined cheese produc-tion. Turkish J. Vet. Anim. Sci. 32, 327-333.
37. Kilic, S., Karagozlu, C., Uysal, H., Akbulut, N. (2002): An Evaluation on calcium, phosphorus, sodium and po-tassium levels of some White Cheeses in İzmir market. J. Food 27, 229-234.
38. Kinik, O. (1987): Transition temperature and salt con-centration on the impact of salt brine cheese research. Master Thesis, Ege University, Faculty of Agriculture,
Department of Dairy Technology, İzmir, Turkey. (in
Turkish).
39. Mallatou, H., Pappa, E., Massouras, T. (2003): Changes in free fatty acids during ripening of Teleme cheese made with ewes’, goats’, cows’ or mixture of ewes’ and goats’ milk. Int. Dairy J. 13, 211-219.
40. Mendil, D. (2006): Mineral and trace metal levels in some cheese collected from Turkey. Food Chemistry 96, 532-537.
41. Oner, Z., Karahan, A.G., Aloglu, H. (2006): Changes in the microbiological and chemical characteristics of an ar-tisanal Turkish White Cheese during ripening. LWT-Food Sci. Tech. 39, 449-454.
42. Oysun, G. (2001): Analysis Methods in Milk and Dairy Products, Ege University Faculty of Agriculture Press, Bornova, Izmir, Turkey, No. 504. (in Turkish)
43. Ozcan, M., Aydin, C. (2004): Physico-mechanical prop-erties and chemical analysis of raw and brined caperber-ries. Biosystem Engineering 89, 521-524.
44. Ozcan, M., Haciseferogullari, H., Demir, F. (2004): Some physico-mechanic and chemical properties of ca-pers (Capparis ovata Desf. var. canescens (coss.) Hey-wood) flower buds. J. Food Eng. 65, 151-155.
45. Ozcan, S., Senyuva, H.Z. (2006): Improved and simpli-fied liquid chromatography/atmospheric pressure chem-ical ionization mass spectrometry method for the analy-sis of underivatized free amino acids in various foods. J. Chromatography 1135, 179- 185.
46. Ozdemir, S. (1990): Can be kept with sheep’s milk is possibilities of hydrogen peroxide and potassium sor-bate, and the addition of starter cultures to milk, some quality criteria of fresh and ripened White Cheese. PhD Thesis, Atatürk University, Food Science and Technol-ogy, Erzurum, Turkey. (in Turkish).
47. Ozer, B.H., Atasoy, A.F., Akin, M.S. (2002): Some prop-erties of Urfa cheese (a traditional white-brined Turk-ish cheese) made from bovine’s and ovine’s milk. Int. J. Dairy Tech. 55, 94-99.
48. Paquot, C. (1979): IUPAC Standart Metods for Oils, Fats and Derivaties, 6th Edition Part1 section1, Pergam-on Press, Paris, France.
49. Pérez Pulido, R., Ben Omar, N., Abriouel, H., Lucas
López R., Martínez Cañamero, M., Guyot, J.P.,Gálvez,
A. (2007): Characterization of lactobacilli isolated from caper berry fermentations. J. Appl. Microbiol. 102, 583-590.
50. Renner, E. (1993): Practical handouts to the milk, Jes-tus Liebig Universitat, Giesen, Germany, 76 (in Ger-man).
51. Sagun, E., Tarakci, Z., Sancak, H., Durmaz, H. (2005). Change of mineral content in pickled herby cheese dur-ing ripendur-ing. J. YYU Vet. Fac. 16, 21-25. (in Turkish) 52. Sarantinopoulos, P., Kalantzopoulos, G., Tsakalidou, E.
(2002): Effect of Enterococcus faecium on microbio-logical, physicochemical and sensory characteristics of Greek Feta cheese. Int. J. Food Microbiol. 76, 93-105. 53. Sessiz, A., Esgici, R., Kizil, S. (2007):
Moisture-depen-dent physical properties of capper (Cappari ssp.) fruit. J. Food Eng. 79, 1426-1431.
54. Steen, K. (1981): Chemical composition and nutritive value of danish cheese. Asle Maelkeu 94, 52-54. 55. Tarakci, Z., Kucukoner, E. (2008): Comparatives of
ba-sic nutrients, mineral and heavy metal contents of some herby dairy products. Int. J. Food Sci. Tech. 43, 216-219. 56. Temiz, H., Tarakci, Z., Aykut, U., Turhan, S. (2009): The fatty acid levels and physicochemical roperties of herby brined cheese, a traditional Turkish cheese. Int. J. Dairy Tech. 62, 56-62.
57. Tlili, N., Munne-Bosch, S., Nasri, N., Saadaoui, E., Khaldi, A., Triki, S. (2009): Fatty acids, tocopherols and carotenoids from seeds of Tunisian caper “Capparis spi-nosa”. J. Food Lipids 16, 452-464.
58. Trombetta, A., Occhiuto, F., Peri, D., Puglia, C., Santa-gati, N.A., De Pasquale, A., Saija, A., Bonina, F. (2005): Antiallergic and antihitaminic effect of two extracts of Capparis spinosa L. flowering buds. Phytotherapy Res. 19, 29-33.
59. Tzanetakis, N., Vafopoulou-Mastrojiannaki, A., Litopou-lou-Tzanetaki, E. (2005): The quality of white brined cheese from goat milk made with different starters. Food Microbiol. 12, 55-63.
60. Vafopoulou-Mastroyannaki, A. (1977): Retention of Ca, P, and Na in Teleme cheese industrial processes from ewes milk. Milchwissenschaft 32, 475-476.
61. Venema, D.P., Herstel, H., Elenbaas, H.L. (1987): De-termination of the ripening time of Edam and Gouda Cheese by chemical analysis. Neth. Milk Dairy J. 41, 215-216.