Characterization of Nomex honeycomb core
constituent material mechanical properties
Article
in
Composite Structures · November 2014
DOI: 10.1016/j.compstruct.2014.06.033
CITATIONS
8
READS
812
4 authors
, including:
Rene Roy
Gyeongsang National University
11
PUBLICATIONS
64
CITATIONS
SEE PROFILE
Sung-Jun Park
Gyeongsang National University
2
PUBLICATIONS
8
CITATIONS
SEE PROFILE
Jin-Ho Choi
Sungkyunkwan University
305
PUBLICATIONS
4,582
CITATIONS
SEE PROFILE
All content following this page was uploaded by
Rene Roy
on 04 August 2014.
Characterization of Nomex honeycomb core constituent material
mechanical properties
Rene Roy
a, Sung-Jun Park
a, Jin-Hwe Kweon
a,⇑, Jin-Ho Choi
baDepartment of Aerospace and System Engineering, Research Center for Aircraft Parts Technology, Gyeongsang National University, 900 Gajwa-dong, Jinju, Gyeongnam 660-701, Republic of Korea
bSchool of Mechanical Engineering, Research Center for Aircraft Parts Technology, Gyeongsang National University, 900 Gajwa-dong, Jinju, Gyeongnam 660-701, Republic of Korea
a r t i c l e
i n f o
Article history:
Available online 1 July 2014
Keywords:
Nomex honeycomb Nomex paper Phenolic resin Mechanical properties Finite element analysis (FEA)
a b s t r a c t
Nomex honeycomb cores have been widely used in composite sandwich panels. To accomplish meso-scale finite element modeling of these cores, cell wall mechanical properties are required, for which lim-ited data are available. In this work, tensile testing was performed on Nomex paper, phenolic resin, and Nomex paper coated with phenolic resin. Flatwise tension and compression tests were also performed on two types of Nomex honeycomb cores. Test results were calibrated in finite element modeling to account for strain gage local stiffening effects and thickness normalization. Identified cell wall material properties were implemented in a honeycomb core finite element model and further calibrated by matching simu-lation results to manufacturer test data. The cells’ double-wall thickness was also adjusted. These calibra-tions and adjustments led to an exact simulation match with test data. Numerically matching cell wall material properties depends on modeling sophistication and is subject to core test result variability and core construction differences among manufacturers.
Ó2014 Elsevier Ltd. All rights reserved.
1. Introduction
Polymer composite sandwich construction is an attractive design option, as it typically offers an excellent stiffness-to-weight ratio. Honeycomb type cores used in sandwich construction are among the best performers in this regard and have been used extensively. Nomex (E.I. du Pont de Nemours Corp., Wilmington, DE, USA) honeycomb cores can be a valuable choice given their flammability properties, dielectric properties, environmental resis-tance and galvanic compatibility with face materials. Nomex hon-eycomb cores are composed of adhered strips of Nomex paper dipped in phenolic resin. Nomex paper is made from Nomex fibers, a meta-aramid chemical component. Nomex paper strips are typi-cally adhered by bands of thermoset epoxy adhesive. This assem-bly, once expanded to form honeycomb cells, is dipped into phenolic resin and cured to form the final core. These cores are sold in different cell sizes (1.6–19 mm) and core densities (29–144 kg/m3) and can be ordered with a specific core height. Core manufac-turers provide mechanical properties for the core block, namely
compression strength and modulus, and main direction shear strength and modulus. Core tensile strength is often evaluated from a fabricated sandwich with a flatwise tensile test[1]. This test can also serve to evaluate face-to-core bond quality[2]. A designer using a Nomex honeycomb core can therefore consider these mechanical properties in his calculations. Sandwich in-plane com-pression instabilities, namely panel buckling, intra-cell buckling and skin wrinkling, must also be verified and analytical formulas are available to do so [3,4]. For honeycomb core applications involving phenomena such as impact loading[5–7], concentrated loading[8], inserts in the sandwich[9–11], or where the vibration properties of the sandwich are of interest, experimental testing or finite element modeling (FEM) analysis may be desirable. FEM models of honeycomb cores can rely on equivalent 3D solid ele-ments, where a block of solid elements is made to have the same properties as the core (compression, tension, and shear). Honey-comb core failure may happen through cell material fracture or cell wall buckling, depending on the loading regime and the core con-figuration[12,13]. Generally speaking, if the cell wall is thin and long, it may be prone to buckling, whereas if it is thick and short, it may reach its critical failure stress before buckling. In the case of cell wall buckling, this phenomenon cannot be represented directly with an equivalent solid element FEM model. Recently,
http://dx.doi.org/10.1016/j.compstruct.2014.06.033
0263-8223/Ó2014 Elsevier Ltd. All rights reserved. ⇑ Corresponding author. Tel.: +82 10 9535 6104.
E-mail addresses: [email protected] (R. Roy), [email protected] (S.-J. Park),
[email protected](J.-H. Kweon),[email protected](J.-H. Choi).
Contents lists available atScienceDirect
Composite Structures
several researchers proceeded to model the core with its detailed geometry using shell elements (meso-scale modeling) [6,8,13– 17]. In this case, it is also desirable that the material properties used for shell elements are such that the core’s global properties are reproduced (namely the core’s compression, tension and shear moduli). A wide range of material property values have been used in the literature for meso-scale FEM modeling of Nomex honey-comb cores[7,8,13,20]. In the references listed, the Young’s modu-lus (E) used for honeycomb shell elements in the core thickness direction ranged from 1.9 to 3.5 GPa for different core size models (cell size, density). Apart from these material properties, different modeling choices are possible, including basic cell geometry [4,21], geometrical and property variability within the cell (imper-fections) [13,15], or sandwich core/face boundary conditions [14,17]. It can be argued that modeling parameters such as accu-rate cell wall thickness, cell geometry, and incorporation of imper-fections have a non-negligible influence and will therefore dictate the cell wall material property required to match a given core’s global properties. Material test data of the cell wall material, which is essentially Nomex paper coated with phenolic resin, is some-what rare and is not provided by core manufacturers. Tsujii et al. [22]conducted tensile tests on Nomex paper coated with phenolic resin, although the study is published in Japanese. Foo et al.[23] tested the tensile properties of plain Nomex paper and measured tensile moduli of 3.40 GPa (machine direction) and 2.46 GPa (cross direction). Staal[4]chose to perform miniature three point flexural tests on rectangular cell wall sections cut out of a core. He obtained an average flexural modulus of 3.81 GPa (in the core’s thickness direction) but found this approach sensitive to error in the thick-ness measurement of the specimens. In this paper, experimental mechanical tests on Nomex paper, phenolic resin and phenolic resin-coated Nomex paper are reported. Characterizations of Nomex honeycomb core density and geometry are also presented. Flatwise tension and compression tests are also performed on Nomex honeycomb cores installed with strain gages. Where appli-cable, the mechanical property results obtained are calibrated through FEM to account for strain gage local stiffening effects and extra phenolic coating on the specimens tested compared to a typical honeycomb material. These calibrated mechanical prop-erties are then used in a meso-scale shell element FEM model of a core, and the resulting simulated core properties are compared to manufacturer test data and discussed.
2. Test procedure
2.1. Nomex paper tension test
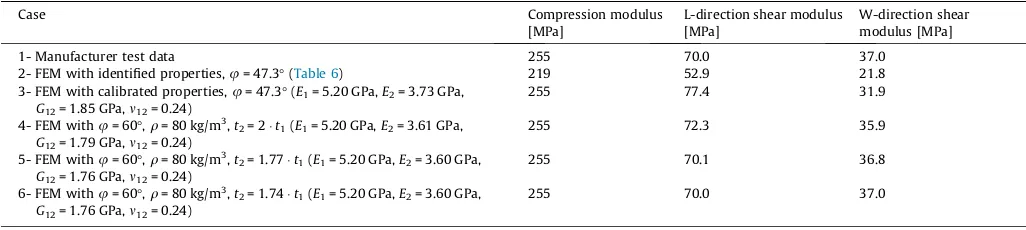
Tensile tests were performed on Nomex type 410 paper with a nominal thickness of 0.05 mm[24]. A universal testing press with a 10kN load cell was used (model LR 10K from Lloyd Instruments Ltd.), as was the case for all load tests in this paperFig. 1a. A constant head displacement rate of 25 mm/min was applied. The overall dimensions of the specimen were 50 mm (width) 350 mm (length). Tabs consisting of epoxy-adhered 2550 mm #100 sandpaper sheets were used, giving an effective gage length of 300 mm. Tests were performed in the paper roll direction (0°), transverse direction (90°), and 45° for five specimens each Fig. 1b. Strain data were derived by dividing the machine head dis-placement by the initial gage length. This approach may be vulner-able to grip slippage and machine compliance affecting the displacement data. However, the force level in the tests remained relatively low (maximum force range 92–187 N), so we assumed that machine compliance is small. Additionally, no grip slippage was apparent during the tests and in the load/displacement result plots.
2.2. Phenolic resin tension test
Tensile tests were performed on resol phenolic resin plates (HirenolÒ
KRD-HM2, Kolon Industries Inc., South Korea). These tests were performed to characterize a constituent material pres-ent in the composition of Nomex honeycomb cores. Phenolic resin was mixed with 25 wt% ethanol, and 2501852 mm dimen-sions plates were fabricated. To prevent excessive foaming, a grad-ual cure cycle was used as follows: 4 h each at 50, 60, 65, 70, 75 and 80°C, 2 h each at 90 and 100°C, 1 h at 120°C, and 1.5 h at 150°C[25]. Shrinkage of approximately 2.5% was observed upon curing. Five tensile specimens were cut according to the ASTM D638-03 standard with an overall length of 200 mm and a narrow section width of 13 mm[26]. Both specimen main surfaces were polished up to 3
l
m grit; the average final specimen thicknesswas 1.76 mm. Glass/epoxy laminates were used as tabs, measuring 42191.6 mm. Specimens were installed with a 2-element 90° cross rosette strain gage (model UFCA-3-17-3L, Tokyo Sokki Kenkyujo Co. Ltd., Tokyo, Japan) at mid-length after sanding the
surface with #1000 sandpaper. A constant head displacement rate of 5 mm/min was applied in the tests (Fig. 2). Strain gage signals were recorded at 10 Hz through a NEC AS1203 strain amplifier (NEC Corporation, Tokyo, Japan) and a National Instrument USB-6251 data acquisition module (National Instruments Corporation, Austin, USA), as was the case with all strain gages used in this paper. During the tensile tests, the specimens failed at the grips; therefore, the measured strength was not considered. The cured resin was brittle and it could crack while cutting specimens too quickly. Nonetheless, a sufficiently high load was reached in the tests to measure significant modulus and Poisson’s ratio values (maximum strains higher than 0.4%).
2.3. Nomex/phenolic tension test
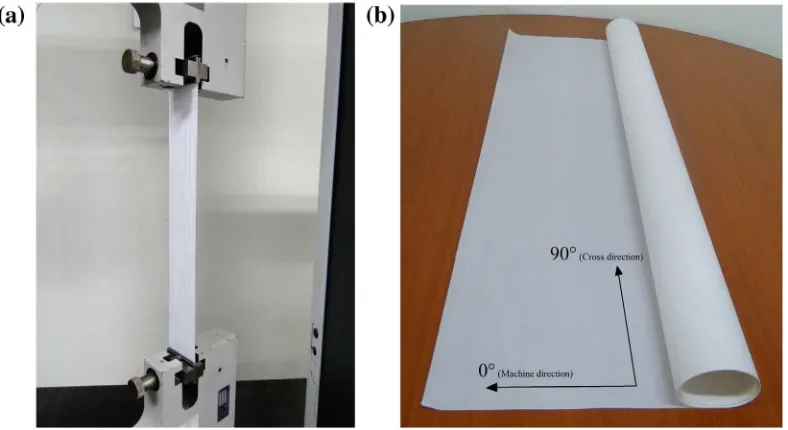
Specimens made of Nomex paper dipped into phenolic resin were fabricated. Specimens were fabricated with the paper in the roll direction (0°), transverse direction (90°), and 45°. Nomex paper specimen sections initially measured 50 mm (width)350 mm (length)0.05 mm (thickness). Paper sections were secured straight in a metal holder (Fig. 3a). This holder was then dipped in a bath of phenolic resin (same resin as in Section2.2) mixed with 25 wt% ethanol for 5 min (Fig. 3b). After removal from the bath, the holder was left to drip above the bath for 5 min. The specimens were then cured in an oven while still in the holder. The cure cycle
was as follows: 2 h at room temperature, 1 h each at 70, 100 and 120°C, and finally 1.5 h at 150°C[25]. Initially, seven specimens were installed at once in the holder, but later only three specimens were installed to prevent accidental contact between the dipped paper sections. We therefore advise in this case to use a minimum gap of approximately 8 mm between paper sections. After removal from the holder, the lower 10 mm and longitudinal extremities of the specimens were cut-out, giving a final specimen area of 40 mm (width)290 mm (length). Tabs consisting of 2540 mm #100 sandpaper sections adhered with epoxy were used, giv-ing an effective gage length of 240 mm. From random measure-ments, we observed that the specimen thickness varied by approximately 0.02 mm from top to bottom widthwise. This may be due to a gravity effect during the dipping process. Specimens were installed with a 2-element 90°cross rosette strain gage at mid-length (model FCA-3-11-1L, Tokyo Sokki Kenkyujo Co. Ltd., Tokyo, Japan). Three specimens for each paper direction were tested with a constant head displacement rate of 1 mm/min (see Fig. 4).
2.4. Nomex honeycomb core test
Flat sandwich panel specimens with Nomex honeycomb cores were prepared to perform flatwise tension and compression tests. In the tests, strain gages were installed on the honeycomb walls. These tests served to provide additional core material stress/strain behavior data and also allowed for the investigation of possible dif-ferences in the material’s tensile and compressive moduli. With aramid fibers for example, there is evidence that contrary to strain stiffening in tension, strain softening can occur in compression [27]. The sandwich panels tested had faces consisting of glass/ epoxy 3/1 weave prepreg fabric laminates (GEP 224, SK Chemicals, South Korea). These laminates were first vacuum bag-cured alone in an autoclave at 3.0 atm with a stacking sequence of [0/90]2S and total thickness of 1.0 mm. Two Nomex honeycomb cores were evaluated: both with a 4.8 mm cell size and 25.4 mm height and with densities of 32 and 64 kg/m3 (models HD322 and HD342, M.C. Gill Corporation, El Monte, USA). These cores were provided by Korea Aerospace Industries Ltd. The faces were lightly sanded (#1000 grit sandpaper) and adhered to the cores with an epoxy adhesive film (Hysol EA9696.030, Henkel Corporation, Düsseldorf, Germany) in vacuum bag autoclave molding with a maximum pressure of 2.0 atm. The bag vacuum was released when the auto-clave pressure climbed past 1.0 atm. The faces were adhered to the core one at a time so that the effect of gravity on the adhesive line would be the same on both sides. The specimen’s nominal area Fig. 2.Phenolic resin tension test specimens and tension test set-up.
Fig. 3.(a) Nomex paper sections in holder; (b) Nomex paper sections in phenolic resin bath.
dimensions were 5050 mm with a total height of 27.4 mm. To first perform a flatwise tensile test, specimens were adhered to steel blocks with a liquid epoxy adhesive cured at room tempera-ture. Two small strain gages were then installed on the specimens (model UFLK-1-17-3L, Tokyo Sokki Kenkyujo Co. Ltd., Tokyo, Japan), one on each side parallel to the L-direction, on a honey-comb double-wall section (Fig. 5). Flatwise tensile tests were per-formed at a machine head displacement rate of 0.2 mm/min and
stopped before failure when the recorded gage strain reached approximately 0.3%. Specimens were then removed from the flat-wise tensile test jigs, keeping the adhered steel block in place. Flat-wise compression tests were then performed on these specimens until failure with the same machine head displacement rate of 0.2 mm/min[28]. Three specimens of each core type were tested.
2.5. Density measurement
The density of the specimens tested was measured by taking their weight in air and in water with an electronic density meter (VIBRA DME, Shinko Denshi Co., Jakarta, Indonesia) (seeFig. 6). This density meter model automatically calculates the density from these two weight measurements. The density of the Nomex/phenolic specimen was measured after the tensile test from an un-cracked area section of 4050 mm cut from each specimen. The average thickness (t) of this section was then calcu-lated with the following formula:t = m/(
q
A), wheremis the spec-imen’s dry mass,q
its measured density, andAits surface area. The average constituent material density (q
mat) of five different Nomexhoneycomb cores was also measured. This measurement was done by submerging a honeycomb core section in the density meter. Core specimens with an area measuring approximately 66 cm were used. When the core specimen was submerged in the density meter, it was slightly shaken to dislodge any air bubbles from it.
3. Test results and discussion
3.1. Nomex paper
Fig. 7presents representative stress/strain curves from Nomex paper tensile tests. To calculate the stress, the recorded load was divided by the specimen’s section, considering an actual thickness of 0.056 mm, based on measurement data from the manufacturer [24]. Strain was calculated by taking the machine displacement divided by the specimen’s initial gage length of 300 mm. The plas-tic-like behavior observed in the curves is similar to what Foo et al. previously reported[23]. Likewise, wrinkling of the paper began at Fig. 4.Nomex/phenolic tensile test set-up.
approximately the mid-level force amplitude. Every specimen we tested failed in its middle length portion, away from the tabs. The tensile modulus was calculated from a linear regression in the 0.2–0.4% strain interval. Table 1 presents the average test results for the different paper directions. Compared to Foo et al. [23], the obtained average moduli test results differ by 7–23% and reveal a higher orthotropic ratio (1.62vs1.38 for Foo et al.) (Table 2). While it is premature to make a conclusion because of limited data, these differences could possibly be caused by the dif-ferent paper thickness tested (0.05 mmvs0.13 mm for Foo et al.). In terms of strength, both results are comparable to published data from the manufacturer[24]. The listed strength values of Foo et al. were determined by estimating the maximum forces on the test curves in their published work.
3.2. Phenolic resin
The phenolic resin tensile test results displayed a linear elastic stress/strain behavior, as expected. The tensile modulus and Pois-son’s ratio were calculated from a linear regression of the stress/ strain and
e
y/e
xslope, respectively, in the 0.1–0.3% strain range.The average tensile modulus was 4.94 GPa (Sn1= 0.20 GPa,
C.V. = 4.05%), and the average Poisson’s ratio was 0.389 (Sn1= 0.005, C.V. = 1.35%), measured from five specimens. The modulus obtained is higher than a stated guideline value of 3.9 GPa[29]but slightly lower than the measured result of Redjel [30](5.16 GPa). Giglio et al.[14]recently used a modulus value of 3 GPa in their numerical model. The Poisson ratio result of
m
= 0.389 compares to a measured result of 0.36 from Redjel[30]. By isotropic material theory, a shear modulus of 1.78 GPa was cal-culated from the current results {G=E/(1 + 2m
)}. The average cured resin density, measured from three specimens of approximately 13401.76 mm dimensions, wasq
phenol= 1.342 g/cc.3.3. Nomex/phenolic
Representative stress/strain curves from the Nomex/phenolic tension tests are presented inFig. 8. Linear elastic behavior was observed until failure. Compared to plain Nomex paper (Fig. 7), the addition of a phenolic resin coating eliminated plastic deforma-tion and greatly reduced maximum strain. This behavior was also Fig. 6.Electronic density meter.
Fig. 7.Nomex T410 paper representative stress/strain curves.
Table 1
Nomex T410 paper tension test average results.
Paper direction E[GPa] ru[MPa] eu[%]
0° Mean 3.18 64.2 7.27
Sn1 0.088 2.6 0.75
C.V. 2.85% 4.04% 10.3%
45° Mean 2.36 42.6 6.50
Sn1 0.10 0.53 0.57
C.V. 4.24% 1.23% 8.71%
90° Mean 1.96 33.6 6.69
Sn1 0.069 0.61 0.85
C.V. 3.52% 1.82% 12.8%
Table 2
Nomex paper tensile property comparison.
Paper nominal thickness
Source E0
[GPa]
E90
[GPa] r0
[MPa] r90
[MPa]
0.05 mm Current
results
3.18 1.96 64.2 33.6
Dupont[23] – – 69.8 32.2
0.13 mm Foo et al.
[22]
3.40 2.46 108.5 54.2
Dupont[23] – – 103.7 50.0
observed by Hähnel [31], who reported semi-qualitative stress/ strain slopes of Nomex paper impregnated with phenolic resin. When Hähnel used only a single resin impregnation, the material retained some plastic behavior, but with two resin impregnations, the material exhibited completely linear elastic behavior. Consid-ering this result, we assumed that our single resin impregnation was relatively thick in comparison. For the 0° Nomex/phenolic specimens, the average failure strength of these specimens (42.9 MPa) corresponds to a force of 204.5 N. Let us assume that, in this test, the phenolic coating is the first to fail. This assumption is based on the Nomex/phenolic specimen’s relatively low failure strain compared to plain Nomex paper (0.83%vs 7.27%). Failure of the coating would then transfer a total stress of 89.6 MPa {204.5 N/(40.750.056) mm2} to the paper alone, higher than its previously measured average strength of 64.2 MPa. In this sce-nario, the phenolic coating and the paper would fail virtually simultaneously. This scenario also assumes a simplified represen-tation where there is no phenolic resin impregnation in the paper. The tensile modulus and Poisson’s ratio were calculated from a lin-ear regression of the stress/strain and
e
y/e
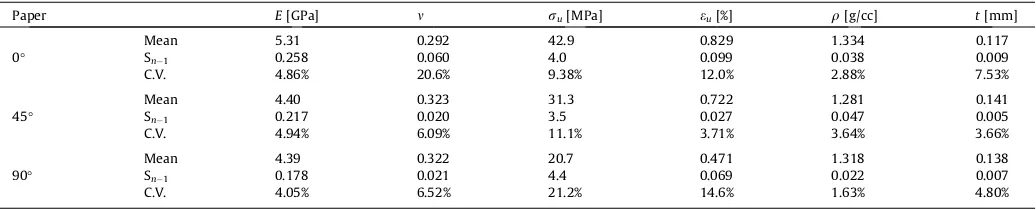
xslopes, respectively, inthe 0.2–0.4% strain range. From the density measurement, calcu-lated average individual specimen thicknesses were in the range of 0.109–0.145 mm. These thicknesses were in agreement with random individual caliper measurements on the specimens. Aver-age test results for the different paper directions are presented in Table 3. The moduli and Poisson’s ratios here listed are raw test data. Later in this text, the local effect of the strain gage will be modeled in FEM analysis. Varying specimen thickness will also be normalized in the model. The test data will therefore be cor-rected to obtain typical Nomex honeycomb core constituent mate-rial properties.
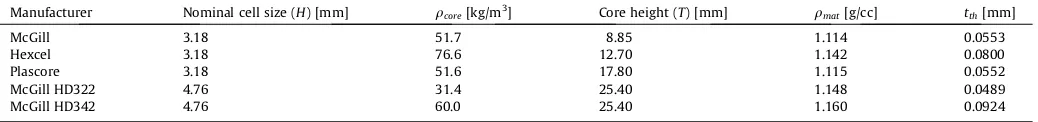
3.4. Nomex honeycomb core constituent material density
The measured constituent material densities (
q
mat) of fiveNomex honeycomb cores are listed inTable 4. Despite the differ-ent core densities and manufacturers evaluated, constitudiffer-ent material densities are fairly close, within a range of 1.11–1.16 g/cc. Using the core and material densities, the cell size (H), and a theoretical perfect hexagon cell geometry, a theoretical honey-comb constant single-wall thickness (tth) can be calculated (Eq.
(1)). This is an idealized representation because resin accumula-tion in cell corners is not considered. From these calculaaccumula-tions, a slight trend is apparent: the higher the wall thickness, the higher the material density. Only the ‘McGill HD322’ specimen departs from this trend. This trend is consistent with the fact that the density of Nomex paper increases with thickness: for example, for t =0.056 mm, the density is
q
=0.72 g/cc, and for t =0.079 mm, the density isq
=0.80 g/cc[24]. Furthermore, this trend is consistent if the increase in wall thickness comes from extra phenolic resin coating because its density is greater than Nomex paper (q
phenol= 1.342 g/cc).tth¼ 6 16H
q
core103
q
matð1Þ
3.5. Nomex honeycomb core flatwise test
Fig. 9shows the global core stress/strain behavior in the flat-wise tension and compression tests. Core stress was taken as the applied load divided by the core area (A= 5050 mm), and core strain was taken as the machine displacement divided by the core Fig. 8.Nomex/phenolic specimen representative stress/strain curves.
Table 3
Nomex/phenolic tension test raw results.
Paper E[GPa] m ru[MPa] eu[%] q[g/cc] t[mm]
Mean 5.31 0.292 42.9 0.829 1.334 0.117
0° Sn1 0.258 0.060 4.0 0.099 0.038 0.009
C.V. 4.86% 20.6% 9.38% 12.0% 2.88% 7.53%
Mean 4.40 0.323 31.3 0.722 1.281 0.141
45° Sn1 0.217 0.020 3.5 0.027 0.047 0.005
C.V. 4.94% 6.09% 11.1% 3.71% 3.64% 3.66%
Mean 4.39 0.322 20.7 0.471 1.318 0.138
90° Sn1 0.178 0.021 4.4 0.069 0.022 0.007
height (T= 25 mm). In compression, the 32 kg/m3core yielded at approximately 85% (0.6 MPa) of its maximum strength, while the 64 kg/m3core had a more brittle behavior, with no significant yield before failure. Combined stress/strain curves derived from the strain gage signals are presented inFig. 10. Honeycomb wall stress was considered in this case and was calculated by taking the applied load divided by an idealized honeycomb wall section area[20]. Conversion from core stress to wall stress was calculated as in Eq.(2), withl =2.75 mm the cell wall length,
u
= 60°the hex-agonal cell angle, and wall thicknesses of tð32 kg=m3Þ= 0.0489 mm andtð64 kg=m3Þ= 0.0924 mm (fromTable 4).r
wallr
core¼lð1þcos
u
Þsinu
2t¼ f36:54ð32 kg=m3Þ;19:33ð64 kg=m3Þg ð2Þ
On the tensile side of the strain gage signals, linear elastic behavior was strictly observed for the 32 kg/m3 core, while the 64 kg/m3core had one or two strain gages showing some nonlinear drift. We attribute this behavior to experimental imprecision, namely load misalignment and strain gage location imprecision on the honeycomb wall. In compression, at low stress, behavior is generally linear, while some strain gages showed pronounced Table 4
Measured material density of Nomex honeycomb cores.
Manufacturer Nominal cell size (H) [mm] qcore[kg/m3] Core height (T) [mm] qmat[g/cc] tth[mm]
McGill 3.18 51.7 8.85 1.114 0.0553
Hexcel 3.18 76.6 12.70 1.142 0.0800
Plascore 3.18 51.6 17.80 1.115 0.0552
McGill HD322 4.76 31.4 25.40 1.148 0.0489
McGill HD342 4.76 60.0 25.40 1.160 0.0924
nonlinear drift with increasing stress. Again, we attribute this drift to experimental imprecisions. We found that our flatwise compres-sion test was sensitive to specimen alignment (placing the speci-men center in-line with the load). Keeping the steel blocks in the test, and hence adding height, might have amplified this sensitiv-ity. For the 32 kg/m3 core, even the strain gage signals that remained fairly linear with increasing stress diverged at approxi-mately 85% of the maximum compressive stress (around 0.6 MPa). This behavior is consistent with the yielding observed in the global core stress/strain curves. The 64 kg/m3core’s strain gage signals remained fairly linear until failure; this behavior is again consistent with the global core brittle behavior observed. A linear regression of the stress/strain slope in the 0.1–0.2% strain range (tension) and {0.1%,0.2%} strain range (compression) was calculated from the strain gage signals. We define this quan-tity as the cell wall elastic modulus, and individual results are pre-sented in Table 5. The 32 kg/m3 core had similar tension/ compression average moduli (Etens= 5.29 GPa, Ecomp= 5.30 GPa),
while the 64 kg/m3 core was 7.22% softer in compression (Etens= 5.26 GPa, Ecomp= 4.88 GPa). In both cases, the variability
on the moduli was relatively high (C.V.10%), and few specimens were tested (3 each). We therefore will not make any definite con-clusions from the differences in tension and compression moduli.
As for the Nomex/phenolic test results, the flatwise tests will be modeled in FEM and the results compensated for the strain gage local stiffening effect. Because of the Nomex honeycomb core’s expansion fabrication process[32], it is most likely that the Nomex paper’s 90°direction will be aligned with the core’s through-thick-ness direction. This direction was the main direction of the load Fig. 10.Flatwise tension and compression strain gage data: (a) 32 kg/m3core; (b) 64 kg/m3core.
and strain measurement in these core flatwise tests. It will thus be possible to compare identified 90°direction properties from the Nomex/phenolic specimens and the core flatwise tests.
4. Modeling
4.1. Nomex/phenolic tension test model
A finite element model of the Nomex/phenolic tension tests was built in order to compensate for the local stiffening effect expected in the strain gage area. To achieve this, the strain gage material was included in the model. Based on the properties of epoxy films[33], the following parameters were used to model the strain gage: E= 2.5 GPa,
m
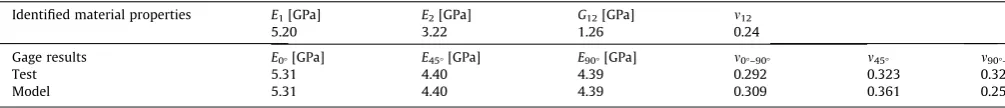
= 0.36, and a 0.03 mm thickness. For every tensile test group (i.e., 0°, 45°, and 90°), a model was built that considers each group’s particular average thickness (fromTable 3) to deter-mine the extra phenolic coating thickness in the model (Fig. 12). The models therefore also served to normalize the phenolic coating thickness of the different specimen groups. From microscope observation of the Hexcel 80 kg/m3core, we determined the aver-age total wall thicknesses to be approximately 0.08 mm, of which approximately 0.055 mm is the Nomex paper only. The properties of the 0.08 mm thick center portion (material to identify) were var-ied by trial and error in order to match the model’s effectiveprop-erties at the strain gage to the test results. We note that this 0.08 mm thick material includes any resin impregnation in the Nomex paper. The test moduli could be matched by adjusting almost independently one material property in the model:E1for
E0°,E2forE90°, andG12forE45°. The simulated effective gage
Pois-son’s ratios could not be matched exactly to all experimental results simultaneously. The model’s Poisson’s ratio was therefore chosen based on a least mean square calculation of the model’s deviation from the Poisson’s ratio of the three test results (0°, 45°, and 90°). Identified Nomex core constituent material proper-ties are listed in Table 6. The E2 modulus that was identified (3.22 GPa) is lower than the one obtained by Staal[4](3.81 GPa) and the 3.5 GPa value used by Asprone et al. [13]and Roy et al. [19] in their models. The shear modulus that was obtained (1.26 GPa) is also lower than what was previously identified in Roy et al. (1.68 GPa) [19]. These moduli differences will be dis-cussed further in Section 4.3. The in-plane Poisson’s ratio that was identified (0.24) differs from the value of 0.4 frequently used in Nomex core FEM model simulations[6–8,18]. However, the in-plane Poisson’s ratio is closer to the value of 0.2 previously identi-fied by Roy et al.[19]. In the absence of any stated rationale, the Poisson‘s ratio value of 0.4 previously cited appears taken from phenolic resin property, or from earlier work (e.g., [12]). Given the Poisson’s ratio of the phenolic resin we used (0.389), the cur-rent Nomex/phenolic results (
m
= 0.24) would imply that the Nomex paper itself has a relatively lower Poisson’s ratio value. For verification, let’s assume the previously described 0.08 mm thick Nomex/phenolic material as layered. This material would have a 0.055 mm thick Nomex paper core with 0.0125 mm thick phenolic resin coatings and no resin impregnation in the Nomex paper. From classical laminate theory calculations[34], we found that a Nomex paper Poisson’s ratio value of 0.193 is required to obtain a Nomex/phenolic Poisson’s ratio of 0.24. Under these assumptions, this 0.193 value is comparable or at the low range of reported Poisson’s ratio values for wood-based paper materials [35,36].4.2. Core flatwise test model
The core flatwise tests were modeled in FEM to calibrate the strain gage measurement results. A meso-scale model was built with shell elements representing the honeycomb cell geometry (seeFig. 13). This type of model can consider several aspects of an actual core’s variable nature, such as cell wall thickness variabil-ity [13,37,38], cell wall curvature (in-plane, out-of-plane) [4,20,21,39], material property variability within a cell wall [13,40], resin accumulation at the cell corners[14], and other ran-Table 5
Core cell wall strain gage raw elastic modulus results.
Specimen Tension [GPa] {S.G. 1, S.G. 2} Compression [GPa] {S.G. 1, S.G. 2} Specimen Tension [GPa] {S.G. 1, S.G. 2} Compression [GPa] {S.G. 1, S.G. 2}
32 kg/m3– 1 {5.17, 4.86} {4.75, 4.88} 64 kg/m3– 1 {5.52, 6.56} {4.91, 4.57}
32 kg/m3– 2 {5.64, 5.78} {5.28, 6.37} 64 kg/m3– 2 {6.56, 4.99} {6.11, 5.37}
32 kg/m3– 3 {4.86, 6.01} {5.73, 5.35} 64 kg/m3– 3 {5.16, 4.83} {5.56, 4.70}
Mean 5.39 5.39 Mean 5.60 5.20
Sn1 0.49 0.60 Sn1 0.78 0.59
C.V. 9.14% 11.0% C.V. 13.9% 11.3%
Fig. 12.Representation of the Nomex/phenolic tension test FEA model.
Table 6
Nomex/phenolic calibrated elastic properties and test-simulation comparison.
Identified material properties E1[GPa] E2[GPa] G12[GPa] m12
5.20 3.22 1.26 0.24
Gage results E0°[GPa] E45°[GPa] E90°[GPa] m0°–90° m45° m90°–0°
Test 5.31 4.40 4.39 0.292 0.323 0.322
Model 5.31 4.40 4.39 0.309 0.361 0.259
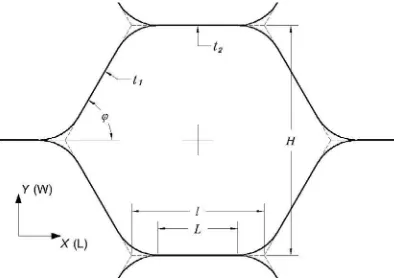
dom geometrical imperfections[15]. These characteristics can vary depending on the core manufacturer. To begin with a relatively simplified representation, we considered a constant cell wall thick-ness and some in-plane wall curvature at the cell corners (fillets), similar to Staal[4]. Staal showed that using rounded cell corners can have a significant effect on the model’s in-plane face wrinkling buckling load. From microscope observations of the cores, a cell fil-let ratio (
w
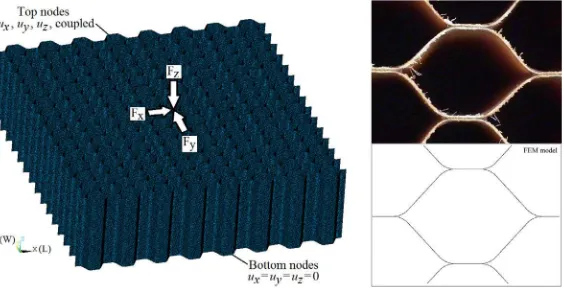
) of 0.2 was implemented in the model geometry, defined asw
=(lL)/2l, with lthe idealized hexagonal cell wall length andLthe actual straight portion of the cell wall (Fig. 11). Linear 4-node shell elements were used, with a mesh division of 9 elements (in-plane wise) by 106 elements (height wise) for each cell wall segment. This mesh resulted in an element size of approx-imately 0.20.24 mm, which was considered appropriate based on published mesh convergence analysis of similar models[15]. The core’s bottom node displacements (ui) were locked in theX,Y, andZdirections. The core’s top node displacements were cou-pled in theX,Y, and Zdirections. With this we considered that the in-plane stiffness of the core was negligible compared to the faces. This coupling permitted a single vertical force to be applied on a node at the geometrical center at the top of the core. The par-ticular strain gage used was also modeled assuming polyimide film properties (E= 5.32 GPa,
m
= 0.35, from [41]) and a thickness of 0.05 mm. For both cores tested (32 and 64 kg/m3), the thicknesses of single-wall elements closest to cell corners (t3) and second clos-est to cell corners (t4) were adjusted to obtain the exact core den-sity desired in the model. This adjustment is also designed to represent resin accumulation present in that area. The cell wall thicknesses were t1= 0.0489 mm, t2= 2t1, t3=t2, andt4= 0.05632 mm for the 32 kg/m3 core, and t1= 0.0924 mm,
t2= 2t1, t3=t2, and t4= 0.12395 mm for the 64 kg/m3 core. The Nomex/phenolic properties obtained in Section4.1were used as a starting point for the core cell wall material properties. The strain result of the strain gage elements was then averaged and com-pared to experimental results. To obtain an exact match to the strain gage experimental results, moduli were all scaled by a con-stant. For the 32 kg/m3core, a proportion of 1.293 applied to the moduli (E1= 6.73 GPa, E2= 4.16 GPa, G12= 1.63 GPa) replicated the exact modulus measured at the gage; for the 64 kg/m3 core, this proportion was 1.482 (E1= 7.71 GPa, E2= 4.77 GPa,
G12= 1.87 GPa). Compared to the 90°direction modulus identified in Section 4.1 (E2= 3.22 GPa), the moduli identified with this approach are 29.2% (32 kg/m3 core) and 48.1% (64 kg/m3 core) higher. Our best hypothesis for this difference is that the cell wall material of the cores tested simply has greater stiffness than the specimens we fabricated. Nomex paper can be tailored and opti-mized for a given application. This tailoring can involve adjusting the proportion of fibers, pulp, and binder in the paper, as well as the percentage of voids. Such tailoring has been shown to have a
significant effect for honeycomb cores [42]. Moreover, Nomex paper type 412 is typically used in honeycomb cores[13,15,25]. We used general usage Nomex paper type 410 to prepare our spec-imens, like other authors[43,44], because this type was more eas-ily available to us. This different paper grade and the fact that we applied one thick phenolic coating at once in our specimens (e.g., [45]) may be the reason that our specimens are softer than the core cell wall material. It is also worth noting that the McGill cores tested are among the stiffest comparable Nomex honeycomb cores commercially available[32,46].
4.3. Representative Nomex core model
The material properties identified in Section4.1were also eval-uated for a core with a cell wall thickness comparable to the one used in the identification process (0.08 mm). The Hexcel 80 kg/ m3density, 3.18 mm cell size core was chosen as a basis because we previously determined that its cell has the same nominal cell wall thickness of 0.08 mm. A meso-scale shell FEM model of the core was built in the same fashion as described in the previous sec-tion. A cell filet ratio (
w
) of 0.17 was implemented based on micro-scope observations. The cell hexagon angle was also measured and found to beu
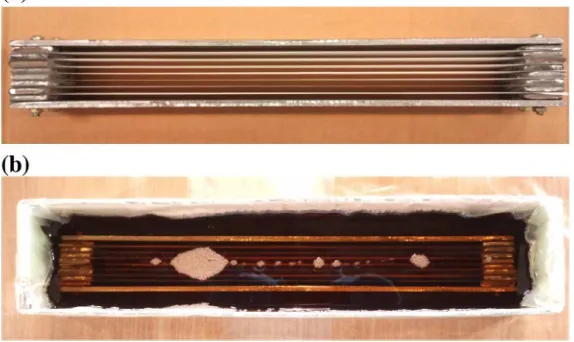
= 47.3°with an actual cell size (H) of 3.38 mm. The thicknesses of the single-wall elements closest to cell corners were again adjusted in order to match the measured core density (76.6 kg/m3from Table 4). This model served to compare simu-lated core moduli with test data published by the manufacturer. The model’s simulated core moduli were determined by applying a single force (Fi) on a top node at the geometric center andmea-suring the corresponding core deformation. For compression, the model had a square area of 5050 mm, typical of a flatwise test. In the case of shear, it is recommended that the specimen length be 10–12 times that of its thickness[47,48]. Therefore in shear loading, the model had a rectangular area of 50138 mm. The simulated core moduli are presented inTable 7, case 2, and they are all lower than the manufacturer’s test data. As stated before, our best hypothesis for this difference is that the specimens we prepared may have a lower stiffness than commercial honeycomb materials. The material moduli in the model were subsequently scaled to get closer to the manufacturer’s core moduli data. The E2 modulus was scaled to exactly match the core’s compression modulus. Scaling theE1modulus had little influence on the differ-ent simulated core moduli, so it was left unchanged. TheG12 mod-ulus was scaled to approach the core’s shear moduli, as it was not possible to simultaneously obtain a perfect match to both core main direction shear modulus. An optimalG12value was therefore determined from a least mean square calculation of the percentage deviation from the manufacturer’s data. A much higher shear mod-ulus was required (G12= 1.85 GPa), and we observed that,
pared to the manufacturer’s test data, the model is relatively stiffer in the L-direction than in the W-direction (Table 7, case 3). We ver-ified that the rectangular area size chosen showed convergence within below 1% on theG12value identified, compared to a slightly smaller size model. It was also verified that shear loading on the square model would generate a 6% increase difference in theG12 value identified. Based on the diverging directional core shear stiff-ness obtained, we reasoned that it is more likely that the manufac-turer data comes from a core with nominal dimensions, that is:
u
= 60°, H= 3.18 mm,q
core= 80 kg/m3, andw
= 0.2 (from [4]). Therefore, another model was built with these parameters. With an increased cell hexagon angle (u
= 60°), we could expect a cor-rection in theGL/GWratio according to analytical models[49]. Thiswas the case as shown inTable 7, case 4, where the shear moduli are now within 3.3% of the test data. CalibratedE2andG12values are also slightly lower with this model, most likely in great part due to the increased core density modeled. Another possible con-sideration in the model is the double-wall (t2) thickness allocation. In reality, this double-wall may not have exactly double the thick-ness of a single-wall (t1). The double-wall should have twice the Nomex paper thickness as a single-wall, but sensibly the same phe-nolic coating thickness. Microscope observations of core cells con-firms this reasoning, and on average we measured a thickness of t2= 1.77t1. This cell wall thickness proportion was incorporated into the nominal dimensions model (
u
= 60°), which was also adjusted to obtain a 80 kg/m3 core density (t1= 0.08 mm,
t2= 0.14175 mm, t3=t2, t4= 0.11368 mm). The simulated shear moduli ratio obtained with this configuration were then within 0.6% of the target value (Table 7, case 5). For the sake of obtaining a perfect match, a thickness proportion oft2= 1.74t1was used (t1= 0.08 mm,t2= 0.0001392 mm,t3=t2,t4= 0.0001206 mm). This configuration gave simulated core moduli that exactly matched the manufacturer’s test data, along with corresponding calibrated cell wall material elastic properties (Table 7, case 6). This result dem-onstrated possible approaches to model calibration and also the extent of their effect, specifically in terms of shear moduli ratio. Using slightly different material properties for the double-wall may also be another way to calibrate the model, ideally with some analytical rationale or test data to back it. The obtained calibrated cell wall material elastic properties are comparable to some used in recent published work on meso-scale FEM modeling of Nomex honeycomb cores: E2= 3.60 GPa (3.50 GPa in [13], 3.52 GPa in [19]),G12= 1.76 GPa (1.68 GPa in[19]), and
m12
= 0.24 (0.2 in[19]).5. Conclusions
In this work, tensile tests were first performed on Nomex paper, phenolic resin, and Nomex paper coated with phenolic resin. Nomex paper test results were comparable to previously published test data. These results also confirmed that paper properties are dependent on the paper’s nominal thickness, at least in terms of
strength. Measured phenolic resin elastic properties were in the range of published results. Phenolic resin coated Nomex paper dis-played a strictly linear elastic behavior; we attribute this behavior to the relatively thick resin coating that was used. These Nomex/ phenolic test results were calibrated in finite element modeling (FEM) to account for strain gage local stiffening effects and for specimen thickness normalization. The identified Nomex/phenolic elastic properties wereE1= 5.20 GPa,E2= 3.22 GPa,G12= 1.26 GPa, and
m12
= 0.24. Flatwise tension and compression tests were also performed on Nomex honeycomb cores with strain gages installed. Finite element models of these tests were also built andE2material values of 4.16 or 4.77 GPa were determined from the models. We attribute these relatively stiffer values to a more optimized mate-rial formulation in the commercial Nomex cores compared to our fabricated Nomex/phenolic test specimens. The identified Nomex/phenolic material property set was then used in a finite element model of a core. Simulated core moduli were compared to manufacturer’s test data. Scaling of the material moduliE2andG12 was required to approach the test data. It was also observed that the honeycomb cell’s double-walls do not exactly have double the thickness of its single-walls. This observation was also imple-mented in the model, and it was possible to achieve a perfect match between core simulations and test results. The calibrated cell wall material elastic properties in this matching model were E1= 5.20 GPa,E2= 3.60 GPa,G12= 1.76 GPa, and
m12
= 0.24. We con-sider that some level of model calibration should be expected with meso-scale Nomex honeycomb core modeling. The need for cali-bration may come from the level of modeling sophistication used (imperfections, cell corners), core construction differences among manufacturers, or core test results variability.Acknowledgments
This work was supported by the Priority Research Centers Pro-gram through the National Research Foundation of Korea (NRF) funded by the Ministry of Education, Science and Technology (2009-0094104). This research was financially supported by the Ministry Of Trade, Industry & Energy (MOTIE), Korea Institute for Advancement of Technology (KIAT) and Dong-Nam Institute For Regional Program Evaluation (IRPE) through the Leading Industry Development for Economic Region. Part of this work was presented at the 17th International Conference on Composite Structures (ICCS-17), 17-21 June 2013, in Porto, Portugal.
References
[1] ASTM Standard C297. In: Standard test method for flatwise tensile strength of sandwich constructions. West Conshohocken, PA: ASTM International; 2004. [2] Khan S, Loken HY. Bonding of sandwich structures – the facesheet/honeycomb
interface – a phenomenological study. In: Proceedings of SAMPE 2007. Baltimore; 3–5 June 2007. p. 1–9.
[3] HexWeb™ Honeycomb Sandwich Design Technology. Hexcel composites. Duxford, UK; 2000.
Table 7
Hexcel 3.18 mm – 80 kg/m3honeycomb core test and simulation properties.
Case Compression modulus
1- Manufacturer test data 255 70.0 37.0
2- FEM with identified properties,u= 47.3°(Table 6) 219 52.9 21.8
[4] Staal RA. Failure of sandwich honeycomb panels in bending [Ph.D. thesis], New Zealand: University of Auckland; 2006.
[5]Menna C, Zinno A, Asprone D, Prota A. Numerical assessment of the impact behavior of honeycomb sandwich structures. Compos Struct 2013;106:326–39.
[6]Manes A, Gilioli A, Sbarufatti C, Giglio M. Experimental and numerical investigations of low velocity impact on sandwich panels. Compos Struct 2013;99:8–18.
[7]Foo CC, Chai GB, Seah LK. A model to predict low-velocity impact response and damage in sandwich composites. Compos Sci Technol 2008;68:1348–56. [8]Giglio M, Gilioli A, Manes A. Numerical investigation of a three point bending
test on sandwich panels with aluminum skins and Nomex™ honeycomb core. Comput Mater Sci 2012;56:69–78.
[9]Song KI, Choi JY, Kweon JH, Choi JH, Kim KS. An experimental study of the insert joint strength of composite sandwich structures. Compos Struct 2008;86:107–13.
[10]Heimbs S, Pein M. Failure behaviour of honeycomb sandwich corner joints and inserts. Compos Struct 2009;89:575–88.
[11]Park YB, Kweon JH, Choi JH. Failure characteristics of carbon/BMI-Nomex sandwich joints in various hygrothermal conditions. Compos B 2014;60:213–21.
[12]Zang J, Ashby MF. The out-of-plane properties of honeycombs. Int J Mech Sci 1992;34:475–89.
[13]Asprone D, Auricchio F, Menna C, Morganti S, Prota A, Reali A. Statistical finite element analysis of the buckling behavior of honeycomb structures. Compos Struct 2013;105:240–55.
[14]Giglio M, Manes A, Gilioli A. Investigations on sandwich core properties through an experimental–numerical approach. Compos B 2012;43:361–74. [15]Heimbs S. Virtual testing of sandwich core structures using dynamic finite
element simulations. Comput Mater Sci 2009;45:205–16.
[16]Aktay L, Johnson AF, Kröplin BH. Numerical modelling of honeycomb core crush behavior. Eng Fract Mech 2008;75:2616–30.
[17]Kaman MO, Solmaz MY, Turan K. Experimental and numerical analysis of critical buckling load of honeycomb sandwich panels. J Compos Mater 2010;44:2819–31.
[18]Aminanda Y, Castanie B, Barrau JJ, Thevenet P. Experimental analysis and modeling of the crushing of honeycomb cores. Appl Compos Mater 2005;12:213–27.
[19]Roy R, Nguyen KH, Park YB, Kweon JH, Choi JH. Testing and modeling of Nomex™ honeycomb sandwich Panels with bolt insert. Compos B 2014;56:762–9.
[20]Roy R, Kweon JH, Choi JH. Meso-scale finite element modeling of Nomex™ honeycomb cores. Adv Compos Mater 2013;23:17–29.
[21]Kress G, Winkler M. Honeycomb sandwich residual stress deformation pattern. Compos Struct 2009;89:294–302.
[22]Tsujii Y, Tanaka K, Nishida Y. Analysis of mechanical properties of aramid honeycomb core. Trans Jpn Soc Mech Eng 1995;61:1608–14.
[23]Foo CC, Chai GB, Seah LK. Mechanical properties of Nomex material and Nomex honeycomb structure. Compos Struct 2007;80:588–94.
[24] NomexÒ
type 410 technical data sheet. USA: E.I. Du Pont de Nemours; 2012. [25]Kim KS, Chin IJ, Sung IK, Min KS. Curing of Nomex–phenolic and Kraft–
phenolic honeycombs. Kor Polym J 1995;3:35–40.
[26] ASTM Standard D638–03. Standard test method for tensile properties of plastics. West Conshohocken, PA: ASTM International; 2003.
[27]Andrews MC, Lu D, Young RJ. Compressive properties of aramid fibres. Polymer 1997;38:2379–88.
[28] ASTM Standard C365–03. Standard test method for flatwise compressive properties of sandwich cores. West Conshohocken, PA: ASTM International; 2003.
[29] Dieter GE. ASM handbook volume 20: materials selection and design. ASM International; 1997.
[30]Redjel B. Mechanical properties and fracture toughness of phenolic resin. Plast Rubber Compos Process Appl 1995;24:221–8.
[31] Hähnel F, Wolf K. Evaluation of the material properties of resin-impregnated NomexÒ
paper as basis for the simulation of the impact behaviour of honeycomb sandwich. In: Book of abstract of CompTest2006, Porto; 10–12 April 2006. p. 168–169.
[32] HexWebÒ
honeycomb attributes and properties. Stamford, CT: Hexcel Corporation; 1999.
[33]DaSilva LFM, Adams RD. Measurement of the mechanical properties of structural adhesives in tension and shear over a wide range of temperatures. J Adhes Sci Technol 2005;19:109–41.
[34]Berthelot JM. Mécanique des matériaux et structures composites. Le Mans, France: ISMANS; 2010.
[35] Yokoyama T, Nakai K. Evaluation of in-plane orthotropic elastic constants of paper and paperboard. In: Proceeding of 2007 SEM annual conference & exposition on experimental and applied mechanics. Springfield; 3–6 June 2007. p. 1505–1511.
[36]Szewczyk W. Determination of Poisson’s ratio in the plane of the paper. Fibres Text East Eur 2008;16:117–20.
[37]Yang MY, Huang JS. Numerical analysis of the stiffness and strength of regular hexagonal honeycombs with plateau borders. Compos Struct 2004;64:107–14. [38]Karakoç A, Santaoja K, Freund J. Simulation experiments on the effective in-plane compliance of the honeycomb materials. Compos Struct 2013;96:312–20.
[39]Yang MY, Huang JS, Hu JW. Elastic buckling of hexagonal honeycombs with dual imperfections. Compos Struct 2008;82:326–35.
[40]Fischer S, Drechsler K, Kilchert S, Johnson A. Mechanical tests for foldcore base material properties. Compos A 2009;40:1941–52.
[41] Djakaria R, Chandran BI, Gordon MH, Schmidt WF. Determination of Young’s modulus of thin films used in embedded passive devices. In: Proceedings of the 47th electronic components and technology conference. San Jose; 18–21 May 1997. p. 745–749.
[42] Nomoto K. Aramid honeycombs and a method for producing the same. European patent specification (EP 1 152 084 B1); 2001.
[43]Shafizadeh JE, Seferis JC. Scaling of honeycomb compressive yield stresses. Compos A 2000;31:681–8.
[44]Wu YJ, Seferis JC, Lorentz V. Evaluations of an Aramid fiber in nonwoven processes for honeycomb applications. J Appl Polym Sci 2002;86:1149–56. [45] Shafizadeh JE, Seferis JC. Characterization of phenolic resins for composite
honeycomb applications. In: Proceeding of ICCM 12. Paris; 5–9 July 1999. paper 1285.
[46] Gillcore™ HD Honeycomb. Product data sheet. El Monte, CA: M.C. Gill Corporation; 2013.
[47]Hong ST, Pan J, Tyan T, Prasad P. Quasi-static crush behavior of aluminum honeycomb specimens under non-proportional compression-dominant combined loads. Int J Plast 2006;22:1062–88.
![Fig. 7 presents representative stress/strain curves from Nomex[24]paper tensile tests](https://thumb-ap.123doks.com/thumbv2/123dok/3211248.1738134/5.595.132.459.476.738/presents-representative-stress-strain-curves-nomex-paper-tensile.webp)