Improvement of Electrical Characteristics
Gurum Ahmad Pauzi
1,a, Ketrin Chintia Riski
1, Sri Wahyu Suciyati
1,
Junaidi
1, Arif Surtono
1, Amir Supriyanto
1, and Warsito
11
Department of Physics FMIPA University of Lampung 1
Jl.Prof. Dr. Soemantri Brojonegoro No.1 Gedong Meneng Bandar Lampung 35145 a
e-mail: [email protected]
Abstract
The electrical characterization research of electrochemical cell based seawater by using electroplating Cu-Zn electrode with Ag (Cu (Ag)-Zn) has been done. Measurement data is performed to determine the voltage at no load and with the 12 V 3W LED and lumination load. The measurement results were compared with electrochemical cells using Cu-Zn Electrodes without electroplating. Sea water that has been used has a salinity level of 3.5% which has three times the screening process. Measurement data has been taken every hour for 72 hours by refilling sea water every 24 hours. The average voltage drop for electrodes without electroplating is 0.03%, whereas for electrodes with electroplating is 0.01%. The lumination difference is up to 72 hours which is 4 times brighter than Cu-Zn without electroplating process.
Keywords:
Sea Water, Electrochemical Cells, Cu (Ag) -Zn, Cu-Zn, electroplating1. Introduction
Water is the most abundant resource on earth, where three-fourths of the planet's
surface is covered by water. About 97% of the earth's water is saltwater in the
ocean, and 3% is fresh water [1]. The use of sea water as a source of electrical
energy has not been utilized optimally. The existence of electricity from sea water is
a potential and inexpensive solution for the need for lighting around the coast where
government electricity is difficult to access. Energy from seawater can be obtained
through water waves [2], and the electrochemical method is by dipping a pair of
Analysis of the electrical characteristics of seawater as a source of renewable
electric energy has been carried out using three electrode variables, namely C-Zn,
Cu-Al, and Cu-Zn [3]. The results of this study indicate that the Cu-Zn pair is able to
produce more electricity than the other electrode pairs.
In general, corrosion occurs between metal surfaces with oxygen, but corrosion can
also occur between metal material submerged in sea water (5.42 x10⁻⁵ mm / year)
[4]. The reaction of NaCl and H2O on the surface of Cu plate gave rise to the
corrosion of Cupric Chloride (CuCl2), where the high Cl concentration in the solution
can cause serious corrosion [5]. Although cupric chloride is an inhibitor [5], it can
reduce the electrical power (even stop) produced by cells due to obstruction of
electrons to the surface of the electrode. So that the problem of generating
electricity from seawater electrochemistry is not only in the selection of electrode
pairs (Volta series) but also in the amount of corrosion on the surface of the
electrode.
Electric current flows through the surface of a conductor so as an attempt to
enhance the potential difference is to replace Cu with Ag through a coating method.
Plating method is carried out using electrical methods, heat or bath [6]. This method
is certainly much cheaper than made with a pure Ag electrode pair, which of course
costs become more expensive. Besides that the use of Cu is a step to make Ag
coating more adhesive [7].
2. Data/Materials and Methods
The procedure in this study consists of two stages: First, the tool is designed with a
closed system consisting of 20 electrochemical system cells. The volume of sea
water in each cell is 200 ml, each cell is connected in series. The seawater used has
a salinity level of 3.5% and has undergone three filtering sizes of 1 micron. The main
frame is made of acrylic material with a thickness of 3 mm. Second, electrochemical
systems using Cu-Zn electrode pairs and Cu (Ag) -Nn electroplating results. Before
electroplating, Cu is first washed with a solution (20% HNO3) [6]. The size of each
electrode is 4x7cm and a thickness of 3 mm. Each test is carried out with a 12 V 3
watt LED load for 3 x 24 hours. Measurements are carried out every hour for 72
when the load is connected (Vb) and when it is not connected (Vbl) to the seawater
electrochemical system. Measurement of LED illumination (lux) is carried out at a
distance of 10 cm.
3. Results and discussion.
3.1 No-load Resistance voltage measurement
No-load measurements are taken once every hour. The load connected to the
output terminal is then removed, and then the voltage measurement is directly
carried out at the output terminal. After the measurement is carried out, the load is
connected again. Measurement graph in the following Figure 1
.
.
Figure 1. Voltage measurement without resistance load
Based on the graph of Figure 1, at the beginning of the voltage measurement it can
be seen that the voltage generated by the Cu-Zn and Cu (Ag) -Zn pairs is quite high
and produces almost the same voltage. This is due to the condition of the plate is
still very clean and still not contaminated by the appearance of corrosion due to the
reaction between sea water (NaCl) and Cu. The longer the condition of the plate
surface, the more impurities so that it inhibits the transfer of electrons from the
does not occur significantly to the voltage generated when refilling on the second
and third days. The measurement results show that the voltage generated by Cu
(Ag) -Zn electrode is always greater than the Cu-Zn electrode pair voltage. This is
due to the fact that Ag has the ability to improve the electrical properties of materials
[8]. On the third day the output voltage at Cu-Zn dropped significantly. Based on
previous research that the Cu-Zn pair was unable to produce stress again on the
fourth day. This does not apply to Cu (Ag) -Zn pairs, the voltage remains stable for
longer. The average voltage drop for electrodes without electroplating is 0.03%,
whereas for electrodes with electroplating is 0.01%.
3..2 Load Resistance voltage measurement
The following is a measuring measurement when given a 12 V 3 watt led load. The
voltage is measured when the load is connected to the load.
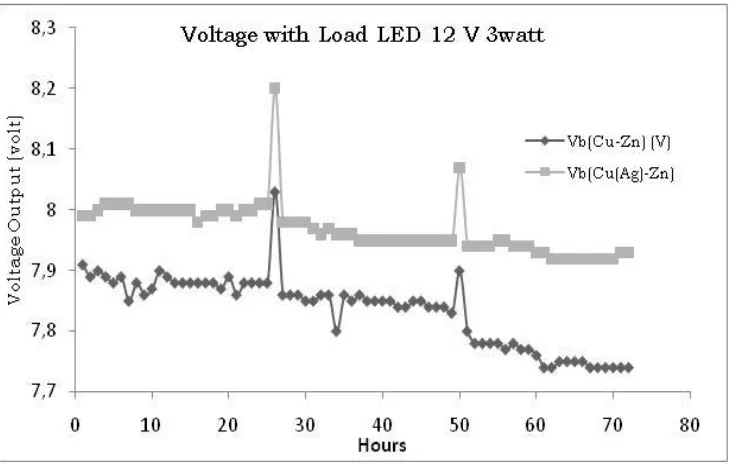
Figure 2. voltage measurement graph with resistance load
The graph in Figure 2 above is the voltage measured at the resistance load when
installed. The measured voltage is in the initial range of 8 volts. These results
indicate that Cu (Ag) -Zn electrodes are able to show more stable results, even
more than 3 days. While the measured voltage in the Cu-Zn pair decreases and
then runs out. Two pieces of peak voltage are voltage conditions when changing
generated by the cell (Fig. 1). the voltage will be divided by the internal resistance in
the electrochemical cell. internal Cu-Zn cell resistance is increasing every time [3].
There is a voltage difference in the internal resistance of electrochemical cells. This
shows that electrochemical cells are not yet completely perfect like most batteries.
So that further efforts are needed to modify electrochemical cells.
3.3 Lumination Measurement
Lumination measurements are carried out to see how far the voltage generated is
directly generated at a load, in this case a 12 volt 3 watt led. The following figure is a
graph of lumination measurements on these loads.
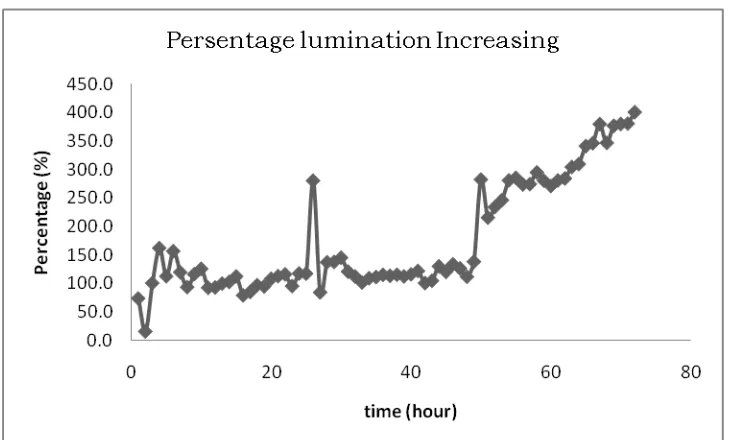
Figure 4. Percentage increase lumination in Cu (Ag) -Zn and Cu-Zn
The graph in Figure 4 above shows that the longer the electrochemical process is
carried out on the Cu (Ag) -Zn system, the higher the luminance increase compared
to the voltage produced by Cu-Zn. Measurements on the 72nd hour of lumination
produced are four times brighter than the lights produced by Cu-Zn electrodes.
4. Conclusions
Electrochemical cell research with Cu (Ag) -Zn electrode showed better
performance compared to Cu-Zn electrode. Increases are found at no-load stresses
and with loads. The resulting led lumination showed that the Cu (Ag) -Zn electrode
was four times brighter than without electroplating.
Acknowledgment
The research is financially supported by PTUPT University of Lampung, 2018.
References
[1] M. S. El-Sebaey, S. El-Din, M. Habib, and A. El-Hanafy, “An Experimental
Study on a New Design of Double Slope Solar Still with External Flatted and
[2] S. Barstow and A. Kabuth, “Assessing the global wave energy potential,”
Proc. OMAE2010 29th, no. 2008, 2010.
[3] G. A. Pauzi, E. Hudaya, A. Supriyanto, Warsito., and A. Surtono, “Analisis
Karakteristik Elektrik Air Laut Sebagai Sumber Energi Listrik Terbarukan,” SN SMIAP Proceeding 2016, vol. 4, pp. 1–8, 2016.
[4] G. A. Pauzi, A. Sa, D. Rahmayanti, N. Em, J. Prof, S. Brojonegoro, and N.
Bandar, “Perhitungan Laju Korosi di dalam Larutan Air Laut dan Air Garam 3 % pada Paku dan Besi ASTM A36,” J. Ilm. Penelit. dan Pembelajaran Fis., vol. 1, no. 1, 2015.
[5] L. Chen, H. J. A, L. Xu, and G. Lu, “Electrochemical Recovery of Copper from
Spent Alkaline Etching Solutions,” Conf. Pap. Recycl. Waste treaIment Miner. Met. Prooesstng Tech. Econ. Asp. 16-20 June 2002 sweden, vol. 43, pp. 1–2,
2002.
[6] L. Chen, H. Jing, L. Xu, and G. Lu, “Study on Non-Cyanide Silver
Electroplating With Copper Substrate,” Adv. Mater. Res., pp. 2936–2939, 2012.
[7] C. Cheng, T. Arunagiri, and O. Chyan, “Electrodeposition of Silver and
Copper / Silver Multilayer on Ruthenium Substrate as a Potential New Metal
Interconnect for Integrated Circuits,” Am. J. Undergrad. Res., vol. 2, no. 1, pp. 11–18, 2003.
[8] X. M. Liu, S. L. Wu, P. K. Chu, C. Y. Chung, J. Zheng, and S. L. Li, “Effects of
coating process on the characteristics of Ag –SnO 2 contact materials,”