@
IAEA HUMAN HEALTH SERIES
No. 1
The following States are Members of the International Atomic Energy Agency:
The Agency’s Statute was approved on 23 October 1956 by the Conference on the Statute of the IAEA held at United Nations Headquarters, New York; it entered into force on 29 July 1957. The Headquarters of the Agency are situated in Vienna. Its principal objective is “to accelerate and enlarge the contribution of atomic energy to peace, health and prosperity throughout the world’’.
QUALITY ASSURANCE FOR PET
AND PET/CT SYSTEMS
INTERNATIONAL ATOMIC ENERGY AGENCY VIENNA, 2009
IAEA Library Cataloguing in Publication Data
Quality assurance for PET and PET/CT systems. — Vienna : International Atomic Energy Agency, 2009.
p. ; 24 cm. — (IAEA human health series, ISSN 2075–3772 ; no. 1) STI/PUB/1393
ISBN 978–92–0–103609–4 Includes bibliographical references.
1. Tomography — Quality control. 2. Radiography, Medical — Instruments — Quality control. I. International Atomic Energy Agency. II. Series.
IAEAL 09–00582
COPYRIGHT NOTICE
All IAEA scientific and technical publications are protected by the terms of the Universal Copyright Convention as adopted in 1952 (Berne) and as revised in 1972 (Paris). The copyright has since been extended by the World Intellectual Property Organization (Geneva) to include electronic and virtual intellectual property. Permission to use whole or parts of texts contained in IAEA publications in printed or electronic form must be obtained and is usually subject to royalty agreements. Proposals for non-commercial reproductions and translations are welcomed and considered on a case-by-case basis. Enquiries should be addressed to the IAEA Publishing Section at:
Sales and Promotion, Publishing Section International Atomic Energy Agency Vienna International Centre
PO Box 100
1400 Vienna, Austria fax: +43 1 2600 29302 tel.: +43 1 2600 22417
email: [email protected] http://www.iaea.org/books
© IAEA, 2009 Printed by the IAEA in Austria
FOREWORD
Improvement in quality assurance (QA) in nuclear medicine and, in particular, in quality control (QC) of related equipment has for a long time been a major field of interest of the IAEA. Starting from the late 1970s, several publications were produced, including Quality Control of Nuclear Medicine Instruments (IAEA-TECDOC-317) in 1984, and the still widely used revision of this publication, IAEA-TECDOC-602, issued in 1991. Additional QC of single photon emission computed tomography (SPECT) systems has been addressed in the IAEA Quality Control Atlas for Scintillation Camera Systems, which provides a comprehensive set of sample SPECT artefacts. Positron emission tomography (PET) scanners and related performance assessment and QC were not included in the previous publications, as PET has been mainly a research tool, with limited distribution until the 1990s. The tremendous role played at present by PET and PET/CT in oncology, as well as in cardiology and neurology, associated with the increasing use of PET for multiple purposes has prompted the need for updated guidelines specific to PET and PET/CT in terms of acceptance testing, as well as in terms of QC and QA.
This publication provides guidelines for the implementation of QA and QC programmes concerning the combined medical diagnostic modality of PET and CT technologies. The use of these independent, but complementary, imaging techniques is frequent and growing within the fields of diagnostic imaging, oncology, cardiology and neurology, where they allow physicians to locate and diagnose malignant diseases accurately. Specific topics of discussion include the frameworks for reference values, tolerances and action levels, minimal required configurations with corresponding performance characteristics, and the management of ancillary equipment.
EDITORIAL NOTE
Although great care has been taken to maintain the accuracy of information contained in this publication, neither the IAEA nor its Member States assume any responsibility for consequences which may arise from its use.
The use of particular designations of countries or territories does not imply any judgement by the publisher, the IAEA, as to the legal status of such countries or territories, of their authorities and institutions or of the delimitation of their boundaries.
CONTENTS
1. INTRODUCTION . . . 1
2. BASIC PET/CT TECHNOLOGY . . . 2
2.1. Introduction . . . 2
2.2. PET technology . . . 3
2.2.1. PET radionuclides . . . 3
2.2.2. The fundamental limits of PET . . . 4
2.2.3. Detector crystals for PET . . . 6
2.2.4. Detector configuration . . . 8
2.2.5. Components of the response of a PET scanner . . . 8
2.2.6. Two dimensional and three dimensional operation . . . 10
2.2.7. Time-of-flight PET . . . 11
2.3. Computed tomography technology . . . 12
2.3.1. Computed tomography gantry: Tube, collimator, filters and detector . . . 12
2.3.2. Image reconstruction . . . 15
2.3.3. Scanning procedures . . . 15
2.3.4. Image quality . . . 17
2.3.5. Computed tomography doses . . . 18
2.4. Combined PET/CT technology . . . 19
2.5. Computed tomography based attenuation correction . . . 20
3. CLINICAL APPLICATIONS OF PET/CT . . . 21
3.1. Introduction . . . 21
3.2. Oncology . . . 24
3.3. Cardiology . . . 25
3.4. Neurology . . . 26
4. QUALITY ASSURANCE IN PET/CT . . . 27
4.1. Introduction . . . 27
4.2. Introduction to acceptance testing . . . 30
4.2.1. Defining acceptance testing . . . 31
4.2.2. Responsibilities for acceptance testing . . . 32
4.2.3. Sequence of acceptance tests . . . 33
4.3.1. Post-service testing . . . 34
4.3.2. Equipment required for quality control testing . . . 34
4.3.3. Control charts . . . 35
4.3.4. Responsibilities for quality control tests . . . 36
4.3.5. Frequency of quality control tests . . . 37
4.3.6. Important points . . . 38
4.3.7. Quality control records . . . 39
4.3.8. Testing of TOF-PET . . . 39
4.4. Preventive maintenance . . . 39
5. ACCEPTANCE TEST PROCEDURES . . . 40
5.1. PET acceptance testing . . . 40
5.1.1. Spatial resolution . . . 41
5.1.2. Sensitivity . . . 46
5.1.3. Scatter fraction, count losses and randoms measurements . . . 51
5.1.4. Energy resolution . . . 59
5.1.5. Image quality and accuracy of attenuation, and scatter correction and quantitation . . . 61
5.1.6. Coincidence timing resolution for TOF positron emission tomography . . . 69
5.2. Computed tomography acceptance testing . . . 71
5.2.1. Scattered radiation measurements and shielding verification . . . 71
5.2.2. Computed tomography laser alignment . . . 73
5.2.3. Tabletop alignment and positional accuracy, and scout scan accuracy . . . 75
5.2.4. Visual inspection and programme review . . . 77
5.2.5. Display profile and width . . . 79
5.2.6. High contrast modulation . . . 80
5.2.7. The kVp value and the half-value layer . . . 81
5.2.8. Radiation doses, image noise and image uniformity . . . 84
5.2.9. Computed tomography number and electron density accuracy . . . 87
5.3. PET/CT acceptance testing . . . 89
5.3.1. Accuracy of PET/CT image registration . . . 89
6. ROUTINE QUALITY CONTROL PROCEDURES . . . 99
6.1. Quality control of PET . . . 99
6.1.1. Daily PET detector stability test . . . 100
6.1.2. Daily coincidence timing resolution tests in TOF PETs . . . 103
6.1.3. Test of PET/CT scans in clinical mode . . . 103
6.1.4. Uniformity of the reconstructed image . . . 104
6.1.5. PET normalization . . . 109
6.1.6. 2-D–3-D Radioactivity concentration calibration . . . 110
6.1.7. Offset calibration for PET/CT . . . 112
6.1.8. Routine image quality test for PET/CT . . . 113
6.2. Quality control of CT equipment . . . 115
6.2.1. CT laser alignment . . . 115
6.2.2. Tabletop alignment and positional accuracy, and scout scan accuracy . . . 116
6.2.3. Computed tomography number and uniformity, image noise, and image artefacts . . . 117
6.2.4. High contrast modulation . . . 119
6.2.5. Annual quality control tests . . . 120
6.3. Quality control for PET/CT . . . 120
6.3.1. Visual display and QC of hard copy image . . . 120
6.4. Considerations for mobile PET/CT facilities . . . 123
APPENDIX I: QUALITY CONTROL OF THE PET COMPONENT OF PET/CT . . . 125
APPENDIX II: QUALITY CONTROL OF THE CT COMPONENT OF PET/CT . . . 130
REFERENCES . . . 135
GLOSSARY . . . 139
1. INTRODUCTION
The refinement of standardized performance measurements for positron emission tomography (PET) scanners has been an ongoing process over the last ten years. The initial efforts, initiated by the Society of Nuclear Medicine and further elaborated by the National Electrical Manufacturers Association (NEMA) of the Unites States of America, resulted in the creation of an initial standard, the NU2-1994 document. In the same period, the European Union started to develop a standardized performance test, which resulted in the Inter-national Electrotechnical Commission (IEC) standard. Despite some similar-ities in the way some procedures were performed, there were distinct differences in the way the performance tests, including use of different phantoms, the data acquisition procedures as well as the image reconstruction procedures, were performed. The early 1990s saw the clinical introduction of fully three dimensional (3-D) PET systems that operate without interplane septa. These scanners were much more sensitive to scattering and randoms originating from radioactivity outside the field-of-view (FOV), and there was a need for performance tests that were more relevant to this mode of operation. In 2001, the 1994 NEMA standard was updated to NEMA NU2-2001, to speci-fically cater for 3-D scanning and the effects of out-of-field radioactivity. The NEMA NU2-2001 standard introduced a new 70 cm long phantom with an off-centre line source to provide a more realistic whole body radioactivity distri-bution with out-of-field radioactivity. In addition, the introduction of an image quality test that assessed the overall performance of the scanner using a torso phantom with out-of-field radioactivity allowed the performance of different scanners to be compared under more realistic conditions. A revised version of this standard, NEMA NU2-2007, was released in 2007, which incorporates changes to cater for the introduction of PET scanners with intrinsically radioactive components.
The benefit of these standards is that they allow direct comparison of PET scanners from different vendors, as well as providing standardized and well described tests for assuring that the scanners meet their specified performance. PET technology is continually evolving, and the NEMA standards do not address the relatively recent addition of the computed tomography (CT) component, and the accompanying need to ensure proper registration of the PET and CT data. The present guidelines are intended to provide standard testing procedures that address both the PET and CT components.
NEMA NU2-2007 procedures in future, it is essential that acceptance tests follow the same procedures so that performance parameters may be compared. Therefore, many of the PET acceptance tests described in this publication adhere closely to the NEMA 2007 standard.
Once the instrument that is being tested passes all of the acceptance tests, ‘benchmark tests’ must be performed. These tests are a set of quality control (QC) tests that are performed in the same way as the routine QC procedures. The benchmark tests serve as a baseline for instrument performance and are used to evaluate subsequent QC tests. The tests should also be used to evaluate instrument performance after major services and updates in software, and must be repeated after upgrades in hardware.
The present publication is a technical reference book that provides guidance about the specifications and prerequisites required for acceptance testing of PET and PET/CT scanners, including the professionals to be involved, definitions of applications, minimal required configurations and corresponding performance parameters, as well as ancillary equipment.
It also provides guidelines for routine QC of PET and PET/CT scanners, as well as a framework for setting reference values, tolerance values and action levels. Following these guidelines would ensure operation of a scanner under optimal conditions that yield the best performance in routine clinical tasks that involve lesion detection as well as quantitation of the radioactive material concentration. Such tasks are crucial for early detection of lesions in whole body oncological PET as well as staging, follow-up and therapy monitoring in oncological PET. These tasks are also crucial for quantitation of radioactivity when assessing the response to therapy or quantitating the uptake of a radio-pharmaceutical. The same considerations apply to other indications of PET/CT in cardiac, neurological and inflammation imaging.
2. BASIC PET/CT TECHNOLOGY
2.1. INTRODUCTION
of response (LOR), i.e. a line along which the positron annihilation was located. By acquiring a large number of LORs (several hundred millions), it is possible to reconstruct the distribution of the radioactive nuclei inside the volume studied. This characteristic is of paramount importance, as it obviates the need for a collimator to determine the direction of emission of the photon and yields a significantly increased sensitivity as compared with single photon emission computed tomography (SPECT).
2.2. PET TECHNOLOGY
2.2.1. PET radionuclides
Positron emission tomography is now a well established diagnostic modality that is extensively used in oncology for tumour diagnosis, staging, radiotherapy planning and monitoring, as well as cardiology for myocardial viability and perfusion, and neurology for perfusion and neuro-receptor imaging. Positron emission tomography also remains a strong molecular imaging modality, as radionuclides with adequate physical and biochemical characteristics are available and are being developed. Ideal PET radionuclides need to be:
(a) Readily available or (relatively) easy to produce, in adequate quantities, and with the required purity;
(b) Suitable for synthesis of radiopharmaceuticals that allow the study of biochemical processes in vivo.
Among positron emitters are several interesting radioisotopes of fundamental ‘building blocks’ of organic molecules such as carbon, nitrogen and oxygen, as well as radioisotopes of other elements, such as fluorine, which can be efficiently used to label a large variety of substrates and molecules of pharmaceutical relevance, allowing the study of numerous biological processes in vivo at the molecular level.
Table 1 shows the principal PET radionuclides, with some of their relevant physical characteristics.
The short half-lives of these radionuclides require, in most cases, that they be produced using dedicated cyclotrons or generators at the same site where they will be used. However, 18F based radiopharmaceuticals can be
2.2.2. The fundamental limits of PET
From a physics point of view, the ability of a PET system to correctly position the annihilation events is affected by several factors:
(a) The range of the emitted positron in matter before annihilation; (b) The dimensions of the crystals used in the detector;
(c) The non-exact collinearity of the annihilation photons.
A thorough discussion of these factors can be found elsewhere [1], and only a short summary is presented in Sections 2.2.2.1–2.2.2.4 below.
2.2.2.1. Positron range
Positrons do not immediately annihilate when they are emitted. Instead they travel some distance in matter, depending on their initial kinetic energy and the electron density of the absorbing material. The emitted positrons have a continuous distribution of kinetic energy values, ranging from zero to a maximum energy (Table 1). Therefore, the range of positrons is not a fixed value but rather a distribution of values that can be characterized by a full width at half-maximum (FWHM). For 18F and 11C, this value, FWHM
p, is of the
order of 0.1–0.5 mm in water, and for 13N and 82Rb, which are widely used in
cardiac imaging, it is of the order of 1.3–2.5 mm.
TABLE 1. PHYSICAL CHARACTERISTICS OF THE PRINCIPAL PET RADIONUCLIDES
Radionuclide Source Half-life
(min)
Maximum (and mean) positron energies
(keV)
Mean positron range in water
(mm)
C-11 Cyclotron 20.4 970 (390) 1.1
N-13 Cyclotron 9.96 1190 (490) 1.3
O-15 Cyclotron 2.07 1720 (740) 2.5
F-18 Cyclotron 110 635 (250) 0.5
Ga-68 Generator 68 1899 (836) 0.8
2.2.2.2. Detector dimensions
The finite dimensions of radiation detectors do not allow us to draw an LOR between two detectors but rather a small volume.
For a point source at the centre of the detection volume, and for small crystals (small compared with the distance between a pair of detectors), the response of the system can be described by a triangular function with a spread equal to:
FWHMD = wD/2 (1)
where wD is the dimension of a detection element. This is shown graphically in
Fig. 1.
In modern scanners, the transverse dimension of crystals is about 4–6 mm, as compared with a length of 2–3 cm, and the contribution to total system spatial resolution is of the order of 2–3 mm FWHM.
2.2.2.3. Non-collinearity
Annihilation photons are not emitted exactly at 180° because the positronium (positron plus atomic electron) has some residual momentum. This results in a spread of the system’s response function, which is given by:
Detector 1
Volume of coincidences acceptance
Detector 2
Coincidences not revealed
FWHMN = 0.0022ds (2)
where ds (in millimetres) is the distance between opposite detector elements or
the diameter of the detection system.
In clinical scanners that are state of the art, this spread is of the order of 800–900 mm, and thus the contribution of non-collinearity to the spatial resolution of the scanner is about 1.8–2.0 mm.
2.2.2.4. Technological factors
The resolution of a PET scanner is influenced by the factors described above, and depends mainly on the physical characteristics of the radionuclide and the detection system. However, other factors must be included in order to model correctly the spatial resolution of a PET system. As pointed out by Moses and Derenzo [2], for scanners based on detector elements organized in blocks, a spread of FWHMB= 2 mmshould be added.
The theoretical limit of the spatial resolution of a PET scanner can thus be estimated by:
FWHMtot = (FWHMD2 + FWHM
N2 + FWHMp2 + FWHMB2)1/2 (3)
The above equation assumes a perfect spatial resolution restoration by the reconstruction algorithm. In practice, an additional degradation may result from the specific reconstruction algorithm used and the choice of recon-struction parameters. For example, in the case of 18F, the overall spatial
resolution that can be achieved in the reconstructed volume by a clinical PET scanner that is state of the art is in the range 4–6 mm FWHM.
2.2.3. Detector crystals for PET
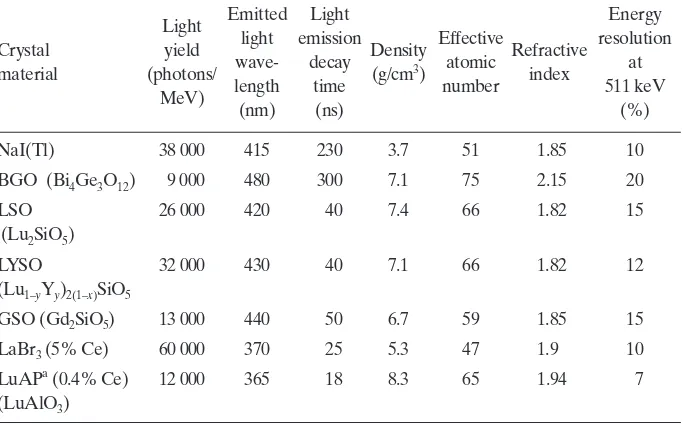
Annihilation photons are not only more energetic than those in SPECT and planar imaging, but also need to be detected in coincidence. This places specific requirements on the crystal detector materials used in clinical PET scanners. The characteristics of some scintillator materials used in commercial PET scanners are listed in Table 2.
Sodium iodide activated with thallium, NaI(Tl), is a reference scintil-lation crystal widely used in SPECT for its excellent light yield and energy resolution, in combination with a relatively high effective atomic number Zeff.
photons and has been widely used in clinical PET scanners since the 1990s. Both NaI(Tl) and BGO are slow scintillating materials, i.e. both these materials are relatively slow in re-emitting, in the form of visible light photons, the energy absorbed in the interaction with ionizing radiation. As a result, these scintil-lators require a relatively long time coincidence window. There has been a significant effort made by several manufacturers to introduce faster scintil-lating materials such as lutetium or lutetium/yttrium oxyorthosilicate (LSO/ LYSO), which have similar densities and Zeff to BGO, a higher light yield than
BGO and a faster light decay. It is noteworthy that naturally occurring lutetium comprises two isotopes, 175Lu and 176Lu; the latter is naturally radioactive and,
although present in small amounts (2.6%), produces undesired single events in the PET detector that, although negligible at clinical count rates, can affect low count rate measurements such as those in some QC procedures.
resolution and very fast light decay. Cost issues and availability remain limiting factors to the widespread adoption of new scintillating materials.
2.2.4. Detector configuration
Positron emission tomography scanners use a large number of small crystals, with cross-sectional dimensions of 4–8 mm (e.g., cross-sections of 4 × 4, 4 × 6, 6 × 6 and 4 × 8 mm2) and depths of 20–30 mm. In many scanners,
detectors are organized in blocks, for example, an array of 8 × 8 crystals encoded on an array of 2 × 2 photomultipliers. About one hundred blocks form a ring of detectors, and state of the art scanners have three to four complete rings of blocks, yielding an axial FOV of 15–22 cm. As a result, 12 000 to 18 000 individual crystals are needed, depending on the specific characteristics of each scanner, to build a scanner. Other designs use flat panels, about 9 cm × 18 cm, of pixelated crystals, every crystal element being 4 mm × 6 mm. Each panel has then more than 600 crystals and is coupled to an array of 15 photomultipliers; about 28 panels are used to build a full ring, yielding a total of about 18 000 individual crystal elements. The large number of crystals, added to the complexity of manufacture and assembly required to build the PET detector, are responsible for a large part of the cost of PET scanners.
2.2.5. Components of the response of a PET scanner
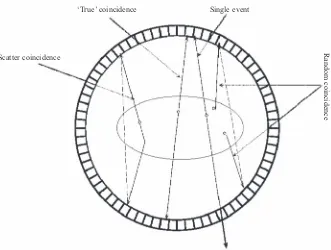
The events detected in a PET scanner consist not only of ‘true’ coincidence events but also of unwanted events arising from other mechanisms of interaction in the patient and detector that do not contribute useful information.
When a single event is detected in a crystal, it has to satisfy an energy acceptance criterion; the energy of the pulse produced must be higher than the lower level energy discriminator (LLD), i.e. set depending on the type of crystals used and the trade-off between sensitivity and spatial resolution (typically 350 keV for BGO and 420 keV for LSO/LYSO). The system then checks whether another valid event has been detected within a limited coincidence time window (CTW). The CTW duration is set, taking into account the light decay characteristics of the crystal used and the design of the electronics.
Randoms are detected when two independent photons arising from separate annihilation events are recorded in coincidence. The probability of detection of randoms increases with the total single event count rate. If Ri is the
single event rate on a detector i, the randoms coincidence rate between two
detectors is given by the following expression:
R12 = 2 R1R2 (4)
where is the length of the CTW.
The above equation can be used for correction of randoms, provided the system is able to record the single event rate on each detector. Alternatively, PET scanners can correct for randoms by using a second delayed time window, which provides an estimate of the rate of randoms. Correction is applied by subtracting these randoms from the data acquired in the first window.
If one of the annihilation photons undergoes a Compton interaction, the original direction of propagation is changed, but the energy of the scattered photon may still be greater than that of the LLD, particularly if the latter is set low due to limited energy resolution of the crystal material. If the unscattered
Scatter coincidence Random coincidence Single event
‘True’ coincidence
and scattered photons are detected in coincidence, this will produce a misposi-tioned LOR, increasing blurring in the reconstructed image. For a description of scatter correction techniques, see Refs[3–5].
The total number of prompt coincidence events, P, detected in a PET
scanner can be expressed as the sum of true, random and scattered coincidence events:
P = T + R + S (5)
2.2.6. Two dimensional and three dimensional operation
In the so-called two dimensional (2-D) mode of operation, septa made of a high Z material, such as tungsten, are placed between adjacent rings of
detectors, in order to limit the acceptance angle of LORs and to reduce scatter and random coincidences, at the expense of a reduction in the efficiency of the scanner to true coincidences.
In order to improve the efficiency of detection of true coincidences, scanners operating in 2-D mode can optionally accept coincidences not only in the direct planes but also in adjacent cross-planes.
In modern scanners, septa may be retracted or not present. In this case, the system operates in three dimensional (3-D) mode, and all coincidences detected within a sensitive volume of the scanner can be accepted (Fig. 3). Therefore, 3-D septa-less whole body PET yields increased sensitivity to true
Septa
2-D – direct planes 2-D – cross-planes 3-D
coincidences at the expense of increased sensitivity to scattered and random coincidences. Newer crystal materials used in 3-D scanners have better energy resolution (15% for GSO and LSO and 12% for LYSO as compared with
20% for BGO), allowing the use of a higher LLD to discard a higher proportion of scattered events. Furthermore, these crystals have shorter light decay constants, allowing the use of a shorter CTW and a reduction of random coincidences.
2.2.7. Time-of-flight PET
Fast scintillating crystals with fast rise times and short decay times allow the measurement of the difference of arrival times of the two 511 keV photons emitted following the annihilation. The difference in arrival times will yield information regarding the distance travelled by each of the two annihilation photons and would, therefore, restrict the likely location of the annihilation event to a portion of the LOR. Since the likely location of emission associated with a 500 ps full width at half-time timing resolution (typical of the fastest crystals available at present) is known within 3 × 10⁸ m·s–1 × 500 × 10–12 s 7 cm
(uncertainty, x, in Fig. 4), no direct improvement in spatial resolution is
expected, as the crystal size is typically 4–6 mm. However, the reduction in the
Conventional PET reconstruction Time-of-flight PET reconstruction
FOV diameter image elements dimension
localization uncertainty image elements dimension
uncertainty of the likely location of emission will improve the signal-to-noise ratio within the tomographic reconstruction.
2.3. COMPUTED TOMOGRAPHY TECHNOLOGY
Computed tomography is a mature diagnostic modality that is still undergoing rapid development. The combination of CT with PET is an example of a new technical and clinical application as in isotropic imaging for cardiac assessment. The basic principles of CT imaging are found in many texts [6, 7]. A brief introduction will now be given.
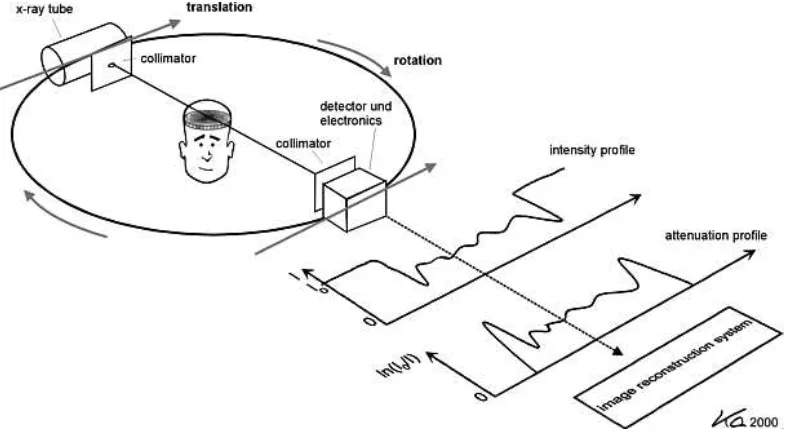
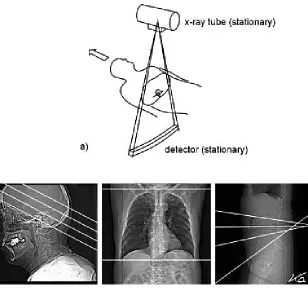
Computed tomography is a radiographic process that produces a photon attenuation map of the patient based on the variable attenuation of a beam of X rays as it passes through a patient. In contrast to isotope imaging, where detected photons are emitted from the patient, an external source of X rays is projected through the patient to form a transmitted attenuation profile at the detectors. In order to obtain a cross-sectional image, the beam is restricted to a thin fan across the patient (in the x–y direction) of between 0.5 and 10 mm
thickness for a single slice in the axial (z) direction. Many hundreds of
attenuation profiles are created in each revolution of the X ray tube around the patient. These profiles are then reconstructed to form the required transverse image (Fig. 5).
2.3.1. Computed tomography gantry: Tube, collimator, filters and detector
The large X ray tube located within the gantry (Fig. 6) operates at between 80 and 140 kV. This tube can generate over 109 photons/(mm2·s) at
75 cm from the tube focus for typical CT radiographic settings of tube voltage (120 kV) and current (300 mA). This is many orders of magnitude higher than is possible with isotope imaging and explains why a CT scanner can produce a low noise image in less than a second while isotope images require 10–30 min and produce images with significant noise.
Operation of X ray tubes at such high voltage and current values requires rapid dissipation of heat to avoid tube failure. Tube cooling systems are designed to deal with this. However, it is essential that the ambient temperature around the scanner or heat exchanger be controlled by effective air conditioning to allow optimal operation.
essential to use the correct filter for the part of the body being investigated. The slice width collimator, positioned at the filter exit, determines the width of the X ray beam. In modern scanners, multiple slices (currently up to 256) are acquired simultaneously. The width of the beams for these acquisitions is the product of the individual slice width and the number of slices acquired simultaneously.
The X ray detector element is typically an ionization chamber using high pressure xenon or a scintillation detector. Typical materials include Gd2O2S,
xenon, YGdO and CdWO4. Important specifications for such detector elements include a high dynamic range, high quantum absorption efficiency and a fast temporal response with a low afterglow. For a single slice axial scanner, the detector will have over 700 elements along an arc to intersect the exit beam of the scan plane. This is known as third generation scan geometry (Fig. 7) and is the basic design for modern CT scanners. In multislice scanners, the detector has additional adjoining arcs of detector elements. Such multirow detectors may have up to 256 rows, allowing a total acquisition width of 132 mm (measured at the isocentre). This type of acquisition can produce slice thicknesses of from 0.5 to 10 mm. With such a detector, the acquisition time is reduced and the occurrence of motion artefacts is considerably reduced.
2.3.2. Image reconstruction
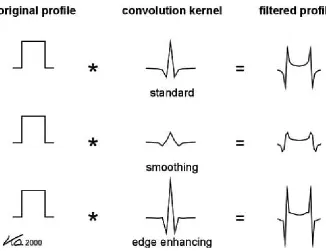
Typically, the reconstruction of an axial image uses projection profiles acquired from a 360° rotation of the tube and detector around the patient. However, reconstruction is possible with projections from as little as 180° of rotation, while in spiral CT scanners, variable reconstruction angles are used. The reconstruction is primarily done by a filtered back-projection method (Fig. 8) that allows reconstruction in almost real time.
2.3.3. Scanning procedures
The simplest image acquisition procedure is the scout scan (Fig. 9), which is taken to plan a CT slice acquisition. This scan is really a digital radiograph, with the X ray tube and detector moving in one plane relative to the patient (in fact it is the patient that moves) without any rotation.
Axial slice scans involve acquiring a collection of attenuation profiles around a patient who is stationary on the scan table. This ensures that all the profiles are in the one plane and allows rapid reconstruction computation. The table is then moved to allow the acquisition of a new slice for a different anatomical region.
Spiral or helical scanning is achieved when the table is moved at the same time as the scan profiles are acquired. This removes some artefacts associated with respiratory motion and allows the scan time to be greatly reduced. However, the reconstruction is complicated as the profiles are no longer in the same plane and need to be interpolated (so called z-interpolation) to a
pseudo-planar state before reconstruction. Maximum benefit from spiral CT acquisition is achieved with multislice acquisition. Here, a process known as z
-filtering is implemented. These algorithms have different characteristics than those of axial reconstruction algorithms. One notable feature is the ability to alter the reconstructed slice thickness to any thickness equal to or greater than the original acquisition thickness for an individual slice. This leads to the possibility of generating many sets of images from one acquisition, and can greatly increase the image storage requirements and data management practices of a department.
The key parameter describing spiral CT acquisition is pitch, defined as the ratio of the table advance during a 360° rotation and the width of the total
X ray collimation (i.e. the detector width multiplied by the number of detectors). Consequently, a large pitch implies faster acquisition with reduced dose, but with the cost of reduced resolution along the z axis, while low pitch
has a slower acquisition and an increased dose but with better z resolution.
2.3.4. Image quality
As mentioned above, CT scanning utilizes a large photon flux in acquisition to achieve low noise images. These images allow the identification of very small differences in photon attenuation or low contrast differences in
tissue composition. The spatial resolution in a CT image is, however, limited to approximately 0.5 mm FWHM, which is inferior to most other radiological procedures but better than that possible with radioisotope imaging. Computed tomography scanners can also acquire slices of thin tissue thickness (with a minimum of 0.5 mm), which allows very precise cross-sectional delineation of structures without excessive partial volume effects. Partial volume effects are consequences of limited spatial resolution. They lead to a loss of signal in tissue regions of a size similar to the FWHM of the point spread function, distorting or reducing the contrast of features. The importance of this is reflected by the clinical desire for small slice width images for display.
Perhaps the greatest problem in CT imaging is the occurrence of artefacts. Many of these are due to equipment alignment. Because of this, it is essential that the room preparation be considered carefully. The room must be stable, level and able to withstand the weight of the scanner. During assembly, the alignment of components is critical and scans must be carefully examined during the acceptance and early clinical phases to check for any indication in phantom images. Another cause of artefacts is electronic component failure or poor board connections.
2.3.5. Computed tomography doses
The large photon flux gives rise to good image quality as well as high patient dose. The main reason for excessive doses to patients is the use of inappropriate CT scan protocols. This is particularly true in the case of paediatric examinations [8]. It is essential for a medical physicist to determine the dose parameters (the weighted computed tomography dose index (CTDIw) and the dose length product (DLP)) that would deliver an acceptable dose to typical patients. This is achieved by consideration of the CT scan protocol technique factors selected by the scanner staff and the measured scan dose data. These doses should be compared with national or international diagnostic reference levels (DRLs). If the doses are not significantly below these levels, the procedures should be examined to find out if the protocol modification is appropriate to allow dose reduction without impairment of diagnostic outcome. The scan factors that should be examined to determine what changes ought to be made should include [9]:
(a) Examining the reconstruction kernel or filter. By using a ‘smoother’ filter, the dose can be reduced by up to tenfold in extreme cases.
(b) Examining the scan length on the patient.
(d) Increasing the displayed slice width. This will reduce the noise, and often the clinical image quality is not impaired.
If children are involved in PET/CT imaging, special care should be taken. It should be recognized that DRLs are not well defined for patients of these sizes. It may be useful to estimate the effective dose for such procedures, as has been described in the literature [10].
It is important to remember that the CT images used in PET/CT are typically not used for diagnostic purposes. Consequently, it is possible to reduce the dose to the patient from the CT scan significantly, as a slight increase in the CT image noise will not be detrimental to the images for this application.
2.4. COMBINED PET/CT TECHNOLOGY
Positron emission tomography and CT provide useful and comple-mentary clinical information: PET can identify functional abnormalities that might be undetectable on CT alone, while CT provides detailed anatomical information, but can normally identify malignancies only after structural changes have occurred. Identifying the precise location of a site of malignant disease often has a profound effect on decisions affecting the diagnosis, prognosis, staging, treatment and overall patient management. However, precise localization is difficult in PET due to the absence of identifiable anatomical structures in the reconstructed images.
The combined PET/CT scanner, introduced by Townsend and co-workers in 2000 [11], overcomes this problem by providing precisely co-registered anatomical and functional images in a single multimodal imaging session. Commercial versions of this device, which first appeared in 2001, comprise separate PET and CT scanners with a common scanning bed, placed in tandem. After injection with a tracer and an appropriate uptake period, the patient is positioned on the bed and undergoes a spiral CT scan, followed immediately by a PET scan.
2.5. COMPUTED TOMOGRAPHY BASED ATTENUATION CORRECTION
Prior to the introduction of PET/CT, the attenuation correction in PET was typically based on transmission measurements made with one or more rotating positron (typically 68Ge) or single photon (typically 137Cs) emitting
sources prior to the PET emission scan. The advantages of PET/CT are that the transmission data can be acquired very quickly in a spiral CT scan, thus improving patient comfort and throughput, and that the transmission data are unaffected by radioactivity within the patient. A further advantage is that CT provides essentially noiseless attenuation correction factors. Since attenuation coefficients are energy dependent, attenuation correction factors derived from a CT scan must be scaled to account for the difference in attenuation of the X ray beam (Eª 70 keV) and the energy of annihilation photons (511 keV).
Several practical problems need to be considered when using a CT based attenuation correction:
(a) The CT scan duration is very short (a few seconds) compared with the PET scan duration (a few minutes). This can result in artefacts in the attenuation corrected PET image due to mismatch between the CT data and the average attenuation distribution during the PET scan because of internal (e.g. breathing) or external patient motion.
(b) The scaling algorithms used to convert CT attenuation factors to values appropriate for 511 keV photons account correctly for the different properties of soft tissue and bone, but are not designed for other materials such as CT contrast agents. Attenuation correction based on CT in the presence of a CT contrast agent can therefore result in the application of invalid attenuation correction factors and an erroneous reconstructed image.
(c) There is an increase in the effective dose to the patient with CT as compared with a transmission source.
(d) There is a need to have a procedure to ensure that the CT data are properly registered with the emission.
3. CLINICAL APPLICATIONS OF PET/CT
3.1. INTRODUCTION
In the 1970s, PET scanning was formally introduced to the medical community. At that time, it was seen as an exciting new research modality that created possibilities through which medical researchers could watch, study and understand the biology of human disease. In 1976, the radiopharmaceutical [18F]2-fluoro-2-deoxyglucose ([18F]FDG), a marker of sugar metabolism with a
half-life of 110 min, enabled tracer doses to be administered safely, with low radiation exposures, to patients. The development of radiopharmaceuticals such as FDG made it easier to study living beings, and set the groundwork for more in-depth research into using PET to diagnose and evaluate the effect of treatment on diseases in humans.
During the 1980s, the technology that underlies PET advanced greatly. Commercial PET scanners were developed that gave more precise resolution and images. As a result, many of the steps required for producing a PET scan became automated and could be performed by a trained technician and an experienced physician, thereby reducing the cost and complexity of the procedure. Smaller, self-shielded, cyclotrons were developed, making it possible to install cyclotrons at more locations.
Over the last few years, the major advance in this technology has been the combining of a PET scanner and a CT scanner in one device. Modern PET/CT scanners allow studies to be carried out in a shorter amount of time but still provide more diagnostic information.
Positron emission tomography and conventional nuclear imaging are both diagnostic radionuclide imaging techniques, and involve the use of radio-pharmaceuticals (radio-pharmaceuticals labelled with a radioactive isotope). These radionuclides can be localized by a variety of physiological or pathological processes using sophisticated imaging systems. Unlike conventional imaging techniques (diagnostic X rays, CT, magnetic resonance imaging (MRI) and ultrasound), which provide predominantly anatomical information, radionu-clide imaging provides functional information on metabolic activity in physio-logical or pathophysio-logical processes and only limited anatomical information. The detection of an abnormal lesion with these modalities is based on the differ-ential radionuclide uptake within the lesion and in the surrounding tissues. Whether or not a lesion can be detected is related to the degree of radionuclide avidity, the size of the lesion and the background radioactivity.
approaches and could, in theory, detect pathological process still invisible to classical imaging techniques. Where classical imaging techniques provide information about the structure and localization of lesions, PET scanning is used, as a complementary tool, to detect greater or lesser radiopharmaceutical uptakes and to characterize the function, metabolism, biochemical processes and blood flow of organs.
To reach this goal, a positron emitter is combined with a biochemical substance, active in the tissues. This is the case for the glucose analogue, which becomes [18F]FDG when combined with the radioisotope 18F. FDG-PET
imaging in cancer is based on the property of increased glucose uptake into several malignant cell types and glycolysis within them. FDG, as a glucose analogue, undergoes glycolysis within tumour cells and is converted to FDG-6-phosphate intracellularly. However, in all tissues except those of the liver, FDG-6-phosphate is only slowly metabolized and is ‘trapped’ within the cell; hence its uptake becomes proportional to the glycolytic rate at tissue level.
[18F]FDG is the most commonly used radiopharmaceutical in PET, since
its half-life of 110 min allows commercial distribution as far as a travelling time of two to three hours away from production sites. Once in the body, FDG emits positrons, leading to the release of photons that are detected by PET scanners and the production of an image, to be interpreted by a nuclear medicine specialist. For other isotopes with much shorter half-lives (ranging from 2 min for 15O to 20 min for 11C), on-site production is required, typically using
biomedical cyclotrons.
The determination of a positive result depends on the comparison between a specific region and the adjacent ‘normal’ regions. However, certain regions of the body are known to be physiologically glucose-avid. Therefore, the categorization of a region with augmented uptake is a very difficult process, based on a careful inspection of the ROI, contrasting the supposed lesion with the adjacent tissue. The difficulty of standardizing the reading of PET examina-tions explains why reported sensitivity and specificity may show such variaexamina-tions for the same indication. It is therefore of the utmost importance that PET scanners be checked on a regular basis to ensure proper scanner performance.
Owing to clearance of the tracer, the SUV obtained depends on the time between injection and imaging, and this may explain why reported SUVs vary considerably for the same indication.
Most frequently, clinical PET is used for the detection of lesions, and images are qualitatively assessed. It has been suggested that both attenuation corrected and uncorrected images should be used for lesion detection. While the need for attenuation correction for lesion detection remains debatable, it is certainly required in quantitative measurements of lesion uptake.
In a stand-alone, dedicated PET scanner, about 1 h is required to complete the emission and transmission acquisitions from skull base to thigh. The recent development of the faster scintillating crystals LSO and GSO as well of PET/CT systems has reduced total scanning times to less than 30 min.
The lack of anatomical detail in the PET images requires that the inter-pretation is usually made along with anatomical information obtained from CT or MRI. The introduction of hybrid machines, combining PET and CT scanners was aimed at overcoming this major limitation of PET. In the recently developed PET/CT system, a CT scanner is combined with a PET imager, typically in the same gantry. The CT acquisition is performed first, followed by PET acquisition. This set-up allows co-registration of PET data and CT data, producing fusion images with combined functional and anatomical details. In addition, attenuation correction is based on CT data, thereby reducing the total scanning time to less than 30 min. It has been proposed that PET/CT can improve PET images through fast and accurate attenuation correction, improve localization of abnormalities detected in PET, improve radiotherapy and surgery planning, improve evaluation of therapy outcome by localizing regions of oedema and scarring, and that it can produce the highest quality PET and CT information with the least inconvenience. The costs related to the acquisition and maintenance of a PET/CT scanner may be higher than those of a stand-alone PET scanner, but they may be outweighed by their potential for producing diagnostically superior images and for reducing scan time, thus allowing higher patient throughput.
3.2. ONCOLOGY
Oncology remains by far the largest application of PET scanning [12], mostly in the staging/restaging phase, but in some cases also in the diagnostic process. Lung cancer was the first application, and PET is used for malignancy diagnosis of solitary pulmonary nodules (SPNs), for which there is evidence of diagnostic efficacy up to diagnostic applications based on the existence of a pre-test probability and a likelihood ratio, allowing the computation of a post-test probability. Moreover, a post-post-test probability threshold for cost effec-tiveness is provided by economic models [13]: evidence is supportive for the use of PET. In non-small-cell lung carcinoma (NSCLC), there is also evidence of diagnostic accuracy and that adding PET to CT is cost effective.
In lymphomas, there is evidence in the initial staging and recurrence diagnosis (involvement of lymph nodes and extralymphatic localization). There are also studies supporting the use of PET to evaluate possible treatment changes in patient management [14]. For residual mass evaluation, there is clinical evidence up to the diagnostic evaluation level, because PET contributes to medical decisions on follow-up strategy. For prognosis and evaluation of response to treatment, there is evidence of diagnostic accuracy, including the determination of sensitivity and specificity.
In head and neck cancers, PET is used to diagnose occult primary tumours suspected from cervical lymph node metastasis when clinical exami-nation, panendoscopy with biopsy and/or conventional imaging modalities (CT/MRI) have failed to identify a primary tumour. In these applications, there is evidence of diagnostic accuracy, including the determination of sensitivity and specificity when occult primary tumours may be suspected from a single metastatic site outside the cervical lymph nodes following an unsuccessful initial diagnostic work-up, as well as when local or regional therapies are considered as part of a treatment plan for a single metastatic carcinoma outside the cervical lymph nodes [15].
In colorectal cancer, hierarchy levels of diagnostic efficacy of PET are established for the initial diagnosis and staging, as well as for detection and localization of local, hepatic and extrahepatic recurrences. The evidence of diagnostic efficacy includes changes in patient management and therapeutic decisions. Moreover, there is evidence for the cost effectiveness of PET in this application [16].
In breast cancer, there is evidence of diagnostic inaccuracy for the use of PET in diagnosing patients referred for breast biopsies with abnormal mammograms or palpable breast masses, as benefits do not appear to outweigh risks. On the other hand, there is evidence of diagnostic accuracy including the determination of sensitivity and specificity, and evidence seems supportive for the use of PET, for staging/restaging, i.e. detection of distant metastatic disease if there is a clinical suspicion that metastatic disease is high at initial diagnosis or when recurrent breast cancer is suspected [18]. For the detection of locoregional recurrence, there is evidence of diagnostic accuracy, including the determination of sensitivity and specificity.
In oesophageal cancer, there is evidence of diagnostic accuracy including the determination of sensitivity and specificity, for staging, i.e. staging of lymph nodes (locoregional, distal or all lymph nodes) and distant sites other than lymph nodes. Evidence, although limited, seems supportive for the use of PET.
For restaging after patients who are eligible for curative surgery have received neoadjuvant therapy (comparative with initial staging PET results), there is evidence up to diagnostic evaluation based on diagnostic accuracy and prognosis.
In thyroid cancer, there is evidence of diagnostic accuracy including the determination of sensitivity and specificity, for restaging, i.e. detection of the recurrence of differentiated thyroid cancer in previously treated patients with elevated biomarkers not confirmed by whole body 131I scintigraphy [19]. The
same situation prevails for the detection of recurrence of medullary thyroid cancer in previously treated patients with elevated biomarkers not confirmed by other imaging methods.
3.3. CARDIOLOGY
Cardiac PET has been gaining great clinical acceptance in the assessment of myocardial perfusion using [13N]ammonia and 82Rb, as well as myocardial
viability using FDG. With the advent of multiple slice CT PET/CT scanners (at present 64 slice CT PET/CT), PET/CT is poised to play an important role in the assessment of coronary obstruction, using CT angiography (CTA) along with myocardial perfusion PET [20]. This would have great potential in identifying patients eligible for revascularization and monitoring the results of such a procedure, yielding a ‘one stop shop’ with a PET/CT/CTA scanner. Furthermore, 82Rb does not require access to a cyclotron, as it can be produced
by an on-site generator.
providing correct diagnoses in virtually all patients. The integration of PET and multidetector CT technology provides a potential opportunity to delineate the anatomic extent and physiological severity of coronary atherosclerosis and obstructive disease in a single setting. It allows detection and quantification of the burden of the extent of calcified and non-calcified plaques, quantification of vascular reactivity and endothelial health, identification of flow-limiting coronary stenoses, and, potentially, identification of high risk plaques in the coronary and other arterial beds. Together, by revealing the degree and location of anatomic stenoses and their physiological significance, as well as the plaque burden and its composition, integrated PET/CT can provide unique information that may improve non-invasive diagnosis of CAD and the prediction of cardiovascular risk. In addition, this approach expands the diagnostic capability of nuclear cardiology to include atherosclerosis and may facilitate further study of the progression of atherothrombosis and its response to therapy, thus allowing assessment of subclinical disease.
Thus far, the lack of widespread availability of PET scanners and radiotracers, their high cost, the limited amount of data supporting their use, and reimbursement problems have all contributed to the limited clinical acceptance of this imaging technology. However, widespread clinical acceptance by the imaging and clinical communities is unlikely to occur until more data documenting that PET can actually realize its clinical promise become available. Although data obtained more than 15 years ago supported the superiority of PET compared with SPECT for diagnosing CAD, it is unclear whether this superiority is still apparent at the present time because of major advances in SPECT instrumentation and imaging protocols [21, 22].
3.4. NEUROLOGY
Since glucose is the primary source of energy for cells in the brain, the radiopharmaceutical FDG, a glucose derivative, helps to create a map of normal versus abnormal brain function, as imaged in a PET scan. Distinctive patterns of glucose metabolism assist physicians in accurately diagnosing patients and treating them appropriately.
lack of any other clinical, biochemical or genetic marker for Alzheimer’s disease in living patients makes these findings unique and of clinical relevance.
Low grade gliomas (LGGs) account for 30–40% of all gliomas and are primarily treated with surgery. Since both timing and use of other oncological treatments in LGGs are a matter of controversy, there has been a constantly increasing demand to characterize these often slowly growing neoplasms with functional imaging methods, such as PET. Positron emission tomography yields information on growth rate and heterogeneity of LGGs and is especially useful for follow-up purposes, as metabolic changes tend to precede structural changes detected with imaging methods based on structures. Furthermore, for planning of LGG surgery or radiotherapy, co-registration of functional images with CT and MRI is invaluable. This is increasingly performed with the new generation of hybrid scanners with integrated PET and CT [24].
For pre-surgical evaluation of refractory epilepsy, there is some evidence of diagnostic accuracy. Evidence, although limited, seems supportive for the use of PET. However, this is a rare indication [25].
4. QUALITY ASSURANCE IN PET/CT
4.1. INTRODUCTION
In order for QC tests of PET and PET/CT scanners to be effective, operational and technical aspects of their use need to be governed by a quality management system (QMS). Management aspects also need to be included that ensure that all procedures related to image quality and radiation dose to patients are properly addressed and documented. Possible problems and malfunctions also need to be addressed. The QMS should include several basic components:
(a) A clear definition of responsibilities for the defined actions regarding quality assurance (QA);
(b) A series of documents illustrating correct use of the imaging equipment, and of test objects, phantoms and sources, detailing test modalities and procedures to follow in the case of abnormal results that do not correspond to what is expected or in the case of malfunction.
(d) Proper training of all the staff involved in the correct and safe use of the equipment, its QC procedures and all aspects pertaining to QA.
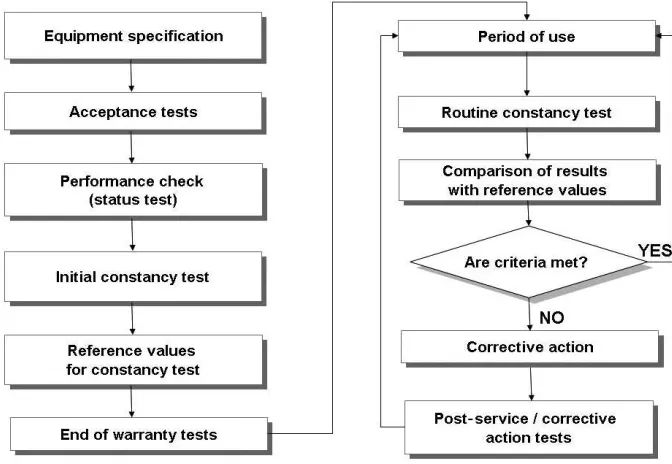
The QMS control life cycle regarding medical imaging equipment is described in Fig. 10, which is based on the IEC 61223-1 standard [26]. On this basis, it should be clear that QA and QC do not merely consist of simply performing routine tests during the operation of the equipment. A proper QMS should also include the specification and acquisition phases, and thus starts well before the actual installation and operation of the equipment.
In particular, the process of specification and acquisition should involve a multidisciplinary team of professionals in order to properly define the needs of an institution and prepare the technical specifications that the proposed equipment should meet in order to ensure satisfactory results.
In the case of PET or PET/CT scanners, the team of professionals should include at least the following:
(a) A nuclear medicine and radiology physician;
(b) A medical physicist with expertise in diagnostic radiological physics, especially CT;
(c) A medical physicist with expertise in nuclear medicine;
(d) A medical physicist specializing in radiation oncology physics (if the PET/ CT images are to be used for radiation treatment planning);
(e) Facilities management staff; (f) An architect;
(g) A radiation protection expert;
(h) A person qualified in radiochemistry or radiopharmacy (in the case of in-house production of radiopharmaceuticals);
(i) A nuclear medicine technologist, also trained in CT technology; (j) A hospital management expert.
The specification document should include information regarding acceptance and end-of-warranty testing, so that the vendor understands the requirements and schedule. In addition, the manufacturer should ensure that a service engineer is present during acceptance and end-of-warranty testing to correct any problems encountered by the medical physicists doing the testing. Once the equipment has been adequately specified, identified and purchased, the equipment must be properly installed. Acceptance tests shall then be performed, preferably by a qualified independent physicist, in order to verify that the scanner meets all the requirements in terms of performance and operational parameters.
Some confusion exists about the differences between QA and QC. Quality assurance refers in general to the concept of taking actions to ensure that delivered products or services meet performance requirements. The QMS is the programme that controls how quality is maintained and ensured throughout an organization. Quality assurance may encompass various aspects such as quality of medical care based on specific indicators, for example:
— The infection rate in the hospital;
— The satisfaction of patients with their care; — The credentials of the medical staff;
— Any continuing education of the hospital staff.
The QMS defines what steps will be taken to ensure that the desired level of care is maintained and how these will be documented. Quality control for PET/CT applies to a specific set of measurements focused on monitoring the performance of installed imaging equipment relative to image quality and dose on a periodic basis, for example, monthly.
in international and national standards, such as the IEC and NEMA publica-tions [27, 28],as well as other relevant documents referenced in this publi-cation. To establish reference values and action levels to compare with the results of routine tests, an initial series of QC tests must be performed immediately after completion of the acceptance procedures. During the operational life cycle of the equipment, regular QC tests should be performed as described in Section 4 of this publication and the other sources of information indicated above.
4.2. INTRODUCTION TO ACCEPTANCE TESTING
Acceptance testing of medical imaging equipment serves several purposes, it:
(a) Ensures that equipment (both hardware and software) performs to the manufacturer’s specifications prior to final payment for the equipment; (b) Establishes the baseline performance of the equipment to which future
quality tests will be compared;
(c) Provides data that can give guidance in the determination of the optimal operating parameters for routine use;
(d) Ensures that the imaging equipment meets regulatory requirements for radiation safety.
In addition to the traditional acceptance tests, a second set of tests (the same as the acceptance tests) should be carried out about one month before the end of the warranty period. The equipment should perform similarly to its performance during acceptance testing. If not, the manufacturer should be advised immediately and be required to make the appropriate calibrations and modifications to ensure that the system again meets the manufacturer’s specifications.
4.2.1. Defining acceptance testing
The American Association of Physicists in Medicine (AAPM), in its report by the Imaging Committee Task Group 2 [29], defines acceptance testing as follows:
“The acceptance test is a series of measurements performed by the clinical medical physicist to verify that a CT system conforms to vendor technical specifications or to specifications mutually agreed upon by buyer and vendor. Often a proviso for acceptance testing is written into the bid request which indicates who will do the testing, what tests will be performed, and what level of performance is acceptable to the buyer.”
Modern medical imaging systems provide more potential combinations of operating conditions than can be practically tested. Acceptance testing must acquire sufficient data to adequately characterize system performance. Conse-quently, it is essential to review clinical needs, scanner specifications and design principles, to determine the most important performance variables that should be tested, and to include only those that could affect important performance characteristics.
It is important to select a short list of four or five standard scanning conditions that are the most relevant to clinical imaging with the system. For CT applications, this will most often include CT of an adult’s head and body, and paediatric body imaging. If thin slice imaging (e.g. 1 mm slice imaging) is not anticipated for PET/CT imaging, then thicker slice imaging modes should be the focus of acceptance testing. If all scans are in helical mode, then acceptance testing should emphasize helical mode data acquisition.
There are two other tests that fall under the broad heading of acceptance tests: end-of-warranty tests and post-service tests.
4.2.1.1. End-of-warranty tests
notification) of such failures sufficiently in advance of the expiry of the warranty period, to allow for repairs to be performed and also for subsequent testing by the medical physicist to confirm that the problem has been resolved. The intention to conduct end-of-warranty tests should be included as part of the purchasing agreement.
4.2.1.2. Post-service tests
When any service is performed on medical imaging equipment, there is the potential that significant changes may occur to the hardware or software. Such changes may result from calibration of the equipment, repair or replacement of components, or upgrades to the system. Consequently, it is necessary to carry out tests after equipment service and before the equipment is placed back in clinical use.
The post-service tests do not need to cover all of the equipment aspects evaluated in the initial acceptance tests. For example, if an X ray tube is changed, one needs to focus the acceptance testing on the radiation producing aspects of the equipment. In this case, one should check whether the radiation exposure level produced is the same as that prior to replacement. If not, one should check whether the kVp calibration has changed, if appropriate filtration has been replaced by the service engineer, or if the radiation dose profile (pre-patient collimator width) is the same as before. Because it is not affected by a change in the X ray tube, there is no need to evaluate the image display, the hard copy printing or any other parts of the system that are not impacted by such a change.
4.2.2. Responsibilities for acceptance testing
Acceptance testing is a very important part of the acquisition process for medical imaging equipment. PET/CT scanners combine sophisticated features of two complex imaging modalities and must be properly maintained and monitored to ensure their correct operation.
with and work together with a medical physicist qualified in radiation therapy who is familiar with the application of the data for treatment planning purposes. In order to ensure that the scanner performance truly meets the customer’s specifications, it is strongly advisable for the acceptance tests to be performed by a qualified medical physicist who is independent of the vendor.
Qualified medical physicists are usually recognized by their professional organizations through certification and continuing education in clinical medical physics. Qualified medical physicists evaluating PET/CT systems must be recognized for their competence in nuclear medicine physics and diagnostic medical imaging. The qualified medical physicist must be familiar with:
— The principles of radiation protection;
— The guidelines of national radiation protection organizations;
— The laws and regulations governing the use of the equipment being tested;
— The function, optimal clinical uses and performance specifications of the imaging equipment;
— Calibration processes and limitations of the measurement instruments; — The techniques used for testing performance.
The qualified medical physicist(s) is/are responsible for acceptance testing and annual testing of the equipment, and must review, interpret and approve all data, as well as summarize the tests performed and provide conclu-sions. Even if the tests are performed by an independent physicist, the responsible physicist from the purchasing institution must be present during the tests. The test report should be signed by the responsible medical physicist(s) of the purchasing institution, and, if applicable, by the physicist who performed the tests.
While the medical physicists are responsible for acceptance testing of the equipment, it is recommended that a qualified service engineer from the equipment manufacturer be on-site during this testing. This will allow for corrections of problems as they are found and reduce the overall amount of time required for acceptance testing.
4.2.3. Sequence of acceptance tests
Appendices I and II list the acceptance tests recommended for the different components of a PET/CT imaging system, along with the equipment needed, the values measured and the acceptance criteria, where appropriate.
4.3. QUALITY CONTROL
Quality control helps to ensure that the equipment performs, throughout its useful life, at the levels specified by the manufacturer and measured during the acceptance testing process and that there is ongoing compliance with regulatory requirements for radiation safety.
4.3.1. Post-service testing
Post-service testing is an important part of the QA and QC programme and is always required when there are changes made to the equipment that could affect its performance. When there are changes to the equipment, the functions of the equipment potentially affected by these changes must be evaluated, to ensure that the equipment once again performs at the levels determined during acceptance testing. Many types of changes will require post-service testing, some of which are not obvious. Equipment calibration may result in changes to many aspects of the imaging equipment. Software upgrades can affect X ray tube output, system sensitivity, image quality and other aspects of the function of the system. Software upgrades frequently require that all acceptance tests be carried out, since such upgrades can have an impact on virtually every aspect of the system.
As an example, when an X ray tube is replaced, it is essential to determine if the patient dose is similar to that used previously. If the dose has changed significantly, then the reason why this has occurred must be determined. Is the kVp value the same? Did the service engineer replace the appropriate aluminium filtration unit in the X ray beam?
Whatever is the case, the service engineer must ensure that the output is similar to that prior to the tube replacement. Consequently, it is beneficial if these tests can be carried out while the service engineer is still on the site.
4.3.2. Equipment required for quality control testing