Mitigation of GHGs from Energy and Forestry Sector in Indonesia
1Agus Sugiyono, BPPT
Dadang Hilman, State Ministry of Environment
1. Introduction
1.1. Objectives of the Project
The objectives of project “Establishment of a Methodological Framework for Climate Change Mitigation Assessment” was elaboration of a new methodology for analyzing Greenhouse Gas (GHG) mitigation options in energy and forest sector through integration of the two sector using MARKAL model.
1.2. Institutional Working Group
The project was established within the framework of scientific cooperation between State Ministry for Environmental, Indonesia and United Nation for Environment Programs (UNEP) - RISO. The working group for this project has been organized on an inter-institutional concept and coordinated by State Ministry for Environment. The active participating institutions are:
§ Agency for the Assessment and Application of Technology (BPPT),
§ State Electricity Company (PLN),
§ Directorate General for Electricity and Energy Development
§ Center for Forest Research, Dept. of Forestry
§ Development and Center for Environmental Studies - Agricultural Institute of Bogor. This project consists of two working groups, technical working group for energy sector, and technical working group for forestry sector.
2. Methodology and Study Approach 2.1. Overview
Models tools for this analysis is use a least cost energy supply model call MARKAL. MARKAL is a large scale model intended for long term analysis of energy systems at the level of a province, state, country or region. It was develop in early 1980 by a consortium of researchers from more than a dozen countries, all of them is IEA members and working within the Energy Technology System Analysis Programme (ETSAP). Many modification already several time from the mainframe era to current PC computer era, the last modification progress is rewritten in GAMS with some additional ability. Even Indonesia doesn’t active in the ETSAP but Indonesia keep going used MARKAL as main tools for analyze energy system within country with collaboration with KFA, Germany, ABARE Australia also Decision Ware, US.
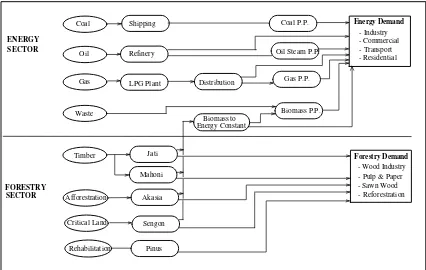
In this study, energy and forestry sector analyzed together using MARKAL model in term of balancing GHG concentration at the atmosphere. For energy system all activities from mining extraction, processing, transport of energy, conversion, and up to energy demand included in the analysis and for forestry sector include all various forestry
1
management for selected plantation species, harvesting and milling. Figure 1 shows the schematic of energy and forestry link model. All activities that include into “Reference Energy System” (RES). Unit activity of the forest used here is distinguished as to different unit first use meter cubic of product for the timber forestry and another one use hectare land used for the reforestation activities.
Figure 1: Schematic of Energy and Forestry Link Model
The model has an objective function to minimize total cost of energy supply and forest production or carbon sink. The mathematical formulation of the model can be presented as:
d Fij = Cost of forest production / carbon sink
In this study we develop 7 scenarios to analysis the impact of mitigation strategies. - Baseline Scenario (BAU), without included mitigation technology into the model
- CO2 Emission Reduction from Energy Energy Sector :
- ABAT1 : The years 2005 and 2020, are chosen as the future years, for which CO2 reduction targets of UNEP-RISO are assessed. The targets specified for the two reference years: 12,5 % reduction in 2005 and 25 % in 2020 for the first abatement case.
- ABAT 2 : Analogously by requesting for a 15 % reduction in 2005 and a 30 % reduction of 2020.
- Enhanced CO2 Uptake from Energy Forestry Sector
- FOR1 : The year 2000 and upward CO2 uptake is increase by 5 % than BAU scenario - FOR2 : The year 2000 and upward CO2 uptake is increase by 10 % than BAU scenario - FOR3 : The year 2000 and upward CO2 uptake is increase by 20 % than BAU scenario - FOR4 : The year 2000 and upward CO2 uptake is increase by 30 % than BAU scenario Energy sector analysis is based on result of the “Environmental Impacts of Energy Strategies for Indonesia”, 1993 study, as a joint study between BPPT, Indonesia and KFA, Juelich, Germany. However, recently several data and calculations have been updated, for examples cost estimation, economics growth rate etc. While the forest data and mitigation options in forestry sector were established trough an comprehensive study on Java and Jambi forest situation by Centre for Forest Research, Dept. of Forestry, and Development and Centre for Environmental Studies - Agricultural Institute of Bogor.
2.2. Study Approach
The approach were used on implementation of this project were:
§ the estimation of reasonable scenario for the future economic development
§ the provision of detail sectoral and regional baseline energy demand projections based on the economic scenario
§ establishment a baseline energy supply mix scenario
§ mitigation options on energy and forestry sectors
§ integration between energy and forest mitigation scenario
§ calculation of the macro economic for mitigation assessment.
3. Social and Economical Aspects
Indonesia is the world's fourth most populated country with a population of 200 millions but, more than 60 % of the population lives in Java Island covered only 7 per cent of the land area of Indonesia. Through this condition, Java became the most populated area with density is roughly 850 peoples per square km. The population in 1990-1995 can be seen in Table 1. The declining of population growth rate is followed by an improvement of the wealthy of the people and successfully of the birth control program.
Table 1: Indonesian Population (in thousand)
YEAR POPULATION URBAN RURAL
1990 179.250 55.434 123.816
1991 182.223 55.615 126.608
1992 185.259 55.792 129.467
1993 188.359 55.962 132.397
1994 191.524 56.127 135.397
1995 194.755 56.277 138.478
Stipulated by government deregulatory, market oriented policies, manufacturing and modern service sectors are making up an ever-greater proportion of Gross Domestic Product (GDP). Growth and structural change in the economy are being driven by private sector investment, both domestic and foreign. Industrialization and urbanization are concentrated in Java; while, the others islands and regions remains dependent on agriculture and its related activities.
As a matter of fact, in the end of fiscal year 1997, the Indonesia economics slump following extra ordinary of the decreasing rupiah’s exchange rate to foreign currencies from 2475 rupiah per US Dollar to average of 8000 rupiah per US Dollar. It is predicted that Indonesia’s economics will grow by minus 4 per cent per annum in the fiscal year 1998, but probably step by step will be normalized to “realistic” figures during next 1-2 years by. This project was not able to calculate the actual condition above.
The development of the growth rates GDP and population until the end of FYDP XI can be seen in Table 2. The GDP grows in six periods with an average growth of 5.9 % per year and the population grows with an average growth of 1.25 % per year.
Table 2: GDP and Population Growth in Indonesia During FYDP VI until FYDP XI High Scenario
1994-2023 VI-XI 5.9 1.25 4.57
4. Energy Reserves in Indonesia
As Indonesia have various types of energy, it is very important to analyst the reserves and utilization of the energy for long time periods, in order to fulfill the domestic energy demand in the future.
Indonesia were granted abundant and various energy sources as well as fossil energy and renewable energy. The total of proven and potential crude oil and condensate reserves in 1994 is 10,414.42 million barrels. Oil, which at present dominates on the energy consumption, due to very limited reserves, should be substituted and replaced with other sources of energy.
Indonesia’s natural gas resources in 1994 are estimated 266 trillion cubic feet, in which 114.8 trillion cubic feet is classified as proven and probable. Since the proven reserves of natural gas are bigger than crude oil, considerable amounts of natural gas for domestic supply are available.
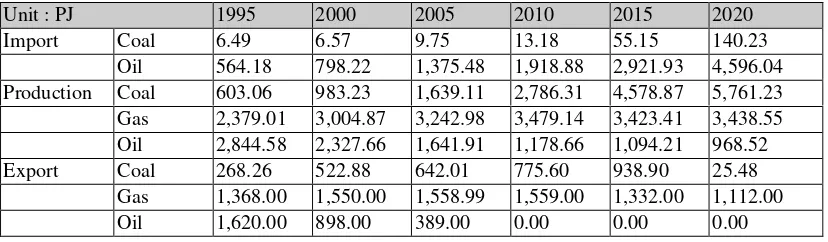
The total Indonesia coal resources in 1996 is about 38,720 million tones, in which 64 per cent is located in Sumatra and 35,4 per cent is located in Kalimantan, while the rests are spread in Jawa, Sulawesi, and Irian Jaya. Indonesia has four type of coal, i.e. anthracite, bituminous, bituminous, and lignite. However, only anthracite, bituminous, and sub-bituminous, has utilized Indonesia.The crude oil, natural gas, and coal import, production, and export is shown in Table 3.
power investments. Total potential of geothermal energy reserve has been estimated to be 16.1 GW, while Java and Bali (interconnection line) have nearly half of the reserves.
Table 3. The Commercial Energy Import, Production, and Export in Indonesia
Unit : PJ 1995 2000 2005 2010 2015 2020
Import Coal 6.49 6.57 9.75 13.18 55.15 140.23
Oil 564.18 798.22 1,375.48 1,918.88 2,921.93 4,596.04 Production Coal 603.06 983.23 1,639.11 2,786.31 4,578.87 5,761.23 Gas 2,379.01 3,004.87 3,242.98 3,479.14 3,423.41 3,438.55 Oil 2,844.58 2,327.66 1,641.91 1,178.66 1,094.21 968.52 Export Coal 268.26 522.88 642.01 775.60 938.90 25.48
Gas 1,368.00 1,550.00 1,558.99 1,559.00 1,332.00 1,112.00 Oil 1,620.00 898.00 389.00 0.00 0.00 0.00
Solar energy has been developed in Indonesia, especially for rural and remote area households that probably for next 10 years were not been electrified yet. Other renewable energy, i.e. wave energy, wind energy etc., is still under consideration and was not utilize yet as a commercial projects.
5. Projection of Baseline Energy Demand and Supply
In the baseline scenario, which is based on business as usual (BAU) scenario; there are no limitation of the GHG emission and introduction of GHG mitigation options.
Table 4: Baseline Primary Energy Supply
Type of Primary Energy Supply (PJ/year)
Energy 1995 2000 2005 2010 2015 2020
Biomass 1,113.11 1,209.59 1,301.69 1,425.77 1,540.76 1,688.83 Hydro/Geothermal 188.78 275.81 475.96 544.17 538.04 520.65 Coal 341.27 466.91 1,006.84 2,023.90 3,695.11 5,875.98 Gas 1,131.54 1,653.99 1,969.51 2,320.29 2,659.58 3,126.78 Oil 1,668.23 2,028.76 2,342.87 2,697.39 3,447.97 4,764.33 TOTAL 4,442.96 5,635.09 7,096.85 9,011.52 11,881.46 15,976.58
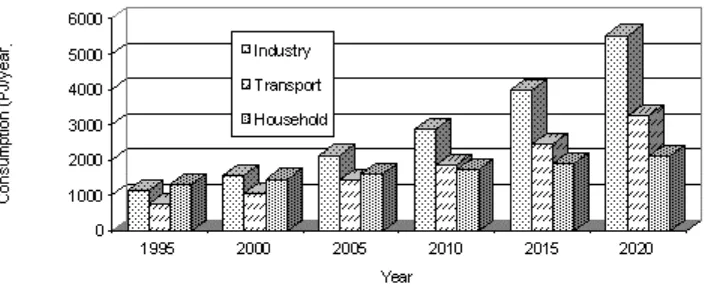
The utilization of oil grows during FYDP VI to FYDP XI on average at a rate of 4.3 per cent per year; this low growth due to oil has to diversify to coal & gas, and the availability of oil reserves, if there no new oil field found in oil exploration. It is predicted that the use of natural gas for LNG will reduce, then the potential of natural gas will be domestic energy supply option.
Figure 2: Final Consumption by sector in 1995-2020 (FYDP VI-XI)
The electricity sector plays a key role for the further development of the Indonesian economy. The development of the electric power plant capacities by different plant types is shown in Table 5.
Table 5. Baseline Electricity Generation Capacity
Electricity Generation Capacity (GW/year)
1995 2000 2005 2010 2015 2020
Biomass 0.23 0.23 0.21 0.21 0.21 0.21
Coal Steam 3.54 4.45 12.09 26.30 48.02 74.81
Diesel 9.37 8.40 7.37 3.62 3.61 3.61
Gas CHP 0.00 0.79 0.94 0.94 0.94 0.94
Gas Comb. Cycle 4.21 7.67 7.67 10.95 12.74 22.94
Gas Turbine 2.72 2.63 4.82 5.63 7.84 6.84
Geothermal 0.39 0.44 0.43 0.37 0.29 0.04
Hydro 3.91 5.97 9.54 10.84 10.84 10.84
Oil Steam 2.63 2.22 1.09 0.54 0.02 1.67
T o t a l 27.00 32.8 44.16 59.4 84.51 121.9
Coal is Indonesia’s cheapest primary energy resource up to a certain level of use, ash disposal or air pollution problem can be occurs. However, using more efficient technology and clean technology can mitigate the problem.
6. GHG Emissions
The CO2 estimate is simply based on the quantity and the carbon contents of the
individual energy carriers making up the total domestic primary energy consumption of Indonesia. 100 % of the carbon content of primary energy is assumed to be converted to CO2.
Due to the increasing share of coal in total primary energy and due to a high specific carbon content as a mayor source of CO2, the share of CO2 emission in FYDP XI is 54 %
Source: BPPT-KFA, Environtmental Impacts of Energy Strategy for Indonesia, 1993.
Figure 3. The Share of CO2 Emission Produce by Type of Energy
7. Mitigation Scenario
7.1. Mitigation Option in Energy Sector
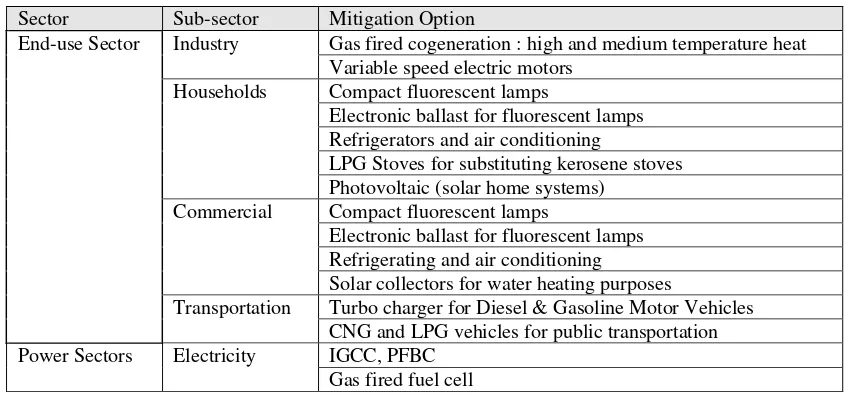
This chapter described the mitigation options will be introduced in the energy consumption sector such as, household, industrial, commercial, and electric power generation sectors. Table 6 shows the sectoral mitigation options.
Table 6: Mitigation Options in Energy Sector
Sector Sub-sector Mitigation Option
End-use Sector Industry Gas fired cogeneration : high and medium temperature heat Variable speed electric motors
Households Compact fluorescent lamps
Electronic ballast for fluorescent lamps Refrigerators and air conditioning
LPG Stoves for substituting kerosene stoves Photovoltaic (solar home systems)
Commercial Compact fluorescent lamps
Electronic ballast for fluorescent lamps Refrigerating and air conditioning
Solar collectors for water heating purposes
Transportation Turbo charger for Diesel & Gasoline Motor Vehicles CNG and LPG vehicles for public transportation Power Sectors Electricity IGCC, PFBC
Gas fired fuel cell 7.2. Mitigation Options in Forestry Sector
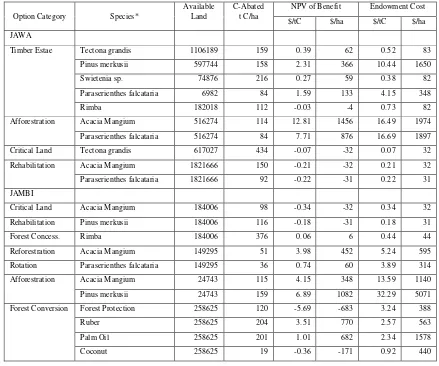
In the study, two forest areas, Java and Jambi, have been derived as study case. There are 11 mitigation options have been defined. The mitigation cost for one ton carbon varies considerable between the options, as described in Table 7.
7.3. Integrated Assessment of GHG Mitigation Options
The study has been progressed by introducing energy linked to the forest. In relation between energy and forestry, analysis of the forest as energy resource and forest as the CO2
Urgency of integration of mitigation options into energy sector modeling are to get brief illustration and understanding about relationship between amount of CO2 reduction
and cost by introduction of such options. Cause forest is predicted only has capability to absorb CO2, this study limited on CO2 reduction only, and not consider to CH4 reduction.
Since the energy sector was an emitter of CO2 (not included CO2 from biomass),
integration between energy and forestry mitigation, principally can not change the amount of released CO2 from energy sector, while forestry sector calculate net emission from
forest sector as CO2 sinker and as emitter.
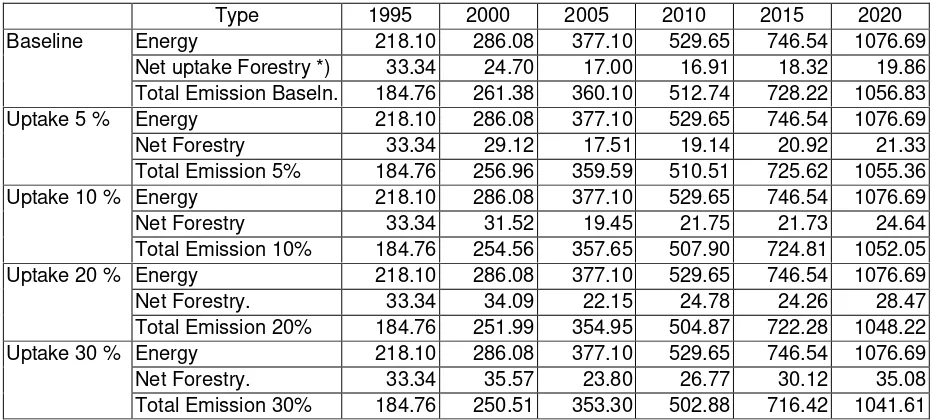
Table 8 illustrates the amount of released CO2 under baseline and mitigation
scenarios of linked energy and forestry sectors. The study is not finished yet and need to extend to cover all regions in Indonesia. As a study case, emission from energy sector is calculated for total Indonesia, while CO2 emission and uptake from forestry sector only
calculate for Java island and Sumatera island.
Table 7. Mitigation Options in Forestry Sector
NPV of Benefit Endowment Cost Option Category Species*
Available Land
C-Abated t C/ha
$/tC $/ha $/tC $/ha JAWA
Timber Estae Tectona grandis 1106189 159 0.39 62 0.52 83 Pinus merkusii 597744 158 2.31 366 10.44 1650
Swietenia sp. 74876 216 0.27 59 0.38 82
Paraserienthes falcataria 6982 84 1.59 133 4.15 348
Rimba 182018 112 -0.03 -4 0.73 82
Afforestration Acacia Mangium 516274 114 12.81 1456 16.49 1974 Paraserienthes falcataria 516274 84 7.71 876 16.69 1897 Critical Land Tectona grandis 617027 434 -0.07 -32 0.07 32 Rehabilitation Acacia Mangium 1821666 150 -0.21 -32 0.21 32 Paraserienthes falcataria 1821666 92 -0.22 -31 0.22 31 JAMBI
Critical Land Acacia Mangium 184006 98 -0.34 -32 0.34 32 Rehabilitation Pinus merkusii 184006 116 -0.18 -31 0.18 31
Forest Concess. Rimba 184006 376 0.06 6 0.44 44
Reforestration Acacia Mangium 149295 51 3.98 452 5.24 595 Rotation Paraserienthes falcataria 149295 36 0.74 60 3.89 314 Afforestration Acacia Mangium 24743 115 4.15 348 13.59 1140 Pinus merkusii 24743 159 6.89 1082 32.29 5071 Forest Conversion Forest Protection 258625 120 -5.69 -683 3.24 388
Ruber 258625 204 3.51 770 2.57 563
Palm Oil 258625 201 1.01 682 2.34 1578
Table 8. Integrated Baseline and Mitigation Scenarios of Energy and Forestry Sectors (million Tons/Annum)
Type 1995 2000 2005 2010 2015 2020 Baseline Energy 218.10 286.08 377.10 529.65 746.54 1076.69
Net uptake Forestry *) 33.34 24.70 17.00 16.91 18.32 19.86 Total Emission Baseln. 184.76 261.38 360.10 512.74 728.22 1056.83 Uptake 5 % Energy 218.10 286.08 377.10 529.65 746.54 1076.69 Net Forestry 33.34 29.12 17.51 19.14 20.92 21.33 Total Emission 5% 184.76 256.96 359.59 510.51 725.62 1055.36 Uptake 10 % Energy 218.10 286.08 377.10 529.65 746.54 1076.69 Net Forestry 33.34 31.52 19.45 21.75 21.73 24.64 Total Emission 10% 184.76 254.56 357.65 507.90 724.81 1052.05 Uptake 20 % Energy 218.10 286.08 377.10 529.65 746.54 1076.69 Net Forestry. 33.34 34.09 22.15 24.78 24.26 28.47 Total Emission 20% 184.76 251.99 354.95 504.87 722.28 1048.22 Uptake 30 % Energy 218.10 286.08 377.10 529.65 746.54 1076.69 Net Forestry. 33.34 35.57 23.80 26.77 30.12 35.08 Total Emission 30% 184.76 250.51 353.30 502.88 716.42 1041.61
- Description : Net Forestry = Uptake - Emission
- CO2 emission from energy sector is calculated for total Indonesia, while from forestry sector only
calculate for Java island and Sumatera island.
Table 9 illustrates the total emission for 30 years between FYDP (five years development period) VI until XI.
Table 9. Total Emission in Indonesia between FYDP VI - XI (30 years) (Million Tons)
Uptake
Item Baseline +5% +10% +20% +30%
Energy 16170.8 16170.8 16170.8 16170.8 16170.8
Net Forestry 650.7 706.8 762.2 835.5 923.4
Total Emission 16821.5 16877.6 16933.0 17006.3 17094.2 Description: Net Forestry = uptake - emission
8. Macro Economic Assessment
The macro economic assessment considers cost related to the CO2 emission
reduction by assessment of the mitigation options. Table 10 illustrates the total cost needs for baseline scenario and CO2 reduction by mitigation's options (abatement 1 and 2).
Table 10. Total Discounted Cost for Energy and Forestry Sectors
Sector Cost (mil. US$) Diff. Emission Diff. Reduct. %
Energy Baseline 225140.25 16935.18
Abat 1 231010.86 5870.61 15198.67 -1736,51 10.25 Abat 2 236711.30 11571.05 14769.57 -2165.61 12.79 Sector Cost (mil. US$) Diff. Net Uptake Diff. Reduct. %
Forestry Baseline 221043.83 853.65
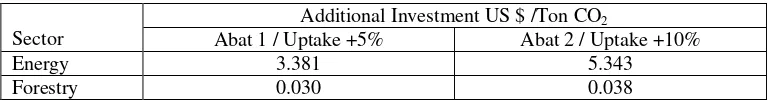
Further calculation from above tables indicates the additional investment need for CO2
reduction as follows.
Table 11. Calculation of CO2 Reduction
Additional Investment US $ /Ton CO2
Sector Abat 1 / Uptake +5% Abat 2 / Uptake +10%
Energy 3.381 5.343
Forestry 0.030 0.038
This result proved that increasing CO2 sink cheaper than CO2 reduction, and increasing of
the target of CO2 reduction will increase the additional cost per ton CO2 reduction.
Reference
1. ---- "Statistical year Book of Indonesia", Central Bureau of Statistic, 1995.
2. ---- "Environmental Impact of Energy Strategies for Indonesia, Final Summary Report", Joint Indonesia/German Research Project on Environmental Impacts of Strategies and Technology Assessment in Indonesia, BPPT-KFA Juelich GmbH, German, May 1993.
3. ---- "The Study on the Response Actions Against the Increasing Emission of Carbon Dioxide in Indonesia, Final Report", Japan Environment Agency–Overseas Environmental Cooperation Center and Ministry of State for Population and Environment, March 1993.
4. ---- "Socioeconomic Impacts of Climate Change and National Response Strategy, Executive Summary, A report of the Regional Study on Global Environmental Issues: Country Study of Indonesia", the Asian Development Bank TA-No: 5463-Regional, State Ministry for the Environment and the Indonesia Forum for the Environment and Pelangi Indonesia, August 1993.
5. ---- "The Potential Socio-Economic Effects of Climate Change in South-East Asia. Final Report", United Nations Environment Programme. M.L.Parry, M. Blantran de Rozari, A.L.Chang and S.Panich editors, 1991.
6. ---- "Energy Strategies, Energy R+D Strategies, Technology Assessment for Indonesia. Optimal Results, Final Results", BPPT-KFA Juelich GmbH, German, January 1988. 7. ---- Second draft "Final Report", Algas Project, Asia Least Cost Greenhouse Gas
Abatement Strategy, State Ministry of Environment assisted by Bogor Institute of Agriculture, Bandung Institute of Technology, Indonesian Association of Agricultural Meteorology, and Yayasan Pelangi, 1997.