Tarun Kushwaha & Venkatesh Shankar
Are Multichannel Customers Really
More Valuable? The Moderating Role
of Product Category Characteristics
How does the monetary value of customer purchases vary by customer preference for purchase channels (e.g., traditional, electronic, multichannel) and product category? The authors develop a conceptual model and hypotheses on the moderating effects of two key product category characteristics—the utilitarian versus hedonic nature of the product category and perceived risk—on the channel preference–monetary value relationship. They test the hypotheses on a unique large-scale, empirically generalizable data set in the retailing context. Contrary to conventional wisdom that all multichannel customers are more valuable than single-channel customers, the results show that multichannel customers are the most valuable segment only for hedonic product categories. The findings reveal that traditional channel customers of low-risk categories provide higher monetary value than other customers. Moreover, for utilitarian product categories perceived as high (low) risk, web-only (catalog- or store-only) shoppers constitute the most valuable segment. The findings offer managers guidelines for targeting and migrating different types of customers for different product categories through different channels.Keywords: customer relationship management, channels, multichannel marketing, retailing
Tarun Kushwaha is Assistant Professor of Marketing, Kenan-Flagler School of Business, University of North Carolina at Chapel Hill (e-mail: [email protected]). Venkatesh Shankar is Professor of Marketing and Coleman Chair in Marketing, Mays Business School, Texas A&M Uni-versity (e-mail: [email protected]). The authors thank i-Behavior for data and the Direct Marketing Education Foundation for doctoral sup-port. This article is based on an essay from the first author’s dissertation. The authors thank three anonymous reviewers; seminar participants at the Marketing Science Conference, Haring Symposium, University of Houston Doctoral Symposium, University of North Carolina at Chapel Hill, Syracuse University, Georgia Institute of Technology, University of Illinois, and McGill University; Roger Kerin; Bill Perreault; Alina Sorescu; Rajan Varadarajan; and Manjit Yadav for helpful comments. Address all corre-spondence to Venkatesh Shankar. Aric Rindfleisch served as area editor for this article.
© 2013, American Marketing Association ISSN: 0022-2429 (print), 1547-7185 (electronic)
Journal of Marketing Volume 77 (July 2013), 67 –85
67
M
anaging customers according to their channel pref-erence—that is, whether they purchase from a tradi-tional channel (e.g., catalog, store), an electronic/ digital channel (e.g., web, mobile), or multiple channels— has become a cornerstone of marketing strategy (Neslin et al. 2006). Multichannel marketing refers to the practice of simultaneously offering customers information, goods, ser-vices, and support through two or more synchronized chan-nels (Rangaswamy and Van Bruggen 2005). The high growth in retail sales through electronic and multiple chan-nels indicates a need for marketing managers and scholars to develop a deeper understanding of this important topic in a retailing context that includes direct marketing (catalog, web, mobile) retailers and brick-and-mortar stores.Conventional wisdom, shaped by anecdotal evidence and initial research studies, suggests that multichannel cus-tomers constitute the most valuable segment for marketers
regardless of the product category. For example, the U.S.-based multichannel retailer Nordstrom finds that across categories, customers who use more than one channel spend four times as much as those who shop only through one channel (Clifford 2010). The limited relevant scholarly arti-cles that typically analyze a single category demonstrate that multichannel customers purchase more often and spend a larger share of wallet than single-channel customers (Kumar and Venkatesan 2005; Venkatesan, Kumar, and Ravishanker 2007).
study of the product category’s role in the monetary value of shoppers’ purchases by channel preference.
We define a multichannel customer of a broad product category as a customer who buys items in that category from more than one channel.1 By viewing multichannel shopping from the customer angle, our approach provides a holistic view of a customer’s behavior. We address two important research questions in the retailing context:
1. How does the monetary value of purchases by multichannel customers differ from that of single-channel customers? 2. How does the relationship between a customer’s channel
preference and monetary value vary by key product cate-gory characteristics (utilitarian vs. hedonic nature and per-ceived risk)?
The answers to these questions are critical from both theoretical and managerial standpoints. For example, if the monetary value of multichannel customers is higher than that of single-channel customers across all categories, mar-keters should reach customers of all categories through dif-ferent channels. Similarly, if web-only shoppers are the most valuable channel segment for high-risk/utilitarian categories (e.g., computers, electronics), marketers should target these shoppers. Finally, if traditional channel shop-pers of low-risk categories (e.g., office supplies, garden supplies) provide higher monetary value than multichannel or web-only shoppers, marketers should focus on these shoppers.
To address these research questions, we develop a con-ceptual framework and important hypotheses related to the moderating role of the two key product category character-istics—utilitarian versus hedonic nature and perceived risk—on the link between channel preference and customer monetary value. We test our hypotheses and obtain empiri-cally generalizable insights by analyzing a unique large-scale, cross-sectional data set of 1 million customers
ran-domly drawn from 96 million customers of 750 direct mar-keting retailers, spanning 22 product categories across the catalog and web channels over a four-year period. We gen-eralize the results to the store channel with a longitudinal analysis of transaction data from a large multiproduct retailer with the store channel in addition to the catalog and web channels.
Our results show that contrary to conventional wisdom, multichannel customers form the most valuable segment only for hedonic product categories. We also find that tradi-tional channel customers of low-risk product categories provide higher monetary value than other customers. More-over, web-only (store- or catalog-only) customers of high-(low-) risk/utilitarian categories offer higher monetary value than other single-channel or multichannel customers. Our findings provide valuable managerial guidelines for shopping in different channels.
This article contributes to the literature in at least two key ways. First, it offers a theoretical understanding of the moderating effects of category characteristics on the chan-nel preference–monetary value relationship. Second, it pro-vides empirically generalizable counterintuitive findings about this relationship. Furthermore, as Table 1 shows, unlike related research (e.g., Ansari, Mela, and Neslin 2008; Kumar and Venkatesan 2005), the current research exam-ines the moderating effects of the product category and ana-lyzes data from multiple categories and firms in an inte-grated framework.
Conceptual Development
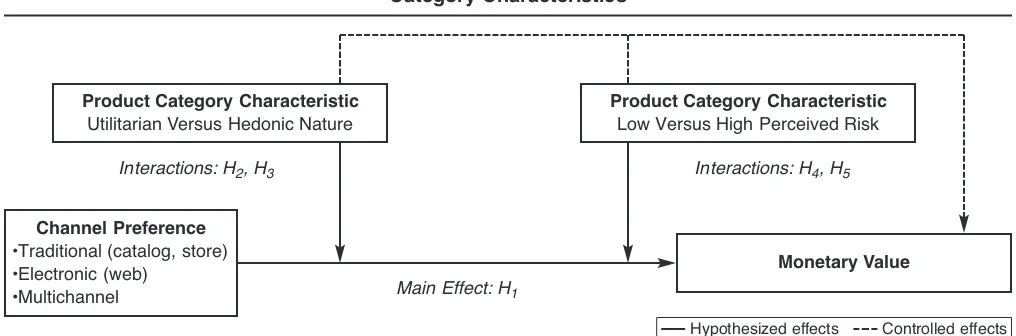
We first develop a conceptual model of the relationships between channel preference, product category characteris-tics, and monetary value (see Figure 1). We focus on both traditional and electronic channels. We classify the store and catalog channels under the unifying banner of a tradi-tional channel because they have a much longer history than electronic channels and are perceived as close substi-tutes (Avery et al. 2012). Any combination of these chan-nels constitutes a multichannel. Among the outcomes, we 1In our subsequent empirical analysis, we test for alternative
definitions of multichannel customers and show that our results are robust to alternative definitions.
FIGURE 1
A Conceptual Model of Relationships Between Channel Preference, Monetary Value, and Product Category Characteristics
Product Category Characteristic
Utilitarian Versus Hedonic Nature
Channel Preference
•Traditional (catalog, store) •Electronic (web)
•Multichannel
Product Category Characteristic
Low Versus High Perceived Risk
Monetary Value
Interactions: H2, H3
Main Effect: H1
Interactions: H4, H5
Are
M
ult
ic
ha
nne
l
Cus
tome
rs
Re
all
y
M
ore
V
alua
b
le
?
/
69
TABLE 1
Contribution of Current Research to Relevant Research
Moderating Impact Data Across Data Across
Article Purpose of Category Context of Study Data Type Categories Competition
Montoya-Weiss, Voss, Identify drivers of online channel usage in No Business-to- Primary ✔ No and Grewal (2003) multichannel environment consumer
Kumar and Venkatesan Explain the number of channels used by No Business-to- Secondary No No (2005) customers business
Thomas and Sullivan Offer communication strategy for multichannel No Retail Secondary ✔ No (2005) retailers
Venkatesan, Kumar, and Evaluate channel adoption duration No Retail Secondary No No Ravishanker (2007)
Verhoef, Neslin, and Examine the effect of search in one channel on No Business-to- Primary ✔ No Vroomen (2007) purchases in another channel consumer
Ansari, Mela, and Neslin Assess the impact of channel migration on No Direct Secondary No No (2008) purchase volume marketing
Konus, Verhoef, and Examine channel usage in different phases of No Business-to- Primary ✔ No Neslin (2008) decision making consumer
Valentini, Montaguti, and
Neslin (2011) Explore the evolution of customer channel choice No Retail Secondary ✔ No Avery et al. (2012) Investigate the impact of adding a channel on No Retail Secondary No No
sales in another channel
The current study Evaluate the moderating impact of product ✔ Direct marketing Primary and ✔ ✔
focus on a key managerial variable—that is, the monetary value of customer purchases—measured as the dollar value of customer transactions.
Prior research has examined the role of the product category in influencing different facets of customer behav-ior in traditional and electronic channels (Yadav and Varadarajan 2005b). Consistent with this research, we examine the moderating role of two key product category characteristics (i.e., utilitarian vs. hedonic nature and per-ceived risk) in shaping the relationship between channel preference and customer monetary value.
We define a utilitarian category as a category dominant on attributes such as functionality, practicality, cognition, and instrumental orientation, consistent with Dhar and Wertenbroch (2000). Computing equipment, consumer electronics, office supplies, home appliances, and garden equipment are examples of utilitarian categories. We define a hedonic category as a category dominant on attributes such as experiential benefits, affect, enjoyment, enduring involvement, intrinsic motivation, and aesthetics (Dhar and Wertenbroch 2000). Examples of hedonic categories include CDs, DVDs, antiques, and apparel. Unlike hedonic products, utilitarian products can be easily compared and evaluated along different attributes.
We refer to perceived risk of a product category as the “customers’ (overall) perceptions of uncertainty and adverse consequences of buying a good (or service)” (Dowling and Staelin 1994, p. 119; see also Bart et al. 2005). Perceived risk of a product category is evaluated on five dimensions of uncertainty: functional (not performing to expectation), financial (losing money), safety (causing physical harm), psychological (tarnishing self-image), and social (lowering others’ perceptions of the user) (Jacoby and Kaplan 1972). Office supplies and books are examples of low-risk categories, while jewelry and computers are examples of high-risk categories.
We chose these two product category characteristics as potential moderators from two main theoretical considera-tions. First, both category characteristics are grounded in regulatory focus theory (RFT), the basis for our hypotheses development. Prior research in marketing (see Chernev 2004; Yeo and Park 2006) treats hedonic (utilitarian) and high (low) perceived risk attributes as consistent with a pro-motion (prevention) focus in goal orientation, the key ingre-dients of RFT.
Second, utilitarian versus hedonic nature and perceived risk constitute fundamental bases for consumer purchase and consumption. Batra and Ahotla (1990, p. 159) state that “consumers purchase goods and services and perform con-sumption behaviors for two reasons: (1) consummatory affective (hedonic) gratification (from sensory attributes) and (2) instrumental (utilitarian) reasons.” Likewise, the study of perceived risk as an inherent product category characteristic behind purchase and consumption behavior has a long tradition in the marketing literature (e.g., Cox and Rich 1964; Sheth and Venkatesan 1968).
Our conceptual model includes the direct/main effect of channel preference and the interaction effects of channel preference and product category characteristics on mone-tary value. We develop hypotheses pertaining to these
effects. Our overarching argument is that different shoppers have different foci based on RFT, and if shoppers’ focus fits with their channel preference based on the product category characteristics, they will experience greater regulatory fit. In turn, stronger regulatory fit will lead to higher spending in their preferred channel on the product categories that exhibit those characteristics.
Main Effect
We first develop our hypothesis about the main effect of customer channel preference on the monetary value of pur-chases across categories. An entity (e.g., customer) evalu-ates the outcome of an exchange process with another entity (e.g., firm) by comparing the perceived benefits with the perceived costs related to the exchange, consistent with the quid pro quo notion (Bagozzi 1975). In addition to eco-nomic aspects, social and psychological aspects (e.g., mutual respect, commitment, trust) play an important role in determining the entities’ perceived overall benefits, costs, and value in an exchange (Frazier 1999).
Depending on their perceived value of an exchange through a channel, customers prefer to use different chan-nels and spend different amounts in different chanchan-nels. Cus-tomers who perceive exchanges in a channel as being of high value become frequent customers with a high degree of trust and commitment to purchase through that channel. Customers with a stronger commitment spend more on their purchases than other customers (Venkatesan, Kumar, and Ravishanker 2007).
The use of multiple channels is associated with a high level of monetary value for customers across all product categories for several reasons. First, additional channels provide greater convenience value for customers, increasing their purchase frequency and accelerating purchases across multiple items and categories. Second, the wide assortment of products across different channels offers multiple oppor-tunities for customers to buy and increase their spending. Third, customers can combine the benefits from different channels, realize greater value, and increase their spending (Frazier 1999). The web and traditional channels are comple-mentary rather than cannibalistic with regard to the money spent on shopping (Deleersnyder et al. 2002). Thus, channel segment membership (single-channel or multichannel) is a proxy for customers’ perceived value of and commitment to that channel. This commitment is positively related to cus-tomers’ spending in that channel across products. Therefore:
H1: Across all product categories, multichannel customers have a higher monetary value of purchases than single-channel customers.
Moderating Impact of Product Category Characteristics
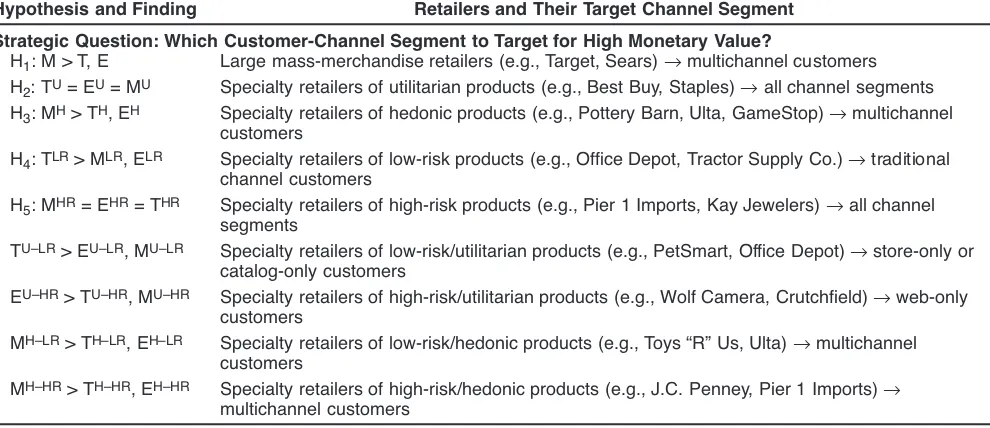
We now develop hypotheses on how the hedonic versus utilitarian nature and perceived risk moderate the strength of the relationship between channel preference and mone-tary value. We present a summary of the hypotheses together with the associated rationale in Table 2.
Are
M
ult
ic
ha
nne
l
Cus
tome
rs
Re
all
y
M
ore
V
alua
b
le
?
/
71
Traditional Modes Nontraditional Modes
Catalog Store Web Multiple Channels
Hypothesized Effect on Monetary Value Hypotheses
Customer Behavior/ Channel Characteristics
Prevention Focus Safety, Security, Low-Risk Profile
Promotion Focus High-Risk, Information Richness
Promotion Focus Convenience, Variety, Impulse, Learning Cost
H2: Utilitarian
categories
Prevention Focus
Cognitive involvement, planned purchases
Strong regulatory fit Automaticity is a critical heuristic for increasing efficiency during purchases of utilitarian cate-gories. Single-channel use is more efficient. Web-only customers have a stronger regula-tory fit than multichannel customers.
Weak regulatory fit TU, EU> MU
H3: Hedonic
categories
Promotion Focus
Variety seeking, experiential involvement, impulse/unplanned purchases
Weak regulatory fit Web-only customers have a strong regulatory fit, but variety-seeking and impulse buying behavior, inherent to hedonic categories, are more suitable for multiple channel usage. Thus, multichannel customers have a relatively stronger fit than web-only customers.
Strong regulatory fit MH> TH, EH
H4: Low-risk
categories
Prevention Focus
Routinized shopping, low involvement
Strong regulatory fit Weak regulatory fit TLR> MLR, ELR
H5: High-risk
categories
Promotion Focus
Uncertainty, high involvement
Weak regulatory fit Strong regulatory fit MHR, EHR> THR TABLE 2
Summary of Moderating Effects Hypotheses
their regulatory orientation in pursuing a goal: prevention focused and promotion focused (Avnet and Higgins 2006). A prevention focus stresses safety, security, and responsibil-ity, whereas a promotion focus emphasizes hope, advance-ment, and achievement. Thus, a promotion focus involves maximizing positive outcomes, whereas a prevention focus means minimizing negative outcomes. As RFT postulates, people make choices that are consistent with their regula-tory orientation (promotion or prevention focus) in goal pursuit (Avnet and Higgins 2006). When such choices sus-tain their regulatory orientation, people experience a regula-tory fit, leading them to continue their pursuits (Aaker and Lee 2006). Thus, a customer is likely to engage repeatedly in his or her preferred buying process (channel) if doing so is consistent with his or her regulatory orientation (Avnet and Higgins 2006). Regulatory fit leads to greater customer engagement through two well-documented processes (Cesario, Higgins, and Scholer 2008): (1) feeling right about the task and (2) increased information processing. These engaged customers tend to value and pay more for products than customers lacking in regulatory fit (Avnet and Higgins 2006). Therefore, promotion- and prevention-focused customers will tend to spend more on their pur-chases in their preferred channel.
Some channels are closely associated with a prevention focus, whereas others are aligned with a promotion focus. Because of their long history, traditional channels (i.e., cata-log and store) offer high levels of familiarity, safety, confi-dence, and trust. In the case of physical stores, customers can browse, touch, and feel products before purchase. Fur-thermore, many catalog companies and physical stores have had a long-standing practice of accepting returns from cus-tomers without asking questions. Therefore, traditional channels offer customers high confidence and trust in their purchases. Thus, catalog- and store-only customers are likely to have a high prevention focus as they repeatedly patronize traditional channels that offer high levels of safety, minimizing negative outcomes.
In contrast, the relatively newer electronic channels (e.g., the web) evoke high behavioral and environmental uncertainty (Schlosser et al. 2006; Van Noort, Kerkhof, and Fennis 2008). A large-scale survey by the Pew Internet Project (2008) shows that the web is perceived as highly uncertain such that approximately three-quarters of participants were unwilling to provide personal and credit card information over the Internet. Furthermore, the web entails the risk of identity theft, a significant deterrent to online channel adop-tion (Garver 2012). Despite more than a decade since the advent of electronic commerce, the adoption of the web as a transaction channel is still limited because of a high level of perceived risk. Therefore, web-only customers who repeat-edly patronize the electronic channel are likely to be driven by adventure and the need to signal advancement—that is, by focusing on positive outcomes. Moreover, web-only shoppers tend to be younger, better educated, and more prone to search on the web than other shoppers. Thus, these customers are likely to have a greater promotion focus.
Customers who adopt multiple channels seek greater convenience and display boldness associated with the adop-tion of the electronic channel. They seek greater enjoyment
and adventure through the use of different channels. There-fore, multichannel customers are also likely to have a greater promotion focus.
In summary, customers patronizing traditional modes of transaction (catalog and store) are likely to have a greater prevention focus. In contrast, customers adopting nontradi-tional modes (web and multiple channels) are likely to have a greater promotion focus. However, product category char-acteristics moderate the monetary values of customers by channel preference.
Utilitarian versus hedonic nature and channel preference interaction. Because utilitarian products (e.g., computers, garden equipment, sports equipment) have clear and well-defined attributes, they are relatively easy to compare and evaluate. Thus, for utilitarian product categories, shopping tasks involve planned purchases, goal-directed choice, and cognitive involvement (Novak, Hoffman, and Duhacheck 2003). Goal-directed behavior can lead to habit formation and automatic behavior (Aarts and Dijksterhuis 2000). In addition, utilitarian categories are typically high on search-dominant attributes. People allocate time, a scarce resource, to different activities, including search (Becker 1965). Scarcity of time is negatively linked to search efforts (Beatty and Smith 1987). Therefore, consumers of utilitar-ian products value efficiency in shopping (Mathwick, Mal-hotra, and Rigdon 2002). In general, efficiency attributes are associated with a greater prevention focus (Chernev 2004). Goal-oriented shopping behavior associated with utilitarian product categories is efficient in time utilization when both search and purchase are done habitually and repeatedly in a single channel. Because efficiency is para-mount, these customers prefer using a single channel to multiple channels.
Customers of traditional channels have a greater preven-tion focus, which maps with the prevenpreven-tion-focus attributes of utilitarian product categories, providing a strong channel– category fit. In contrast, because multichannel customers are promotion focused on utilitarian products, they experi-ence a relatively weak regulatory fit. A stronger regulatory fit is associated with greater engagement and higher spend-ing, and thus we expect traditional channel customers of utilitarian products to spend more than their multichannel counterparts.
Although web-only and multichannel customers are likely to have a greater promotion focus, which provides a weak regulatory fit with the utilitarian attributes, the greater efficiency of the web maps well with the shopping goals associated with utilitarian categories. Thus, web-only cus-tomers of utilitarian categories are also likely to have better goal–attribute fit than their multichannel counterparts. Taken together, we expect that single-channel customers of utilitarian product categories have higher monetary values than multichannel customers. Thus:
H2: The monetary value of purchases by single-channel cus-tomers of utilitarian product categories is higher than that by multichannel customers of these categories.
Impulse purchases are characterized by spontaneity, com-pulsion, excitement, and disregard for consequence (Kou-faris 2002). Variety-seeking behavior is, in part, driven by factors such as product category–specific differences (Van Trijp, Hoyer, and Inman 1996). Customers of hedonic prod-uct categories likely have high goal ambiguity because of affect-dominant attributes and the salience of the experien-tial value of hedonic products. Such goal ambiguity leads customers of hedonic categories to include disparate prod-ucts in their consideration set (Ratneshwar, Pechmann, and Shocker 1996) and seek variety. In addition, perceived uncertainty about future preferences is likely to be higher for hedonic products, leading to variety seeking as a choice heuristic (Simonson 1990). In general, hedonic attributes are associated with a greater promotion focus (Chernev 2004). Thus, customers are more likely to engage in variety-seeking behavior for hedonic categories and spend more (Garg, Inman, and Mittal 2005; Kurt, Inman, and Argo 2011; Ratner and Kahn 2002; Stilley, Inman, and Wakefield 2010a, b).
Multichannel customers are likely to have a greater pro-motion focus, which provides a strong regulatory fit with hedonic attributes. Multiple channels provide a greater assortment of products than a single channel. More hedonic products across multiple channels offer customers more opportunities to engage in impulse purchases, enhance cus-tomers’ consideration set, and promote greater variety seek-ing. In contrast, the prevention focus of traditional channel customers has a weak regulatory fit with hedonic attributes. Thus, multichannel customers are likely to be more strongly engaged and have a higher spending level than their coun-terparts from traditional channels.
Web-only customers are also likely to have a greater promotion focus, which provides a strong regulatory fit with hedonic attributes. However, the use of multiple chan-nels offers greater convenience and variety, which are more satisfying for variety-seeking and impulse purchase behav-iors commonly involved in hedonic categories. Thus, multi-channel customers of hedonic categories are likely to have a better goal–attribute fit than their web-only counterparts.
In summary, we expect that multichannel customers of hedonic product categories have higher monetary value than their single-channel counterparts. These arguments lead to the following hypothesis:
H3: The monetary value of purchases by multichannel cus-tomers of hedonic product categories is higher than that by single-channel customers of these categories.
Perceived risk and channel preference interaction. For product categories with high perceived risk, such as elec-tronics, telecommunications equipment, and musical instru-ments, customers face considerable uncertainty. Therefore, product categories with high perceived risk fit the goal ori-entation of promotion-focused customers (Yeo and Park 2006). A promotion focus is consistent with risk-seeking behavior (Avnet and Higgins 2006). Conversely, a preven-tion focus is synonymous with risk-averse behavior and fits with low-risk product categories, such as office supplies, books, and toys.
Because of the channel–category fit, low-risk categories likely attract prevention-focused customers who shop in
tra-Are Multichannel Customers Really More Valuable? / 73 ditional channels, whereas high-risk categories may draw promotion-focused customers, such as those shopping on the web or through multiple channels. Consistent with the notion that the perceived risk of the web is due to the relative new-ness and impersonal nature of the channel (Montoya-Weiss, Voss, and Grewal 2003), we expect that web-only cus-tomers have a greater promotion focus than a prevention focus. Similarly, because multichannel customers may seek greater enjoyment and adventure through different chan-nels, they are likely to have a greater promotion focus. In contrast, because of the low-risk profiles of the store and catalog channels, single-channel customers are likely to have a greater prevention focus.
With the high degree of fit among prevention focus, low-risk categories, and traditional channels, traditional channel customers tend to spend more than web-only or multichannel customers in low-risk categories. In contrast, web-only and multichannel customers of high-risk categories likely spend more than customers of traditional channels because of the high degree of fit between these categories and channels. These arguments lead to following hypotheses:
H4: The monetary value of purchases by traditional channel customers of low-risk product categories is higher than that by electronic channel and multichannel customers of these categories.
H5: The monetary value of purchases by electronic channel and multichannel customers of high-risk product cate-gories is higher than that by traditional channel customers of these categories.
Empirical Analyses
We examine an empirical context comprising a carefully compiled, unique, and large cross-sectional database of approximately 1 million U.S. customers who were ran-domly selected from a cooperative database of 96 million customers of 750 direct marketers covering 22 product cate-gories and several subcatecate-gories during a four-year period (2001– 2004). We obtained data from i-Behavior, a syndi-cated data aggregator firm. Firms in the cooperative database have only the web and catalog channels (no physical stores exist), so the catalog is their offline channel. The data contain customers’ demographic characteristics, shopping experi-ences, preferred purchase channels, order details, and product categories purchased. This period adequately captures the growth phase of the web as a distribution channel. Details on these 22 product categories appear in the Web Appendix (WA1; www.marketingpower.com/jm_webappendix).
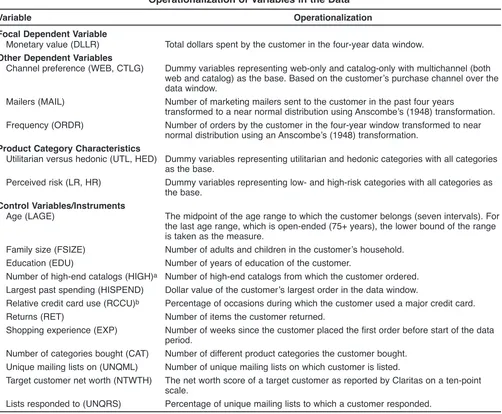
Operationalization of Variables
The operationalization of the variables in our data appears in Table 3. The exogenous classes of variables, such as demographic characteristics, shopping experience, high-end catalog usage, and the number of unique mailing lists that contain the customer’s name, are based on the customers’ past transaction history.
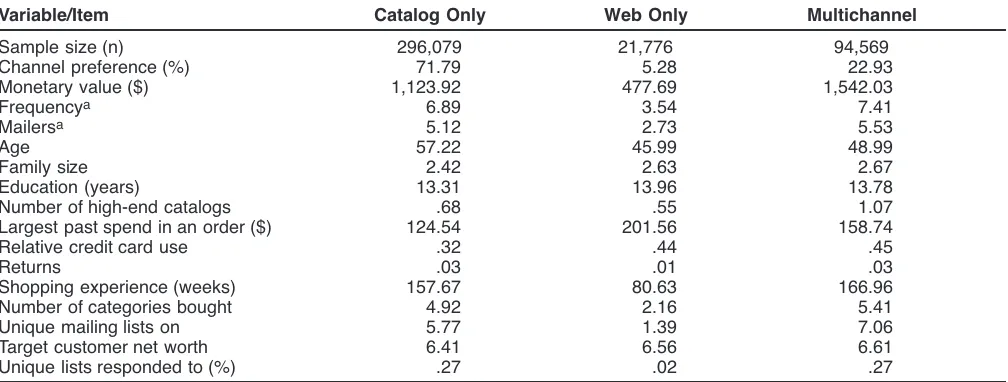
Table 4 provides summary statistics for the key variables in our model. Of the usable sample (customers with data on every variable in the database), 71.8% pur-chased only through the catalog channel, 5.3% purpur-chased only through the web, and the remaining 22.9% purchased through both channels.2Although the number of purchases of web-only shoppers is much smaller than that of
catalog-only and multichannel shoppers, web-catalog-only retail sales grew by approximately 12% during the 2006–2010 period (Jupiter Research 2011). The summary snapshot suggests that multichannel customers spend approximately one and a half times more than catalog-only customers and approxi-mately five and a half times more than web-only customers. Similarly, multichannel customers buy more often (higher frequency) than single-channel customers. However, are these initial summary observations true for all product cate-gories? We address this question in our empirical analysis.
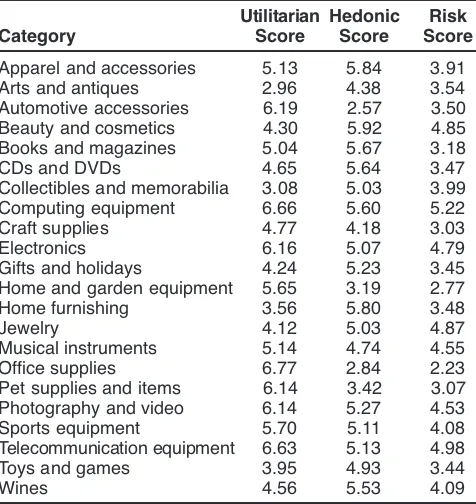
Measurement of Product Category Characteristics
We use data from exogenous sources to measure the two key category characteristics of the 22 product categories. We classify product categories with a higher utilitarian score than hedonic score as utilitarian, and vice versa for the purchased product category basket. We classify the cate-gories as high or low risk on the basis of a median split along these dimensions for the purchased product category
TABLE 3
Operationalization of Variables in the Data
Variable Operationalization
Focal Dependent Variable
Monetary value (DLLR) Total dollars spent by the customer in the four-year data window.
Other Dependent Variables
Channel preference (WEB, CTLG) Dummy variables representing web-only and catalog-only with multichannel (both web and catalog) as the base. Based on the customer’s purchase channel over the data window.
Mailers (MAIL) Number of marketing mailers sent to the customer in the past four years
transformed to a near normal distribution using Anscombe’s (1948) transformation. Frequency (ORDR) Number of orders by the customer in the four-year window transformed to near
normal distribution using an Anscombe’s (1948) transformation.
Product Category Characteristics
Utilitarian versus hedonic (UTL, HED) Dummy variables representing utilitarian and hedonic categories with all categories as the base.
Perceived risk (LR, HR) Dummy variables representing low- and high-risk categories with all categories as the base.
Control Variables/Instruments
Age (LAGE) The midpoint of the age range to which the customer belongs (seven intervals). For the last age range, which is open-ended (75+ years), the lower bound of the range is taken as the measure.
Family size (FSIZE) Number of adults and children in the customer’s household. Education (EDU) Number of years of education of the customer.
Number of high-end catalogs (HIGH)a Number of high-end catalogs from which the customer ordered. Largest past spending (HISPEND) Dollar value of the customer’s largest order in the data window.
Relative credit card use (RCCU)b Percentage of occasions during which the customer used a major credit card. Returns (RET) Number of items the customer returned.
Shopping experience (EXP) Number of weeks since the customer placed the first order before start of the data period.
Number of categories bought (CAT) Number of different product categories the customer bought. Unique mailing lists on (UNQML) Number of unique mailing lists on which customer is listed.
Target customer net worth (NTWTH) The net worth score of a target customer as reported by Claritas on a ten-point scale.
Lists responded to (UNQRS) Percentage of unique mailing lists to which a customer responded.
aData aggregators in the direct marketing industry classify catalogs into five categories on a continuum from “low-scale” to “high-scale” cata-logs. The number of times a customer orders from the highest category of the “high-scale” catalogs is the operationalization of the variable. bMasterCard and Visa issued by major banks, American Express, and Discover are classified as major credit cards.
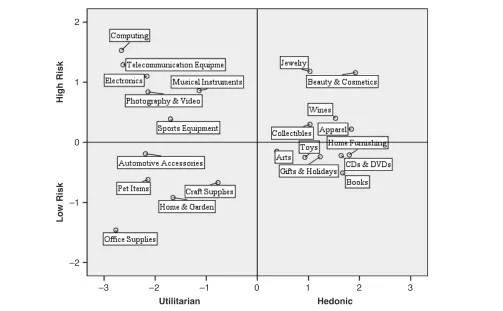
basket. We dummy-code consumer shopping baskets on four variables: hedonic dummy, utilitarian dummy, high-risk dummy, and low-high-risk dummy. The mixed shopping basket, containing both hedonic and utilitarian and high-risk and low-high-risk products, serves as the base case scenario. Measurement scale. Consistent with prior research, we operationalize the hedonic versus utilitarian nature of a product category using the hedonic utility (HEDUT) scale (Voss, Spangenberg, and Grohmann 2003). The scale mea-sures the strength of a product category on utilitarian and hedonic aspects using an equal number of items. The details of the scale items and anchors used for measuring each of these two aspects appear in the Web Appendix (WA2; www. marketingpower.com/jm_webappendix). We operationalize perceived risk using the scale developed by Jacoby and Kaplan (1972) and used by others (e.g., Chaudhuri 1998). Product category risk has five components: functional (not performing to expectation), financial (losing money), safety (causing physical harm), psychological (tarnishing self-image), and social (lowering others’ perceptions of the user). Figure 2 depicts the relative positions of categories on these two dimensions. We calibrate the axes in the map on deviations from the median score. Details of the scale items appear in WA2.
Data collection. We collected data on these measures from students in a nationally ranked business program of a large well-known university in the eastern United States. To reduce cognitive fatigue associated with long question-naires, we used a split sample approach in which each respondent evaluated only 11 product categories. We ran-domly assigned the product categories to the two types of questionnaires and randomly distributed the questionnaires to the respondents. Of the 78 questionnaires, we received 67 usable responses.
Scale properties. Both the HEDUT and Perceived Risk scales possess excellent convergent validity, divergent validity, and reliability. All five items from the Perceived
Are Multichannel Customers Really More Valuable? / 75 Risk scale load on one factor, measuring the underlying concept of perceived risk. Details on the scale properties and computation of the composite measures of HEDUT and Perceived Risk appear in the Web Appendix (WA2; www. marketingpower.com/jm_webappendix). Table 5 reports the mean composite scores for each product category on each of these three underlying dimensions across our sample.
Measurement validation. The measures have consider-able face validity. The categories with higher technological complexity and higher prices or those used more in social settings scored higher on perceived risk (e.g., electronics, photography and video equipment, jewelry, apparel and accessories). Similarly, the respondents perceived the beauty and cosmetics, wines, and home furnishing cate-gories as largely hedonic and the computing, telecommuni-cations, and office supplies categories as mainly utilitarian. We cross-validated these findings through the ratings of five experts who classified all 22 categories into this 2 ¥2 matrix. The interrater reliability was .93, suggesting high external validity of our survey results.
Model Formulation
Monetary value. We model the key dependent variable of interest, monetary value (DLLRi) of a customer i, as a function of his or her channel preference, purchase fre-quency (ORDRi), and number of marketing mailers received (MAILi), as follows:
(1) DLLRi= b0+ b1CTLGi+ b2WEBi+ b3UTLi+ b4HEDi + b5LRi+ b6HRi+ b7–26PCIi+ b27ORDRi + b28MAILi+ b29–31IDi+ yi,
where CTLG (catalog only) and WEB (web only) are dummy variables for the use of the catalog and web chan-nel, respectively, with multichannel as the base channel. In addition, UTL (utilitarian categories only), HED (hedonic categories only), LR (low-risk categories only), and HR (high-risk categories only) are dummy variables represent-TABLE 4
Summary Statistics of Key Variables in the Data
Variable/Item Catalog Only Web Only Multichannel
Sample size (n) 296,079 21,776 94,569
Channel preference (%) 71.79 5.28 22.93
Monetary value ($) 1,123.92 477.69 1,542.03
Frequencya 6.89 3.54 7.41
Mailersa 5.12 2.73 5.53
Age 57.22 45.99 48.99
Family size 2.42 2.63 2.67
Education (years) 13.31 13.96 13.78
Number of high-end catalogs .68 .55 1.07
Largest past spend in an order ($) 124.54 201.56 158.74
Relative credit card use .32 .44 .45
Returns .03 .01 .03
Shopping experience (weeks) 157.67 80.63 166.96
Number of categories bought 4.92 2.16 5.41
Unique mailing lists on 5.77 1.39 7.06
Target customer net worth 6.41 6.56 6.61
Unique lists responded to (%) .27 .02 .27
ing category characteristics with all categories as the base. Finally, PCI is a vector of 12 two-way and 8 three-way
interaction variables of category characteristics and chan-nels, IDis a vector of instruments for the monetary value equation, bs are the response parameters, and y is a nor-mally distributed random error component. To isolate the impact of channel preference on monetary value through Equation 1, we account for the endogeneity or simultaneity of channel preference, purchase frequency, and number of mailers.3
Channel preference. A customer is likely to prefer a channel (or combination of channels) that provides the highest utility. Let the utility U of customer i’s preference of channel j be given by
(2) Uij= aj0+ aj1DLLRi+ aj2ORDRi+ aj3MAILi+ aIICij+ eij, where ICis a vector of instruments for channel preference; j Œ1, 2, 3 such that 1 = catalog, 2 = web, and 3 = multi-channel;ajs are channel-specific response parameters, eis a normally distributed random error component, and the other terms are as defined previously. We specify a multinomial
probit model for the probability of channel preference (P) on the basis of the following equation:
where Fis the probability density function of normal distri-bution and V is the deterministic component of utility.
Purchase frequency. The purchase frequency of a cus-tomer is given by
(4) ORDRi= g0+ g1CTLGi+ g2WEBi+ g3DLLRi+ g4MAILi + gIIOi+ zi,
where gis a parameter vector, IOis a vector of instruments
for the purchase frequency equation, zis a normally distrib-uted random error component, and the other terms are as defined previously.
Mailers. The number of marketing mailers a customer receives is given by
(5) MAILi= d0+ d1CTLGi+ d2WEBi+ d3DLLRi+ d4ORDRi + dIIMi+ Ji,
where IMis a vector of instruments for the mailer equation, d is a parameter vector, Jis a normally distributed error com-ponent, and the rest of the terms are as defined previously.
∫
∫
(
)
= Φ ε ε − ε ε
−∞ −∞
− −
(3) Pij ... ij, ..., ij 1d , ...., d , V
V
ij ij 1
ij 1 ij FIGURE 2
Relative Positions of Product Categories Along Key Category Characteristics
Notes: X- and y-axes are calibrated as deviations from the median (0, 0).
–3 –2 –1 0 1 2 3
2
1
0
–1
–2
Utilitarian Hedonic
L
o
w
R
is
k
H
ig
h
R
is
k
Identification and Instrumental Variables
To identify the four equations, each with three endogenous variables, we require at least three excluded exogenous variables or instruments for each one. Theoretically, a good instrument should be correlated with the left-hand-side endogenous variable but uncorrelated with the independent variables.4We propose nine excluded exogenous variables for each equation that constitute appropriate instruments according to theoretical considerations examined in the marketing literature.
Customer-ordering characteristics (ID). Three customer-ordering characteristics—namely, the number of high-end catalogs used, the value of the highest basket, and the rela-tive use of a credit card—may influence the monetary value of purchases for the following reasons. Customers who browse high-end products (HIGH) are likely to spend more because the average unit price of such items is higher than that for other items. Similarly, the dollar value of the cus-tomer’s largest order (HISPEND) will be strongly corre-lated with the monetary value of customers but only weakly related to the other endogenous variables such as purchase frequency. Finally, consistent with previous research that shows that customers who purchase with a credit card are likely to spend more than those who use other payment modes (Soman and Cheema 2002), we use relative credit card usage (RCCU) as an instrument for monetary value.
Customer demographics (IC). A customer’s demograph-ics may significantly influence his or her channel preference
Are Multichannel Customers Really More Valuable? / 77 behavior. Different socioeconomic classes may have differ-ent predispositions to buy from differdiffer-ent types of channels, and customer demographics play an important role in the choice of the information channel and the resulting share of volume for a channel (Inman, Shankar, and Ferraro 2004). Age, family size, and education are key demographic variables influencing channel preference.5The literature on store choice behavior (e.g., Popkowski Leszczyc, Sinha, and Timmermans 2000) and channel–category associations (Inman, Shankar, and Ferraro 2004) suggests that three cus-tomer demographic variables—age (LAGE), family size (FSIZE), and education (EDU)—most likely influence channel preference.
Customer shopping experience (IO). We expect that customer shopping experience, which includes years of shopping (EXP), number of product categories purchased (CAT), and number of items returned (RET), influences purchase frequency for the following reasons. Typically, customers who have shopped longer are more knowledge-able about selling practices and channels, have greater shopping involvement, and order more frequently (Bolton 1998). The number of categories and purchase frequency are positively related because a customer tends to buy asso-ciated categories on a given occasion (Kumar and Venkate-san 2005).6Customers with higher returns also likely have higher purchase frequencies (Kumar and Venkatesan 2005).
Customer marketing profile (IM). Firms send marketing mailers to prospects according to their marketing profiles. Three key variables that constitute marketing profile are (1) the number of unique mailing lists containing the cus-tomer’s name (UNQML), (2) the net worth of the target customer (NTWTH), and (3) the number of unique mailing lists to which the customer has responded (UNQRS). Direct marketers typically use these factors when selecting new customers to target in their direct mail campaigns (Direct Marketing Association 2005).
Estimation
The proposed simultaneous system comprises an observed endogenous discrete choice variable (channel preference), endogenous count variables (frequency and mailers), and an endogenous continuous variable (monetary value). Because we have a combination of discrete and continuous variables 4We subsequently test for the quality of instruments in the
“Robustness Checks” section.
5We do not include gender in our analysis because there are no strong theoretical reasons to expect differences in channel prefer-ence due to gender differprefer-ences and because a subsequent empirical analysis involving gender showed that gender has a nonsignificant effect on channel preference (p> .10). This finding is consistent with the result that there are no significant differences between male and female web-only shoppers (Jupiter Research 2011). We also exclude income because it is highly correlated with education in the data we subsequently analyze.
6Although the number of categories may seem positively corre-lated with monetary value, there is no theoretical reason to believe this is so. A customer buying one low-value item each from sev-eral categories may have a lower monetary value than another cus-tomer buying several high-value items from a single category. Indeed, the correlation between these two variables is not high in our data (.39).
TABLE 5
Summary Scores of Product Categories on HEDUT and Perceived Risk Scales
Utilitarian Hedonic Risk
Category Score Score Score
Apparel and accessories 5.13 5.84 3.91 Arts and antiques 2.96 4.38 3.54 Automotive accessories 6.19 2.57 3.50 Beauty and cosmetics 4.30 5.92 4.85 Books and magazines 5.04 5.67 3.18
CDs and DVDs 4.65 5.64 3.47
Collectibles and memorabilia 3.08 5.03 3.99 Computing equipment 6.66 5.60 5.22 Craft supplies 4.77 4.18 3.03
Electronics 6.16 5.07 4.79
Gifts and holidays 4.24 5.23 3.45 Home and garden equipment 5.65 3.19 2.77 Home furnishing 3.56 5.80 3.48
Jewelry 4.12 5.03 4.87
Musical instruments 5.14 4.74 4.55 Office supplies 6.77 2.84 2.23 Pet supplies and items 6.14 3.42 3.07 Photography and video 6.14 5.27 4.53 Sports equipment 5.70 5.11 4.08 Telecommunication equipment 6.63 5.13 4.98 Toys and games 3.95 4.93 3.44
Wines 4.56 5.53 4.09
in the system, traditional two-stage or three-stage least squares estimation will lead to biased estimates. To estimate this system, we extend the generalized probit framework (Amemiya 1978), which assumes that the random error component in each equation is normally distributed. To make the joint estimation tractable, we transform the nega-tive binomially distributed count variables (frequency and marketing mailers) into near-normal distributed variables, using Anscombe transformation (Anscombe 1948). This procedure ensures that our system has equations with only two types of dependent variables with normally distributed errors. We follow the two-step estimation approach detailed in the Web Appendix (WA3; www.marketingpower.com/ jm_webappendix). In Step 1, we regress each endogenous variable on all the exogenous instruments. In Step 2, we regress monetary value on the included exogenous variables and predicted values of endogenous variables (from Step 1). We use the ordinary least squares estimation for the mone-tary value, purchase frequency, and marketing mailers mod-els and the multinomial probit estimation for the channel preference model.
Results and Discussion
Main Effect
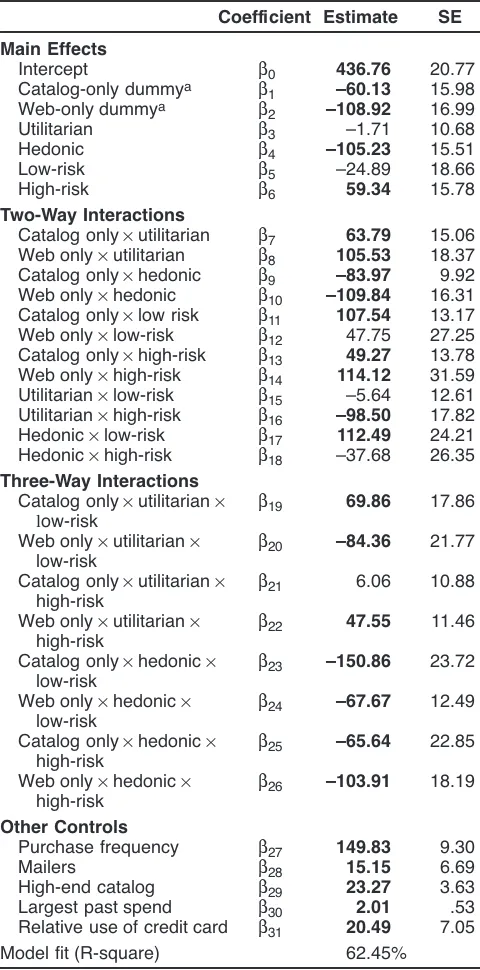
We present the results of the monetary value model in Table 6.7Consistent with H
1, across all product categories, multi-channel customers have a significantly higher monetary value than single-channel customers (p< .01). The average multichannel customer outspends the average catalog- and web-only customers by $60.13 (b1) and $108.92 (b2), respectively. In addition, the intercept is positive and signifi-cantly high ($436.76; b0), highlighting the expected high spending level of multicategory, multichannel shoppers.
Hypothesized Interaction Effects
H2 suggests that single-channel customers of utilitarian product categories spend more than other customers. After we control for the effects of other variables, the average catalog-only, web-only, and multichannel customers of utilitarian product categories spend $438.70 (b0+ b1+ b3+ b7), $431.65 (b0+ b2+ b3 + b8), and $435.05 (b0+ b3), respectively.8 However, the difference in spending among the average catalog-only, web-only, and multichannel cus-tomers is not significant (p> .10). Thus, we find that the monetary values of utilitarian category purchases do not significantly differ among traditional, electronic, and multi-ple channel customers.
H3 proposes that multichannel customers of hedonic product categories will outspend their single-channel coun-terparts. We find that the average catalog-only, web-only, and multichannel customers of hedonic product categories spend $187.43 (b0+ b1+ b4+ b9), $112.77 (b0+ b2+ b4+
b10), and $331.53 (b0+ b4), respectively. The difference in spending between the average multichannel and catalog-only customers ($144.09) and between the average multi-channel and web-only customers ($218.76) is positive and significant (p< .01). These findings suggest that multichan-nel customers of hedonic product categories significantly outspend their single-channel counterparts, in support of H3.
H4proposes that traditional channel customers of low-risk categories have higher monetary value than that of other customers. The average catalog-only, web-only, and multichannel customers of low-risk product categories 7The model results for the other endogenous variables not used
for hypotheses testing appear in the Web Appendix (WA4; www.marketingpower.com/jm_webappendix).
8We tested the differences between the effects by accounting for the standard errors and covariances of the parameter estimates.
TABLE 6
Hedonic b4 –105.23 15.51
Low-risk b5 –24.89 18.66
High-risk b6 59.34 15.78
Two-Way Interactions
Catalog only¥utilitarian b7 63.79 15.06 Web only¥utilitarian b8 105.53 18.37 Catalog only¥hedonic b9 –83.97 9.92 Web only¥hedonic b10 –109.84 16.31 Catalog only¥low risk b11 107.54 13.17 Web only¥low-risk b12 47.75 27.25 Catalog only¥high-risk b13 49.27 13.78 Web only¥high-risk b14 114.12 31.59 Utilitarian¥low-risk b15 –5.64 12.61 Utilitarian¥high-risk b16 –98.50 17.82 Hedonic¥low-risk b17 112.49 24.21 Hedonic¥high-risk b18 –37.68 26.35
Three-Way Interactions
Catalog only¥utilitarian¥ b19 69.86 17.86 low-risk
Web only¥utilitarian¥ b20 –84.36 21.77 low-risk
Catalog only¥utilitarian¥ b21 6.06 10.88 high-risk
Web only¥utilitarian¥ b22 47.55 11.46 high-risk
Catalog only¥hedonic¥ b23 –150.86 23.72 low-risk
Web only¥hedonic¥ b24 –67.67 12.49 low-risk
Catalog only¥hedonic¥ b25 –65.64 22.85 high-risk
Web only¥hedonic¥ b26 –103.91 18.19 high-risk
Other Controls
Purchase frequency b27 149.83 9.30
Mailers b28 15.15 6.69
High-end catalog b29 23.27 3.63 Largest past spend b30 2.01 .53 Relative use of credit card b31 20.49 7.05 Model fit (R-square) 62.45%
aMultichannel is the base case.
spend $459.27 (b0+ b1+ b5+ b11), $350.70 (b0+ b2+ b5+ b12), and $411.87 (b0+ b5), respectively. The difference in spending between the average catalog- and web-only cus-tomers ($108.57, p< .01) and between the average catalog-only and multichannel customers ($47.41, p< .10) is posi-tive and significant, suggesting that traditional customers of low-risk categories offer higher monetary value than other customers. These results are consistent with H4.
According to H5, multichannel and web-only customers of high-risk categories have higher monetary value than that of other customers. The average catalog-only, web-only, and multichannel customers of high-risk product categories spend $485.24 (b0+ b1+ b6+ b13), $501.30 (b0+ b2+ b6+ b14), and $496.10 (b0+ b6), respectively. The difference in spending among the average multichannel, catalog-only, and web-only customers is not significant (p> .10). Thus, these results do not support H5.
Other Interaction Effects
We did not have formal hypotheses for the effects of three-way interactions among channel preference, utilitarian ver-sus hedonic nature, and perceived risk because we treat these effects as empirical issues. We now discuss the results of these interaction effects.
Low-risk/utilitarian. We find that the average catalog-only, web-catalog-only, and multichannel customers of low-risk/ utilitarian product categories spend $585.57 (b0+ b1+ b3+ b5+ b7+ b11+ b15+ b19), $322.78 (b0+ b2+ b3+ b5+ b8+ b12+ b15+ b20), and $404.51 (b0+ b3+ b5+ b15), respec-tively. The average catalog-only customers of low-risk/ utilitarian product categories spend $262.79 (p< .01) and $181.05 (p< .01) more than their web-only and multichannel counterparts, respectively. Therefore, for low-risk/utilitarian categories, traditional channel customers outspend non -traditional channel customers. Although the interaction effects of channel preference and a utilitarian nature suggest no significant difference between the monetary values of single-channel and multichannel customers (lack of support for H2), the interaction effects of channel preference and the low-risk nature of the category indicate a higher spending level by customers of traditional channels (H4). Because traditional channel customers are a subset of single-channel customers, for low-risk/utilitarian categories, traditional channel customers (who tend to have a prevention focus) experience a stronger regulatory fit than their web-only and multichannel counterparts.
High-risk/utilitarian. We find that the average catalog-only, web-catalog-only, and multichannel customers of high-risk/ utilitarian product categories spend $454.88 (b0+ b1+ b3+ b6+ b7+ b13+ b16+ b21), $554.16 (b0+ b2+ b3+ b6+ b8+ b14+ b16+ b22), and $395.88 (b0+ b3+ b6+b16), respec-tively. The average web-only customers of high-risk/utili-tarian product categories spend $99.28 (p < .05) and $158.27 (p< .01) more than their catalog-only and multi-channel counterparts, respectively. In addition, we find that the difference between the monetary values of the average multichannel and catalog-only customers is not statistically significant (p> .10). These results suggest that for high-risk/ utilitarian product categories, web-only customers provide
Are Multichannel Customers Really More Valuable? / 79 the highest monetary value, but the monetary values of catalog-only and multichannel customers do not differ.
This result is consistent with the arguments used for theorizing two-way interaction effects. Promotion-focused web-only customers are often comfortable buying high-value items from high-risk/utilitarian categories (e.g., con-sumer electronics, computing equipment) (Van Noort, Kerkhof, and Fennis 2008). Furthermore, utilitarian cate-gories typically require a high degree of information search. For such categories, the web is conducive for information gathering and offers a high level of convenience for shop-ping and ordering items (Yadav and Varadarajan 2005a). Moreover, as we suggested previously, web-only shoppers tend to be younger, better educated, more risk taking, and more prone to obtaining information on utilitarian products on the web than other shoppers. Satisfaction and enjoyable experience with the information search through an online channel can lead to positive outcomes (Mathwick and Rig-don 2004). Consequently, web-only customers of high-risk/utilitarian categories buy more often and spend more than other single-channel customers. Because the utilitarian nature of the categories leads to efficient shopping through a single channel, web-only customers also outspend multi-channel shoppers.
Low-risk/hedonic. We now turn to the effects of the interactions of perceived risk with the hedonic nature of the product category. For low-risk/hedonic product categories, the average catalog-only, web-only, and multichannel cus-tomers spend $231.72 (b0+ b1+ b4+ b5+ b9+ b11+ b17+ b23), $180.46 (b0+ b2+ b4+ b5+ b10+ b12+ b17 + b24), and $419.13 (b0+ b4+ b5+ b17), respectively. The average multichannel customers of low-risk/hedonic product cate-gories spend $187.41 (p< .01) and $238.68 (p< .01) more than their catalog- and web-only counterparts, respectively. The result of the test of H4shows that traditional channel customers of low-risk product categories outspend other customers of these categories. The result of the test of H3 shows that multichannel customers of hedonic categories spend more than other customers. However, for both the low-risk and the hedonic nature categories, multichannel customers have higher monetary value than other cus-tomers. This finding suggests that the hedonic nature has a stronger effect than low risk on monetary value.
multichannel customers provide the highest monetary value regardless of the risk level of the category.
Extension and Generalization of Results to the Store Channel
The large data set in our study helps uncover empirically generalizable findings across multiple product categories and direct marketers with catalog, web, and multiple chan-nels. To generalize these findings to the store channel, we extend this study with an analysis of a U.S. multiproduct retailer’s data set that includes (1) time-series data and (2) data from physical stores. Time-series data facilitate the study of the potentially causal relationship between channel preference and monetary value. Because store purchases constitute a majority of transactions for many multichannel retailers, analysis of physical store data enables us to gener-alize our results.
The details of this analysis appear in the Web Appendix (WA5; www.marketingpower.com/jm_webappendix). The findings from this analysis are consistent with those from the larger cross-sectional data set and reinforce our conclu-sions. In addition, the findings bolster the temporal links among the variables in our model and extend the generaliz-ability of our results for the catalog-only channel segment to all traditional channel segments, including the store-only channel segment.
Robustness Checks
Out-of-sample predictions. We validate our findings with an out-of-sample prediction on a randomly selected holdout sample of 50,000 customers. Using the parameter estimates from our estimated model on a sample of the remaining 362,424 customers, we predict the monetary value of customers in the holdout sample. The mean absolute deviation (MAD) is 250.14, the mean monetary value of the holdout sample is $1,254, and the MAD is approximately 19.95% of the sample mean. These values are reasonable for cross-sectional out-of-sample validation.9
Quality of instruments. We test the validity and strength of our instruments in multiple ways. In the “Identification and Instrumental Variables” subsection, we argue that our choice of instrumental variables is based on theory. We test for the strength of the instrumental variables using Staiger and Stock’s (1997) approach. In this approach, we test the first-stage F-statistic for each equation with the instrumental variables. The bias introduced by the weak instruments is of the order of the inverse of the F-statistic. We follow Stock and Watson’s (2003) rule of thumb; that is, an F-statistic greater than 10 is acceptable because it corresponds to a bias of less than 10% in the estimates. Staiger and Stock’s (1997) test for the first-stage regression in our data does not indicate the presence of poor instruments. The F-statistics of the monetary value, frequency, and mailers equations are 26,747, 28,033, and 31,058, respectively. Thus, any weak instrument introduces, at worst, a less than .0001% bias.
The adjusted R-square for these regression equations is also healthy (at least 60%), and the instrumental variables used in each equation are significant (p< .001), suggesting that the instruments are strong.
We also perform two formal tests to evaluate the validity of our instruments. First, consistent with Bound, Jaeger, and Baker (1995), we examine the validity of our instruments by using the correlation test. The correlation matrix reported in the Web Appendix (WA6; www.marketingpower. com/ jm_webappendix) suggests that the correlations of instru-mental variables with the associated endogenous variables are high, whereas those with other endogenous variables are moderate to low. Second, to ensure that our choice of instruments does not drive the directions of our results, we compare the observed average values of monetary value across the different baskets. The directions of these observed differences are similar to those from the results estimated through our simultaneous system. However, by accounting for endogeneity and simultaneity in our model, we can determine the correct magnitudes of the differences in monetary values across the baskets. Together with the theoretical arguments, these tests support the appropriate-ness of our instruments.
The instruments are exogenous or predetermined with respect to the variables studied. Nevertheless, to ensure complete independence from the variables, we estimated the model with values of the instruments from a matched sample of customers in the database. We used the propen-sity score matching method to select the matched sample, consistent with Rosenbaum and Rubin (1983). The results of this analysis, reported in the Web Appendix (WA7; www.marketingpower.com/jm_webappendix), are consis-tent with those reported in Table 6.
Operationalization of category characteristics as con-tinuous variables. We test the robustness of our findings to alternative (continuous) measures of category characteris-tics. We generate continuous measures for each of the utili-tarian, hedonic, and perceived risk characteristics for a cus-tomer’s basket by averaging the scores of each characteristic across the product categories bought. For example, if a customer purchased only apparel and acces-sories and beauty and cosmetics, his or her hedonic, utilitar-ian, and perceived risk scores would be 4.72, 5.88, and 4.38, respectively. The results of the monetary value model from this analysis appear in the Web Appendix (WA8; www.marketingpower.com/jm_webappendix) and are con-sistent with our main model results.
Alternative definitions of multichannel customer. We perform robustness checks for alternative definitions of a multichannel shopper. First, we define a multichannel shop-per as someone who shops across channels but within one specific category (e.g., shoes) and across firms. The results are largely consistent with those reported in Table 6. Second, we define a multichannel shopper as someone who shops across channels and across categories but within a firm. We discuss this analysis in detail in the previous section on extension and generalization of results to the store channel (see WA5 in the Web Appendix; www.marketingpower. com/jm_webappendix). Finally, we define multichannel 9These MAD percentage values are comparable to those Jen,