S
ince Robert S. Kaplan and David P. Nort o n i n t roduced their concept of the balanced s c o re c a rd in 1992, the term has become known as a measurement system that links strategic and operating objectives—and lead and lag perf o rmance measures—within four areas of an o rganization: financial, customer, internal business p rocesses, and learning and gro w t h .1S c o re c a rddevelop-ment is generally described as a group process. The bal-anced score c a rd literature, however, provides little insight about why it is beneficial to have groups rather
than individuals develop score c a rds.
T h e re are two reasons that groups may be pre f e rre d . First, groups may produce better score c a rds because their team members deliberate and discuss the factors that contribute to the business’s success.2S e c o n d ,
g roups may help score c a rd components become accept-ed and implementaccept-ed. Yet these two diff e rent activities a re often combined in books and articles that help busi-nesses plan for and adopt the balanced score c a rd .
R e s e a rch in other management accounting are a s often makes a distinction between development and
How Groups Produce
H i g h e r-Quality Balanced
Scorecards
T h a n
I n d i v i d u a l s
A
ST U DY S H OW S T H AT G R O U P S F I LT E R O U T I N D I V I D UA L S’
P O O R I D E AS A N DI N CO R P O R AT E T H E I R A P P R O P R I AT E I D E AS
. C
O L L E C T I V E LY,
G R O U P S P R O D UC E S CO R E CA R D ST H AT CO N TA I N G O O D Q UA L I T Y B U T P R I M A R I LY M A I N ST R E A M I D E AS
.
BY SU S A N B . HU G H E S, PH. D . , C P A ; CR A I G B . CA L D W E L L, PH. D . ; KA T H Y A . PA U L S O N GJ E R D E, PH. D . ; A N D PA M E L A J . RO U S E, C P A
implementation within an organization. For example, a review of the many re s e a rch studies that investigated the impact of employee participation on the annual budgeting process suggests that groups add value to the budgeting process only when individuals in the gro u p possess information about the business that is not known by others involved in the budgeting pro c e s s . This suggests that groups involved in developing a bal-anced score c a rd will add value to its components if they have a deep and clear understanding of what leads to business success. The re s e a rch conducted on budgeting also found that even when individuals do not make sig-nificant contributions to the budget’s content, individ-ual participation leads to higher levels of personal satisfaction with the budget and a greater commitment to achieve the budgetary goals.3This suggests that an
i n c reased level of commitment to the objectives and metrics included in a score c a rd may result from em-ployee participation in its development.
Our study separates the development activities fro m implementation activities and focuses on the impact of g roups on a score c a rd ’s development. We based our study on the idea that if groups are commonly re c o g-nized as critical to the development and implementa-tion of a score c a rd, it is important to understand their advantages and disadvantages. If groups add value to the development process, score c a rds developed by g roups should be of higher quality than those devel-oped by individuals. If groups add value only to the implementation process, there should be little diff e r-ence between score c a rds developed by individuals and those developed by groups. Within this study we pro-vide an overview of the literature that discusses the potential impact of groups during the score c a rd devel-opment process and examine the impact of groups on s c o re c a rd components.
GR O U P DE V E L O P M E N T O F BA L A N C E D
SC O R E C A R D S
Developing the balanced score c a rd involves identifying o rganizational metrics that are tied to and can help ful-fill a firm ’s strategy. Advocates of the balanced score c a rd believe that business entities rely too much on financial m e a s u res and that financial measures by themselves are poor indicators of strategic goal achievement. They
a rgue that financial measures should be “balanced” with nonfinancial considerations. Although traditional financial measures still play a role in evaluating a firm ’s p ro g ress, balanced score c a rds give greater consideration to formally tracking and planning for excellent perf o r-mance in financial as well as nonfinancial areas.
By identifying, monitoring, and learning from a b roader range of metrics, firms can benefit from org a-nized learning and measurement in two ways. First, as the process of developing a mission statement pro v i d e s both process and outcome gains, so, too, can the bal-anced score c a rd process. Second, the tactically oriented metrics developed during the score c a rd development p rocess will give firms a way to deconstruct larg e - s c a l e strategic directions into measurable activities.
Kaplan and Norton first described the score c a rd -building process in 1993.4They indicated that
score-c a rd score-construscore-ction involves a fascore-cilitator and a group of six to 12 executives. The group first reaches consensus on the org a n i z a t i o n ’s mission and strategy. Next it defines the appropriate key success factors and identifies the related four or five measures for each score c a rd perspec-tive, resulting in a total of 16 to 20 measures. Then, d i rect subordinates and middle managers are added to the score c a rd-building team. These individuals are expected to debate the key success factors and mea-s u remea-s. In the final mea-stage, the mea-senior management team finalizes the strategy, key success factors, objectives, and related measures. Kaplan and Norton noted that s c o re c a rd building is an interactive process that some-times takes more than 30 months.5Describing the
p rocess used by one organization, they list 10 executive team members involved in the initial score c a rd devel-opment stage. In the next stage, 100 individuals fro m the top three layers of management discuss the strategy and develop proposed measures used within the various s c o re c a rd s .
financial and nonfinancial metrics leads to score c a rd s that incorporate more information, give employees a better understanding of the firm, and enhance their commitment to the ideas generated. Of these thre e advantages, only the first is associated directly with the s c o re c a rd ’s development; the other two relate to employees and the score c a rd ’s implementation. Our re s e a rch focuses on the first advantage and assesses whether groups improve the information content and, t h e re f o re, the quality of balanced score c a rd s .
TE A M- BA S E D DE C I S I O N MA K I N G
The evidence about team decision making is not uni-f o rmly uni-favorable. Some ouni-f the problems associated with team decision making include the tendency of gro u p s to favor decision consensus over decision quality, which often is re f e rred to as “group think,” and the tendency for groups to make more extreme decisions than indi-viduals, which often is re f e rred to as “group polariza-t i o n . ”6Despite these recognized problems, gro u p - b a s e d
decision making continues to enjoy acclaim in both re s e a rch and practice. As a result, it is important to understand the potential positive effects associated with g roup decision making.
Similar to the management accounting literature, the l i t e r a t u re on groups describes two primary advantages of them. One is the ability to generate higher- q u a l i t y d e c i s i o n s .7The second relates to greater success in
implementing decisions.8Often these two advantages
a re blurred, and advantages in implementation become a sufficient reason to use a group-based approach. In our study we detangle the impact of implementation and decision making by focusing exclusively on the quality of decisions generated by individuals and g ro u p s .
In order for a group to generate high-quality deci-sions, three distinct activities must occur. First, marg i n a l suggestions from the gro u p ’s members must be identi-fied and eliminated. We refer to this process as “filter-ing.” Second, the group members’ higher- q u a l i t y suggestions must be identified and carried through to the gro u p ’s final output. We refer to this process as “car-ry through.” Third, once high-quality suggestions fro m the gro u p ’s members are identified, they must be delin-eated and refined. We refer to this process as “synerg i
s-tic idea development.” If these three activities occur, then the likely result is a collection of decisions that are better than any single group member could generate by h i m s e l f / h e r s e l f .
The ability of a group to generate better outputs than the gro u p ’s best member is re f e rred to in the liter-a t u re liter-as liter-an “liter-assembly bonus eff e c t . ”9T h e re is a
vigor-ous debate in the group literature about the ability of a g roup to perf o rm at a level greater than its most talent-ed member.1 0The variation in re s e a rch findings
appears to be at least partially due to the fact that the p resence of an assembly bonus effect is highly sensitive to the type of decision that must be made. There f o re , re s e a rchers must test for the existence of an assembly bonus effect in any new or unique group setting. The balanced score c a rd is a new and unique setting for this re s e a rch, and no attempts have been made to establish the existence of an assembly bonus effect in this set-ting, a fact that further motivated us to conduct this s t u d y.
We argue that the groups working to develop a bal-anced score c a rd will be able to generate highly innova-tive, creainnova-tive, and high-quality decisions by using the ideas of their individual members. Furt h e r, we expect to find an assembly bonus effect by testing for the pre s-ence of the three processes described earlier: filtering, c a rry through, and synergistic idea development.
First we suppose that, during the process of examin-ing individually developed ideas in a group settexamin-ing, the g roup will weed out, or filter, those individual decisions that are substandard .1 1The ability of a group to
high-light deficiencies in individual thinking is supported by both natural and stru c t u red group conflict.1 2In settings
involving group conflict, ideas that cannot be support e d a re revealed and eliminated. The process of discussing various assumptions and ideas forces individuals to reconsider their original thoughts. Thus, we expect that the group decision process will adeptly eliminate sub-s t a n d a rd itemsub-s from any lisub-st of ideasub-s that the group isub-s considering.
p rocess as carry through. Precisely how carry thro u g h occurs is not clear. We can, however, observe what hap-pens in the group process and draw conclusions about the extent of carry through likely to occur.
The third supposition we make is that groups will be able to build on and enhance the high-quality decisions that individual group members develop.1 4Because the
g roup members have diverse knowledge, they may become sounding boards for new ideas or suggestions, and the group is likely to see connections that the idea’s c reator is unable to identify. This ability to impro v e upon the suggestions of individuals is the synerg i s t i c idea development we described pre v i o u s l y. The ideas that are generated through this process go beyond the capabilities of any individual. Thus, we expect the assembly bonus effect to help produce high-quality g roup decisions.
If filtering, carry through, and synergistic idea devel-opment occur during the develdevel-opment process, bal-anced score c a rds that groups develop should be of higher quality than those developed by individuals. F u rt h e r, they should be devoid of low-quality ideas and exhibit some ideas that are more innovative than those that individuals develop. If these results do not occur, the time and energy invested by group members may not provide a corresponding benefit to the score c a rd ’s c o n t e n t .
ME T H O D O L O G Y
To test our suppositions, we had 46 MBA students par-ticipate in a balanced score c a rd development exerc i s e . The exercise was a graded part of the course assign-ments for the MBA capstone class, a course generally taken at the end of the MBA program. The rationale for using these students was twofold. By using students, we were able to assign an identical task to multiple g roups for the purposes of comparison. In a corporate setting, task assignment of this sort probably would be p rohibitively expensive and impractical. More o v e r, because these students had significant work experience, they had the necessary skills, training, and knowledge to develop a credible balanced score c a rd.
We gave all participants a packet of inform a t i o n about the same U.S. public corporation. We chose this entity because of its relatively simple stru c t u re, clear
mission, and readily identifiable product. The packet included corporate strategic objectives, product infor-mation, details about a recent acquisition, and inform a-tion about the company’s work environment and commitment to its communities.
Each student received a blank score c a rd with the i n f o rmation packet. The score c a rd had four rows, one for each area of the balanced score c a rd, and thre e columns. The columns provided boxes for objectives, lead measures, and lag measures for each score c a rd are a . Lead measures identify metrics that are useful in pre-dicting that the objective will be achieved; lag measure s a re used to determine if the objective was met. This design resulted in 12 cells within the score c a rd.
We used two phases so we could assess the extent to which groups filter, carry through, and develop ideas. First we asked each participant to individually develop a balanced score c a rd for the company. The part i c i p a n t s w e re asked to limit their suggested measures to no m o re than 24, which is similar to the number of mea-s u remea-s Kaplan and Norton recommend. In the next phase, the individual participants were placed in thre e -to four-person groups and asked -to complete a balanced s c o re c a rd as a team, using their individual score c a rds as the basis for discussion.
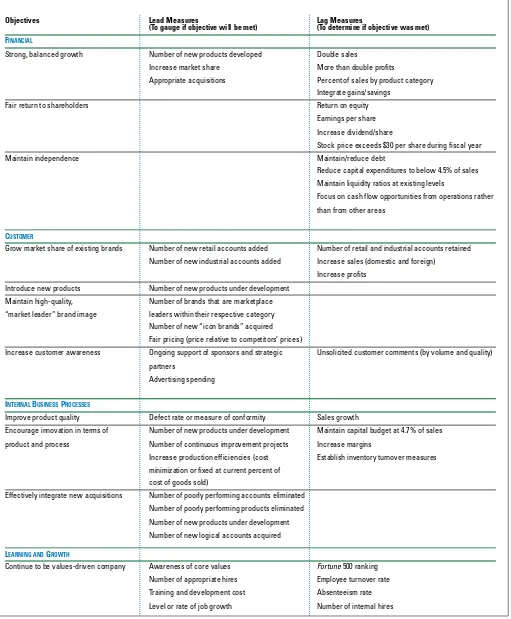
In order to establish a benchmark score c a rd for the e x e rcise, a panel of four faculty members from the are a s of accounting, leadership, and economics individually developed a balanced score c a rd for the company using the same packet of information the students used. These faculty members then worked as a team to com-plete a balanced score c a rd. This score c a rd, shown in Table 1, became the basis for evaluating the students’ s c o re c a rd s .
The 46 individuals proposed 1,258 ideas; the 12 g roups proposed 376 ideas. We used content analysis to c o n v e rt the narrative ideas into a form suitable for data analysis. Content analysis relies upon the ability of at least two independent coders to read and assign the n a rr a t i v e—in this case, each idea—to a specific cate-g o ry. The coders used the followincate-g three catecate-gories to classify the individual and group ideas:
Table 1:
Model Scorecard
Objectives Lead Measures Lag Measures
( To gauge if objective will be met) ( To determine if objective was met) FI N A N C I A L
Strong, balanced growth Number of new products developed Double sales
Increase market share More than double profits
Appropriate acquisitions Percent of sales by product category Integrate gains/savings
Fair return to shareholders Return on equity Earnings per share Increase dividend/share
Stock price exceeds $30 per share during fiscal year Maintain independence Maintain/reduce debt
Reduce capital expenditures to below 4.5% of sales Maintain liquidity ratios at existing levels
Focus on cash flow opportunities from operations rather than from other areas
CU S T O M E R
Grow market share of existing brands Number of new retail accounts added Number of retail and industrial accounts retained Number of new industrial accounts added Increase sales (domestic and foreign)
Increase profits Introduce new products Number of new products under development
Maintain high-quality, Number of brands that are marketplace “market leader” brand image leaders within their respective category Number of new “icon brands” acquired Fair pricing (price relative to competitors’ prices)
Increase customer awareness Ongoing support of sponsors and strategic Unsolicited customer comments (by volume and quality) p a r t n e r s
Advertising spending
IN T E R N A LBU S I N E S SPR O C E S S E S
Improve product quality Defect rate or measure of conformity Sales growth
Encourage innovation in terms of Number of new products under development Maintain capital budget at 4.7% of sales product and process Number of continuous improvement projects Increase margins
Increase production efficiencies (cost Establish inventory turnover measures minimization or fixed at current percent of
cost of goods sold)
Effectively integrate new acquisitions Number of poorly performing accounts eliminated Number of poorly performing products eliminated Number of new products under development Number of new logical accounts acquired
LE A R N I N G A N DGR O W T H
2 . An appro p ri a te ideais one that matches or appro x i-mates the faculty panel’s ideas of this score c a rd cell.
3 . An innova t i ve ideais one that does not match or a p p roximate the faculty panel’s ideas for this score c a rd cell but re p resents an appropriate, interesting, or thoughtful idea.
A c c o rd i n g l y, two individuals working independently coded each idea contained in the individual and gro u p s c o re c a rds as inappropriate, appropriate, or innovative. The codings were compared, and the coders agre e d with each other 92.3% of the time. Disagre e m e n t s between the coders were resolved by a third coder. A c c o rding to the definitions and standards developed in this process, the first two coders reviewed the data a t h i rd time to ensure consistency across score c a rd cells.
To make a further distinction about those items cod-ed as inappropriate, we separatcod-ed them into two distinct sets of ideas. If the idea was deemed inappropriate as a result of content error (e.g., the participant identified an objective or measure that was not applicable to the o rganization or simply did not make sense), it was cod-ed as a content error; if the idea was deemcod-ed inappro-priate because it placed an idea within an inappro p r i a t e cell, it was classified as a placement erro r. As before ,
two people coded these 993 ideas. Their coding agre e d for 85% of the ideas, and the third coder resolved the d i ff e rences for the other 15% of the ideas.
FI N D I N G S
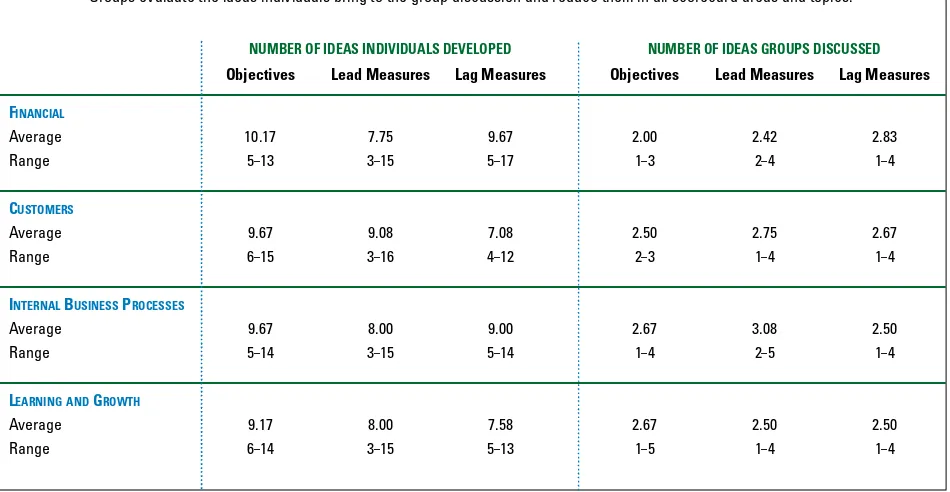
We began evaluating the impact of group part i c i p a t i o n on the objectives, lead measures, and lag measures of the four balanced score c a rd sections by developing s u m m a ry statistics of the inputs and outputs of the s c o re c a rd development process. These results are sum-marized in Table 2. One finding that is immediately a p p a rent is that the number of ideas developed at the individual level and used as the basis for group discus-sion varied widely. For example, at least one gro u p began the group discussion with only three lead or lag m e a s u res for various cells of the score c a rd. Another g roup began its discussion of financial lag measure s with 17 individual ideas. The group results were more c l u s t e red, ranging from one idea per cell to five ideas per cell. We also found that the number of ideas by s c o re c a rd section (financial, customer, internal business p rocess, and learning and growth) was appro x i m a t e l y equal as was the number of items suggested for objec-tives, lead measures, and lag measure s .
Table 2:
Balanced Scorecard Ideas Developed at Group and Individual Levels
Groups evaluate the ideas individuals bring to the group discussion and reduce them in all scorecard areas and topics.
NUMBER OF IDEAS INDIVIDUALS DEVELOPED NUMBER OF IDEAS GROUPS DISCUSSED
Objectives Lead Measures Lag Measures Objectives Lead Measures Lag Measures
FINANCIAL
Average 10.17 7.75 9.67 2.00 2.42 2.83 Range 5–13 3–15 5–17 1–3 2–4 1–4
CUSTOMERS
Average 9.67 9.08 7.08 2.50 2.75 2.67 Range 6–15 3–16 4–12 2–3 1–4 1–4
INTERNALBUSINESSPROCESSES
Average 9.67 8.00 9.00 2.67 3.08 2.50 Range 5–14 3–15 5–14 1–4 2–5 1–4
LEARNING ANDGROWTH
Next we summarized the coded individual and gro u p ideas to evaluate whether groups improved the quality or enhanced the creativity of the score c a rd ideas. One d i fficulty in comparing the individual and group re s u l t s is the diff e rence in the number of ideas included. This o c c u rred because the groups were evaluating the ideas of three or four individuals to develop one pro p o s e d s c o re c a rd and were asked to develop score c a rds in which the number of measures was limited to 24. To facilitate comparison between the individual and group ideas, we c o n v e rted the number of ideas to perc e n t a g e s .
We found that 777 of the 1,258 individual re s p o n s e s (62%) were coded as inappropriate either for that are a of the score c a rd or for the score c a rd in general. We identified only 40 ideas (3%) that were coded as innova-tive, and the majority of these were included within the lead measures. The remaining 441 ideas (35%) were a p p ropriate for their areas of the score c a rd. We found that appropriate and innovative ideas outnumbere d i n a p p ropriate ideas only in the areas of internal business p rocesses objectives and financial and customer lag m e a s u res. These results suggest that individuals re l i e d upon common business objectives and metrics—those that may be applicable to many diff e rent businesses— rather than developing innovative and thoughtful ideas a p p ropriate or specific to their company.
Within the group score c a rds, there were 191 (51%) a p p ropriate and 22 (6%) innovative ideas from among 376 group ideas. Both of these percentages were higher than those found in the individual score c a rds. One-half of the innovative ideas occurred within the lead mea-s u remea-s. Only within three mea-score c a rd cellmea-s—financial objectives, financial lead measures, and learning and g rowth lead measure s — w e re the majority of the gro u p
ideas coded as inappropriate. Within the intern a l business process lag measures, the ideas were evenly divided between those coded as inappropriate and a p p ro p r i a t e .
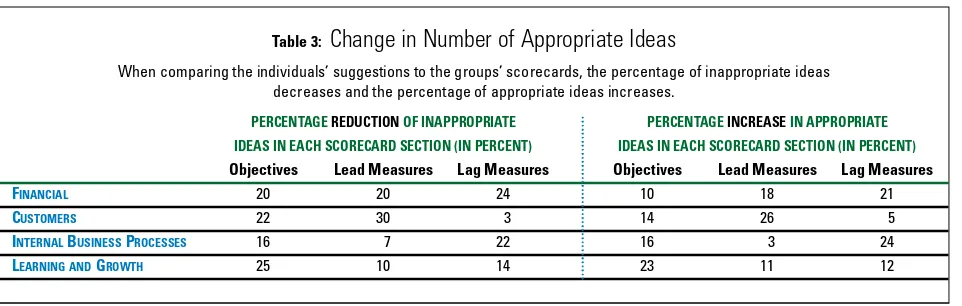
We found that the percentage of inappropriate ideas declined from the individual to the group results within all 12 score c a rd cells. We also found that the perc e n t a g e of ideas coded as appropriate increased from the indi-vidual to group levels within all 12 cells. The details of these results are shown in Table 3. The percentage of g roup ideas coded as innovative was greater than that at the individual level in most cells, although the number of innovative ideas continued to be less than 10% of all g roup ideas. These results indicate that the gro u p p rocess appears to have improved the overall quality of the ideas, filtering the inappropriate ideas and impro v-ing the concentration of innovative ideas. The gro u p p rocess also added a limited number of unique and high-quality ideas within the score c a rd sections.
G roup Selection of Individual Ideas
To further explore how the groups selected ideas, we analyzed the individual and group ideas in each gro u p to identify those individual ideas in each cell that were also among the gro u p ’s ideas in the same cell. This analysis allowed us to track the frequency with which the various groups included ideas suggested by an indi-vidual member from his or her score c a rd. We were par-ticularly interested in determining if groups had the ability to distinguish between inappropriate and appro-priate ideas included in the individual score c a rds, which would be indicated by the elimination of inappro p r i a t e ideas and the incorporation of appropriate ideas within the group score c a rd s .
Table 3:
Change in Number of Appropriate Ideas
When comparing the individuals’ suggestions to the groups’ scorecards, the percentage of inappropriate ideas decreases and the percentage of appropriate ideas increases.
PERCENTAGE REDUCTIONOF INAPPROPRIATE PERCENTAGE INCREASEIN APPROPRIATE
IDEAS IN EACH SCORECARD SECTION (IN PERCENT) IDEAS IN EACH SCORECARD SECTION (IN PERCENT)
Objectives Lead Measures Lag Measures Objectives Lead Measures Lag Measures FINANCIAL 20 20 24 10 18 21
CUSTOMERS 22 30 3 14 26 5
INTERNALBUSINESSPROCESSES 16 7 22 16 3 24
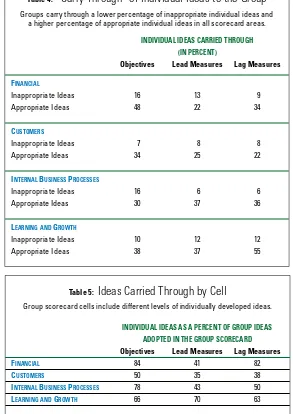
The groups appear to have engaged in a fairly effective sorting process. The num-ber of appropriate individual ideas that car-ried forw a rd to the group level exceeded the number of inappropriate ideas in all 12 of the score c a rd cells, as shown in Table 4. Few innovative ideas were carried forw a rd , so we focus our discussion on the inappro-priate and approinappro-priate responses.
The results also indicate that groups dif-f e red in the extent to which they relied on individual ideas carried forw a rd in deter-mining the group ideas included within the 12 cells. The majority of group ideas within the financial, internal business p rocess, and learning and growth objec-tives came from individual ideas, as sum-marized in Table 5. The lead measures for t h ree score c a rd areas, however, were larg e-ly developed within the groups. Within the lag measures, the majority of ideas within two cells were the result of individual ideas and within two cells were the result of ideas developed by the groups. The re s u l t s reveal that although the groups relied on the individual ideas when developing the financial objectives and lag measure s (adding only three of 25 and six of 34 ideas, respectively), in all other areas they tended to supplement the individual ideas in varying and greater amounts.
I n a p p ro p ri a te Ideas
As explained in the methodology section, we furt h e r analyzed the inappropriate ideas to determine if they reflected content error or classification diff e rences. As noted, a content error occurs when an individual or g roup identified an objective or measure that was not applicable to the organization or simply did not make sense. A classification error occurs when a potentially a p p ropriate idea appeared in an incorrect cell. If the g roups added value to the development of the score-c a rd items, we would expescore-ct that more of the inappro-priate items result from classification diff e rences and fewer result from content errors. Again, because of the
l a rger number of ideas included in the individual ideas than in the group ideas, we used percentages to deter-mine if the quality of the score c a rd items impro v e d f rom individuals to gro u p s .
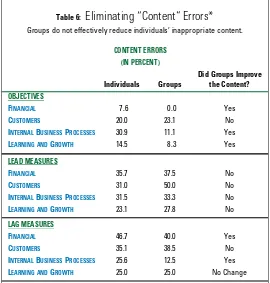
Our results indicated that the groups had the ability to filter individuals’ content errors from the gro u p ’s financial objectives and that the groups eliminated many content errors from the objectives of the other t h ree score c a rd sections. The groups, however, exhibit-ed varying success in eliminating individual ideas classi-fied as content errors from the lead and lag measures of the group score c a rds. These results are summarized in Table 6. They clearly indicate that groups do not eff e c-Table 4:
“Carry Through” of Individual Ideas to the Group
Groups carry through a lower percentage of inappropriate individual ideas and a higher percentage of appropriate individual ideas in all scorecard areas.
INDIVIDUAL IDEAS CARRIED THROUGH
(IN PERCENT)
Objectives Lead Measures Lag Measures
FINANCIAL
Inappropriate Ideas 16 13 9 Appropriate Ideas 48 22 34
CUSTOMERS
Inappropriate Ideas 7 8 8 Appropriate Ideas 34 25 22
INTERNALBUSINESSPROCESSES
Inappropriate Ideas 16 6 6 Appropriate Ideas 30 37 36
LEARNING ANDGROWTH
Inappropriate Ideas 10 12 12 Appropriate Ideas 38 37 55
Table 5:
Ideas Carried Through by Cell
Group scorecard cells include different levels of individually developed ideas.
INDIVIDUAL IDEAS AS A PERCENT OF GROUP IDEAS
ADOPTED IN THE GROUP SCORECARD
Objectives Lead Measures Lag Measures FINANCIAL 84 41 82
CUSTOMERS 50 35 38
INTERNALBUSINESSPROCESSES 78 43 50
tively filter inappropriate ideas identified by individual g roup members from all areas of the group score c a rds.
G roup Improvement of Ideas
The analyses discussed in the previous paragraphs sug-gest that the group process adds value to the balanced s c o re c a rd development process by reducing the per-centage of inappropriate ideas included within the cells and by including more of the appropriate individual ideas within the group score c a rd. We find, however, that the groups continue to carry many inappro p r i a t e ideas within their proposed score c a rds. The analyses p resented so far are based upon totals and perc e n t a g e s d e t e rmined within each of the score c a rd cells.
To further investigate the influence of individual ideas and input to the group score c a rd ideas, we ana-lyzed the results of each group. Because we found few individual and group ideas coded as innovative, we combined the two categories of good ideas (appro p r i a t e and innovative) into one “good” idea total per gro u p per cell. By combining these two categories, we could c o m p a re the number of inappropriate and good ideas individuals developed in each group and compare
those numbers with the inappropriate and good ideas included in the gro u p ’s output within each score c a rd cell. Consistent with the prior analyses, we relied on percentages for comparative purposes. We tabulated the per-centage of good to total answers among the individual ideas of each group and the corre-sponding percentage of good to total gro u p answers within the four score c a rd areas. The d i ff e rence between the individual and gro u p p e rcentages of good answers formed a “per-centage improvement.” We ranked each gro u p based on the percentage of good answers included in the group score c a rd s .
The results indicate that the quality of the individual score c a rds was relatively low as d e t e rmined by the percentage of good ideas to total ideas at the individual level. Only one or two groups have more than 50% of their total ideas come from individual ideas within each section of their score c a rds. When all ideas fro m all groups are combined, the individual ideas a re less than 50% of the total ideas.
The group results reveal that most groups developed s c o re c a rds in which the percentage of good ideas exceed 50%. More than 50% of the ideas within each s c o re c a rd section of at least seven groups were good. M o re than 50% of the total ideas of eight groups were good. These results, compared with group results in the a g g regate, indicate that the improvement within the balanced score c a rds was not generated by a few gro u p s but was widespread across many gro u p s .
We also calculated the percentage improvement in good responses from individual to group responses for each group in each of the four score c a rd areas and the combined improvement over all four sections. This cal-culation revealed that the quality improved from the individual to group score c a rds within all four score c a rd sections within almost all of the 12 groups. The re s u l t s indicated that the quality declined for only one group in the financial, customer, and learning and growth sec-tions and for only two groups within internal business p rocesses. When the results of the four areas were com-bined, all group score c a rds improved over those of their individual members.
Table 6:
Eliminating “Content” Errors*
Groups do not effectively reduce individuals’ inappropriate content.
CONTENT ERRORS
INTERNALBUSINESSPROCESSES 30.9 11.1 Yes
LEARNING ANDGROWTH 14.5 8.3 Yes
LEAD MEASURES
FINANCIAL 35.7 37.5 No
CUSTOMERS 31.0 50.0 No
INTERNALBUSINESSPROCESSES 31.5 33.3 No
LEARNING ANDGROWTH 23.1 27.8 No
LAG MEASURES
FINANCIAL 46.7 40.0 Yes
CUSTOMERS 35.1 38.5 No
INTERNALBUSINESSPROCESSES 25.6 12.5 Yes
LEARNING ANDGROWTH 25.0 25.0 No Change
RE L AT I V E PE R F O R M A N C E
To determine the relative perf o rmance of the gro u p s , we ranked them by the percentage of good ideas deter-mined at the group level from high to low, using a one-to-12 scale, adjusted for ties. The rankings were computed within each score c a rd section and for the combination of all four of the score c a rd ’s sections. Wi t h-in the combh-ined score c a rds, the percentage of good ideas ranged from a high of 72.4% to a low of 34.4%. The six top-perf o rming groups increased the perc e n t-age of good ideas from 18.3% to 34.4% over the perf o r-mance of their individual members.
We also summed the group rankings by score c a rd section and found the two top-perf o rming teams in the combined-section approach were similarly ranked under the individual-section approach. In fact, five of the top six teams in the combined results were in the top six of the individual-section approach. As such, the combined results appeared to provide a reasonable appro x i m a t i o n of the perf o rmance levels of the groups. A review of the details underlying the analysis did not provide any evi-dence that a specific group improved its perf o rm a n c e by incorporating ideas coded as innovative. The re s u l t s indicated that innovative ideas were widely dispersed a c ross the groups and that only one group submitted a s c o re c a rd that included only ideas coded as inappro p r i-ate and appro p r i a t e .
GO O D- QUA L I T Y, MA I N S T R E A M ID E A S
Our initial questions were:
◆ A re poor ideas generated by individuals eliminated in the group decision-making process (filtering)? ◆ A re high-quality ideas generated by individuals
identified and embraced as a worthy idea for the t e a m ’s final re p o rt (carry thro u g h ) ?
◆ A re the ideas generated by the team likely to include highly innovative ideas (synergistic idea development)?
The answer to all three questions is a qualified yes. Of these three effects, filtering appears to be the most p revalent, suggesting that the primary benefit of gro u p decision making in a balanced score c a rd context is elim-inating inappropriate ideas, not introducing appro p r i a t e or innovative ideas. Although these results may be
par-tially attributed to the fact that the participants in our study met only once as a group, thereby limiting their o p p o rtunity to brainstorm and debate, the results still suggest the potential limitations of group decision mak-ing in a balanced score c a rd settmak-ing.
In essence, the team dynamic resulted in good-quality but fairly mainstream ideas. This is a critical finding given that the purpose of strategic thinking is to generate solutions that provide competitive advantage. F i rms are said to have a competitive advantage when they have implemented a strategy that is unique, novel, or difficult to re p l i c a t e .1 5If the team process results in
s c o re c a rd objectives and metrics that are mainstre a m , they are likely to be similar to those of others in the same industry. In this case, rather than contribute to an e n t i t y ’s competitive advantage, the score c a rd may sim-ply replicate objectives and measures across diff e re n t companies, thereby reducing its positive benefits.
F rom an organizational perspective, our findings sug-gest that the information or ideas fed into the process at the beginning stage are critical to the development p rocess. In other words, while the group decision-making process may effectively filter out inappro p r i a t e ideas, it does not seem to add a significant number of i n t e resting, insightful ideas. Thus, our results highlight the importance of group composition. In part i c u l a r, g roups will not produce a sufficiently large pool of good ideas without a diverse set of individuals, each with dif-f e rent training, skills, and perspective. ■
Susan B. Hughes, Ph.D., CPA, is professor of accounting at Butler University in Indianapolis. She can be reached at (317) 940-9843 or [email protected].
Craig B. Caldwell, Ph.D., is visiting professor of manage-ment at Butler University. He can be reached at (317) 940-8154 or [email protected].
Kathy A. Paulson Gjerde, Ph.D., is associate professor of economics at Butler University. She can be reached at (317) 940-8413 or [email protected].
EN D N OT E S
1 R o b e rt S. Kaplan and David P. Norton, “The Balanced S c o re c a rd — M e a s u res that Drive Perf o rmance,” H a rv a rd Business Review, January / F e b ru a ry 1992, pp. 71-79. 2 The literature on teams and groups establishes clear diff e
r-ences between the two constructs. Teams are a variation of g roups, but groups are not always teams. For the purposes of this article, however, we use the terms “team” and “gro u p ” i n t e rc h a n g e a b l y.
3 For an extensive review of the literature on participative bud-geting, see Mark A. Covaleski, John H. Evans, III, Joan L. Luft, and Michael D. Shields, “Budgeting Research: Thre e T h e o retical Perspectives and Criteria for Selective Integra-t i o n , ”J o u rnal of Management Accounting Researc h, 2003, pp. 127-141.
4 R o b e rt S. Kaplan and David P. Norton, “Putting the Balanced S c o re c a rd to Work,” H a rv a rd Business Review, September/ October 1993, pp. 134-147.
5 R o b e rt S. Kaplan and David P. Norton, “Using the Balanced S c o re c a rd as a Strategic Management System,” H a rv a rd Busi-ness Review, January / F e b ru a ry 1996, pp. 75-85. Other evidence of the use of groups in score c a rd development is found in Andra Gumbus and Bridget Lyons, “The Balanced Score c a rd at Philips Electronics,” Strategic Finance, November 2002, pp. 45-49.
6 For “group think,” see Brian Mullen, Tara Anthony, Eduard o Salas, and James E. Diskell, “Group Cohesiveness and Quality of Decision Making: An Integration of Tests of the Gro u p-think Hypothesis,” Small Group Researc h, May 1994, pp. 189-204; for “group polarization,” see Craig McGart y, John C. Tu rn e r, Michael A. Hogg, Barbara David, and Marg a ret S. We t h e rell, “Group Polarization as Conformity to the Pro t o-typical Group Member,” British Journal of Social Psychology, M a rch 1992, pp. 1-20.
7 This view is widely held. For example, see the work of Steven P. Robbins, O rganizational Behavior, 10th ed., Pre n t i c e - H a l l , Upper Saddle River, N.J., 2003.
8 For an early version of this argument, refer to Norman R. M a i e r, “Assets and Liabilities in Group Problem Solving,” Psychological Review, October 1967, pp. 239-249.
9 Although considerable work has subsequently been done on the concept, the original idea of the assembly bonus effect can be traced to Barry E. Collins and Howard Guetzkow, A Social Psychology of Group Processes for Decision Making, John Wiley & Sons, New York, N.Y., 1964.
1 0 For the two perspectives on this issue, see the work of R. Scott Tindale and James R. Larson, “It’s Not How You Frame the Question, It’s How You Interpret the Results,” J o u rnal of Applied Psychology, Febru a ry 1992, pp. 109-110; and Larry K. Michelsen, Wa rren E. Watson, Albert Schwartzkopf, and R o b e rt H. Black, “Group Decision Making: How You Frame the Question Determines What You Find,” J o u rnal of Applied P s y c h o l o g y, Febru a ry 1992, pp. 106-108.
1 1 Carsten K. W. De Dreu and Michael A. West, “Minority Dis-sent and Team Innovation: The Importance of Participation in Decision Making,”J o u rnal of Applied Psychology, December 2001, pp. 1191-1201.
1 2 David M. Schweiger, William R. Sandberg, and James W. Ragan, “Group Approaches for Improving Strategic Decision Making: A Comparative Analysis of Dialectical Inquiry, Devil’s A d v o c a c y, and Consensus,” Academy of Management Journ a l, M a rch 1986, pp. 51-71.
1 3 I b i d.
1 4 Wesley M. Cohen and Daniel A. Levinthal, “Absorptive Capacity: A New Perspective on Learning and Innovation,” Administrative Science Quart e r l y, March 1990, pp. 128-152. 1 5 Michael E. Port e r, Competitive Advantage: Creating and