Journal of Information Technology and Computer Science Volume 3, Number 2, 2018, pp. 159-168
Journal Homepage: www.jitecs.ub.ac.id
Determining Optimum Production Quantity on
Multi-Product Home Textile Industry by Simulated Annealing
Gusti Eka Yuliastuti1, Agung Mustika Rizki2, Wayan Firdaus Mahmudy3, Ishardita Pambudi Tama4
123
Computer Science, Faculty of Computer Science, Brawijaya University
4
Industrial Engineering, Faculty of Engineering, Brawijaya University
{[email protected], [email protected], [email protected], [email protected]}
Received 26 Agustus 2018; accepted 24 October 2018
Abstract. Production planning is a plan aimed at controlling the quantity of products produced. Production planning is very important to be carried out by the company so that the production will always be controlled. It is very difficult to plan production with a variety of product variations because each product certainly has a different demand value from its customers. This has become a complex problem so an algorithm is needed to overcome these problems. Simulated Annealing can produce optimal solutions more effectively and efficiently. Production cost generated by applying Simulated Annealing is Rp. 6,902,406,000, - for all types of products, which better than existing condition.
1.
Introduction
The industrial field in Indonesia has experienced tremendous rapid development, especially in manufacturing. This certainly can have an impact on increasingly fierce competition between companies. In fact, each company has almost the same goal of wanting to always meet consumer demand. However, the company cannot get rid of one of the problems that must be faced, namely stochastic consumer demand or can be said to be always changing. Every company must be able to overcome these problems so that consumers do not switch to other competing companies. From these basic problems, indirectly every company is required to increase its production effectively and efficiently to meet consumer demand [1].
In conducting production planning, there are things that need to be done first, namely forecasting consumer demand for the coming period. Consumer demand for the coming period can be predicted using reference to consumer demand data in previous periods as a basis for forecasting. In this research, consumer demand forecasting will be carried out using a simple method of linear regression. After obtaining the results of the consumer forecasting, then enter the production planning stage.
160 JITeCS Volume 3, Number 2, 2018, pp 159-168
impact on the production costs incurred as well as the profits obtained by the company.
There are many algorithms that can be applied to solve these problems, one of which is the Simulated Annealing algorithm. In several previous studies, the Simulated Annealing algorithm was used to overcome scheduling problems. The performance of the Simulated Annealing algorithm is evaluated by scheduling industrial processes from multipurpose batch factories in the pharmaceutical industry [3]. The research results obtained by them show that Simulated Annealing consistently provides better results for a number of realistic examples than simple heuristics in an acceptable calculation time. Although Simulated Annealing is classified as a simple algorithm but it is quite effective in solving optimization problem [4].
In addition, research in production scheduling mainly involves one criterion to be optimized by Loukil et al.[5] which discuss the problem of production scheduling in flexible (or hybrid) work with certain limitations. These limits are batch production; there are two steps: the production of several sub-products followed by the assembly of the final product; possible overlap for the processing period of two consecutive operations of the same job. At the end of the production step, different objectives must be considered simultaneously, between makespan, average completion time, maximum delay, average delay. The research is based on real case studies of a Tunisian company. They applied the Simulated Annealing multi-purpose approach to overcome these problems and propose to managers an estimate of a series of efficient schedules. The numerical results obtained are optimal.
Taheri et al. [6] has conducted research related to the implementation of Simulated Annealing to optimize time, cost and quality in the critical chain method. Simulated Annealing algorithm has been tested several times with all kinds of conditions and proven optimal results are obtained. Based on previous researches with quite good results, the authors will also apply Simulated Annealing algorithm to solve multi-product production planning problems.
2.
Production Planning
Production planning is the organization of all things concerning workers, materials, machinery and other equipment as well as the capital needed to produce goods or services in a certain period in the future according to the predicted [7]. Broadly speaking, there are three classifications of production planning including: long-range, medium-range, short-range. In this study, the planning that will be carried out includes the medium-range. Medium-term planning includes aggregate planning and production or operations scheduling. This medium-term planning includes making decisions and actions that cannot be completed in a short time, even though the decision is not for a very long time [8].
In carrying out production planning there are 3 main problems, namely: demand, capacity and costs [8]. These three things need to be considered to achieve optimal solutions with minimum costs.
Gusti Eka Yuliastuti et al., Determining Optimum Production … 161
use a mixed strategy on the grounds that there are several parameters to be considered, including: demand, production, working time, overtime, supply and others.
3.
Case Study
The case study that will be completed in this study is a home textile company that produces school uniforms as many as 18 types of products including superiors and subordinates. In each type of product there are 8 different sizes. Production planning for each type of product is carried out for the coming period for 12 months. To determine the level of production in the coming period is quite difficult because there are more than one type of product and also each product is done by different workers. Besides that, consumer demand for each product is also different and always changing. This is quite difficult for company to produce on all types of products. It is quite difficult for company to consider various parameters and adjust the rules that apply in achieving optimal solutions. The optimal solution that the company wants is that consumer demand is met with minimal production costs.
In this study using parameters that are considered in the company, among others: number of workers (n), the average amount of production per worker in 1 day at regular time (rt),) the average amount of production per worker in 1 day at a time overtime (ot), the average amount of production per worker in 1 day on subcontracting (sc), working hours in 1 day on regular time (jrt), maximum overtime (jot), maximum limit of subcontracted workers (msc), production costs at regular time (brt), production costs in overtime (bot), production costs in subcontracting (bsc), number of workers recruited (rp), average amount of production per new worker in 1 day (prp), cost recruit workers (brp), the number of workers laid off (mp), the cost of laying off workers (bmp), the number of production shortages (kp), the amount of production in storage (i) and the storage costs for each product i (bi).
There are standard rules and fees applied to this company, including: the number of initial workers as many as 6 people, the maximum limit of subcontracted workers is 3 people, the average production of each worker in 1 day on a regular basis is 14 products, the average production each worker in 1 day at 5 products overtime, an average production of each worker in 1 day on subcontracting as many as 14 products, maximum storage limit of 1000 products, minimum production limit of 1000 products, production costs at regular times of Rp. 23,000, - for each product, the production cost in overtime is Rp. 25,000, - for each product, the production cost of the subcontract is Rp. 24,000, - for each product, the storage fee is Rp. 500, - for each product, the cost of recruiting workers is Rp. 2,400,000, - for each person, the cost of laying off workers is Rp. 500,000 for each person and the assumed cost is a loss of Rp. 30,000, - for each minus value in storage.
To know the best result value, we have to compare the one solution with another. The parameter to be compare it is not only the total of cost production but in addition we have to count the mistake that will happen on each solution. So, the authors define a special formula to get the best result production planning. A special formula detail will be explained on the next chapter.
4.
Simulated Annealing
162 JITeCS Volume 3, Number 2, 2018, pp 159-168
annealing process. If it is analogous, when heating a metal then cooling it, it produces good quality crystals. Conversely, if the material from the metal is cooled rapidly, then the formed crystal is imperfect. This algorithm mimics the cooling process by gradually decreasing the temperature so that it converges in freezing and stable conditions.
There are several parameters used in the Simulated Annealing algorithm, among others: the state of the system, energy, temperature and cooling rate [11]. The state of the system is defined as a possible solution. Energy is defined as a large objective function of a combination of system conditions or can also be called an objective value. Temperature is a value of control that makes a state move or not. This temperature is also defined as a control parameter [12]. While the cooling rate is used in the process of decreasing the temperature of its function to find out how quickly the final solution is achieved [13]. The mechanism for resolving a problem using the Simulated Annealing algorithm is as follows:
a) Generating initial solutions
The initial solution for finding the maximum value in the function is to generate two random numbers for x1 and x2. When generating this initial solution, also determine its objective value. In addition to generating initial solutions, which also need to be determined first are the initial temperature (T0), final temperature (Tt), maximum iteration, temperature reduction factor (α) and initial objective value (E).
b) Looking for new solutions
Looking for new solutions by generating two random numbers again and simultaneously calculating the objective value of the new solution.
c) Check control parameters
At this stage, it is checked whether the control parameters need to be lowered or not. If the control parameter needs to be lowered, then go to step 4. If it is not lowered, then repeat step 2 to step 3.
d) Determine the best new solution
At this stage there will be several new solutions received, therefore one must choose the best one to replace the initial solution.
e) Evaluate new solutions
At this stage an evaluation is carried out to find out whether the new solution is accepted or not. Criteria for evaluating the solution are indicated by the formula:
ΔE = E(Xi+1) – E(Xi)
(1)
ΔE = difference in objective value
E (xi + 1) = objective value of the new solution E (xi) = objective value of the initial solution If the objective value of the new solution is smaller than the objective value of the initial solution (ΔE ≤ 0), then a new solution is accepted. But if the
After obtaining a new solution and the new solution is accepted, the control parameter is derived using the formula:
T t = α x T 0
(3)
Gusti Eka Yuliastuti et al., Determining Optimum Production … 163
α = temperature reduction factor (α <1) g) Check maximum iteration
Maximum iteration determination is used to decide whether the iteration is complete or not. If the maximum iteration is complete, it means that the best solution is the optimal solution. If the iteration is not maximum then repeat step 1 to step 7.
After we follow those steps, then we have to choose the best result. The authors can define which the best result or the worst result by using the special formula. It called special formula because its formula can be used only in this kind of problem. On the other research, they can define their special formula based on their own problem.
The importance of a special formula to assess the quality of a solution, so it can be compare between one solution with another. The special formula includes the total production costs and also the resulting penalty. Penalty is a number of conditions that can reduce the quality of a solution such as inventory value minus the meaning that the company cannot meet consumer demand, there are some rules that are not suitable for the company related to the number of workers, time of workers and so on. A special formula hereinafter referred to as the fitness value is shown as follows:
𝑇𝑜𝑡𝑎𝑙 𝑜𝑓 𝑃𝑟𝑜𝑑𝑢𝑐𝑡𝑖𝑜𝑛 𝐶𝑜𝑠𝑡𝑠
= ∑𝑟𝑡 .𝑏𝑟𝑡 + ∑𝑜𝑡 .𝑏𝑜𝑡 + ∑𝑠𝑐 .𝑏𝑠𝑐 + ∑𝑟𝑝 .𝑏𝑟𝑝
+ ∑𝑚𝑝 .𝑏𝑚𝑝 + ∑𝑖 .𝑏𝑖 (𝟒)
𝐹𝑖𝑡𝑛𝑒𝑠𝑠 𝑉𝑎𝑙𝑢𝑒=
100000000
𝑇𝑜𝑡𝑎𝑙 𝑜𝑓 𝑃𝑟𝑜𝑑𝑢𝑐𝑡𝑖𝑜𝑛 𝐶𝑜𝑠𝑡𝑠+𝑃𝑒𝑛𝑎𝑙𝑡𝑦 (𝟓)
5.
Experimental Setup and Result
The authors need to do testing for define the best result of this problem. The kind of experiment to do test this algorithm is test each parameters so it can produce best solution production value with minimal of cost and lower mistake.
A solution is a series of numbers formed in the form of random values to represent the production value of each type of product on each month. In the case study there were 18 types of products and planned for the next 12 months so there were 216 numbers. During this process, the production value of each iteration are not displayed for computational time efficiency.
First of all, the initial solution that was generated along 216 random numbers which are production capacity value. Then the authors determine the initial parameters used for testing. The testing was conducted to find out how the results of the Simulated Annealing algorithm were applied and also how the quality of the solution was produced. Some parameters of the Simulated Annealing algorithm tested include: number of new solutions, temperature values, reduction factors and maximum number of iterations.
164 JITeCS Volume 3, Number 2, 2018, pp 159-168
Figure 1. Number of New Solutions Testing Result
The highest point achieved is when the number of new solutions is raised as much as 10. The best value of 10 is saved first to do the next parameters testing. The number can produce the highest fitness value because the available solution space is wide enough so that all possible optimal solutions will be achieved. But the increasing number of new solution candidates does not guarantee that a more optimal solution will be obtained. This was proven at the point after which there was a significant decline. Then after getting the optimal amount in generating a new solution, the authors will use this amount as a reference for testing the next parameter.
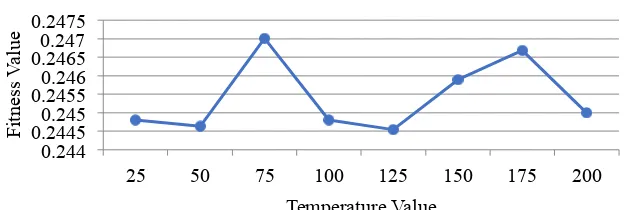
The authors conducted a testing of the temperature value using a value of 25 multiples ranging from 25 to 200. To test the temperature value, the authors uses several initial parameters namely reduction factor = 0.5 and a maximum iteration of 100. Whereas for the number of new solutions raised is as many as 10 based on the test results of the previous best parameters.
Figure 2. Temperature Testing Result
The highest point achieved is when the temperature = 75. The temperature value will affect the consideration in choosing a new solution. This temperature value will be used to test the next parameter.
The authors tested the value of the reduction factor using values ranging from 0.1 to 0.9. To test the temperature value, the authors uses some initial parameters, namely a maximum of 100 iterations. As for the number of new solutions generated are 10 and also the value of the temperature used is 175 based on the results of the previous
Gusti Eka Yuliastuti et al., Determining Optimum Production … 165 will be used to test the next parameter.
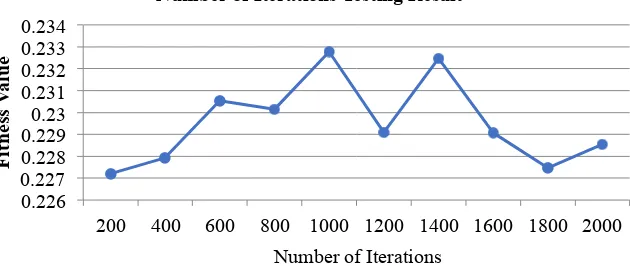
The authors tested the maximum number of iterations using values ranging from 200 to 2000. To do the maximum number of iterations, the authors uses some initial parameters that have been obtained from the results of the previous best test, namely the number of new generated solutions as much as 10, the value of temperature = 75 and reduction factor = 0.6.
Figure 4. Number of Iterations Testing Result
The highest point is the best number of maximum iterations of 1000 iterations. The maximum number of iterations really determines the final solution generated by Simulated Annealing because in each iteration there is a possibility that a new solution is selected and the more iterations, the greater the possibility of a final solution change.
166 JITeCS Volume 3, Number 2, 2018, pp 159-168
1385, 828, 664, 1599, 1981, 2156, 2121, 745, 1680, 1239, 2072, 2716, 1305, 2773, 1638, 914, 2756, 2579 , 2523, 2939, 2711, 2502, 1092, 695, 281, 785, 962, 380, 481, 837, 398, 942, 986, 731, 1147, 936, 483, 557, 474, 1076, 1170, 389, 1030 , 1129, 524, 1132, 519, 789, 759, 1171, 1121, 270, 1144, 426, 308, 297, 348, 701, 213, 851, 731, 216, 577, 326, 756, 1847, 1135, 787, 1076, 1169, 1479, 533, 1622, 1420, 1882, 721, 1920, 1113, 813, 1222, 750, 1573, 1746, 1542, 2509, 972, 626, 2607, 1225, 1025, 978, 1065, 401, 563, 1206, 1266, 601, 739, 855, 978, 559, 965, 1076, 483, 285, 595, 974, 1100, 450, 652, 657, 1270, 579] for 18 products with a total production cost of Rp. 6,902,406,000, -. A series of these numbers shows the amount of production for each product in each month.
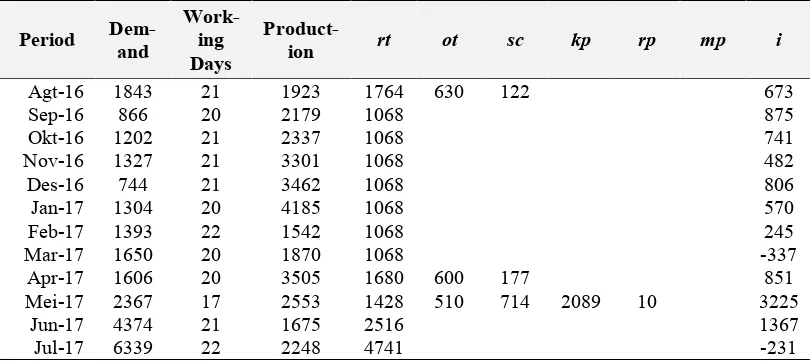
The author provides an example of the calculation of production costs using an aggregate planning table using one type of product namely with production values: 1923, 2179, 2337, 3301, 3462, 4185, 1542, 1870, 3505, 2553, 1675, 2248 as shown in Table 1.
Table 1 Aggregate Planning Production for A Product
Period Dem-planning which includes the number of products produced by workers on regular time and other details needed by the company. For the case study in this research there should be as many as 18 aggregate tables which show the production planning of 18 products for 12 months.
6.
Conclusion and Future Work
Gusti Eka Yuliastuti et al., Determining Optimum Production … 167
smaller production costs, its solution also considers the lack of production errors that occur.
Based on the results of the experiments that have been carried out, the application of Simulated Annealing algorithm to solve the problem of optimal production capacity in one home textile industry company is proved quite effective and efficient. It is effective because the optimal solution is the production cost and the penalty value is minimal, by utilizing company parameters that include the number of workers, working time and so on. It is efficient because the time needed to get a production capacity solution is not as long as the company did before.
This algorithm can be applied to similar problems in other companies with the criteria of products produced by the company more than one and also the parameters considered almost the same as those described earlier by the author. For further research, the author will combine Simulated Annealing algorithms with other optimization algorithms in order to obtain a more optimal solution with shorter
[2] W. F. Mahmudy, “Optimization of Part Type Selection and Machine Loading Problems in Flexible Manufacturing System Using Variable Neighborhood Search,” IAENG Int. J. Comput. Sci., no. July, 2015.
[3] W. H. M. Raaymakers and J. A. Hoogeveen, “Scheduling Multipurpose Match Process Industries with No-Wait Restrictions by Simulated Annealing,” Eur. J. Oper. Res., vol. 126, no. 1, pp. 131–151, 2000.
[6] M. J. T. Amiri, F. R. Haghighi, E. Eshtehardian, and O. Abessi, “Optimization of Time, Cost and Quality in Critical Chain Method Using Simulated Annealing,” Int. J. Eng., vol. 30, no. 5, pp. 627–635, 2017.
[7] T. B. Chistyakova, A. S. Razygrayev, and R. V Makaruk, “Decision Support System for Optimal Production Planning Polymeric Materials Using Genetic Algorithms,” in Soft Computing and Measurements (SCM), 2016, pp. 257– 259.
[8] H. J. Weiss and M. E. Gershon, Production and Operations Management, Second Edi. Massachusetts: Allyn & Bacon, 1993.
[9] J. Heizer and B. Render, Production and Operations Management Strategies and Tactics. New Jersey: Prentice Hall, 1993.
[10] S. Kirkpatrick, C. D. Gelatt, and M. P. Vecchi, “Optimization by Simulated Annealing,” Science (80-. )., vol. 220, no. 4598, pp. 671–680, 1983.
[11] V. F. Yu, A. A. N. P. Redi, Y. A. Hidayat, and O. J. Wibowo, “A simulated annealing heuristic for the hybrid vehicle routing problem,” Appl. Soft Comput. J., vol. 53, pp. 119–132, 2017.
168 JITeCS Volume 3, Number 2, 2018, pp 159-168
Simulated Annealing with the Jumping Gene Adaptations,” Adv. Process Syst. Eng., vol. 5, 2017.