PERSONAL INFORMATION
First Name: DEWA KETUT SUDARSANA Family Name: Whether attend the Conference: Yes or No
(If you can’t attend, we will send the proceeding and the receipt to you free of charge after the conference.) Position: Professor/ Associate Professor/ Assistant Professor/ Lecturer/ Ph.D Candidate/ Postgraduate/ etc..
Organization or University: Brawijaya Univesity, Malang (Ph.D student), Udayana, Bali university (lecturer), Indonesia Detailed Post Address (Important!):
Jalan Cenigan Sari IV-A , gang Mawar No.9, Sesetan Denpasar, Bali, Indonesia (80223)
City: Denpasar State: Bali Country: Indonesia Postcode: 80223
Telephone: +623618950520 Fax: 623618950520 Mobile: +6281558683131 Email: [email protected] Paper ID Code: GBMCE-3014
Paper Title: Predict of Loss of Fuel During The Road Reconstruction in Indonesia
Paper Pages: 5 Additional Page: 1
REGISTRATION FEE by US Dollar***(以下金额为到帐金额,不含手续费)
Registration Fee Your Choice (Use Arabic Numerals)
Authors (Attend the meeting, non-student)*:
450 USD
-Authors (Attend the meeting, student)*:
400 USD
-Authors (Nonattendance)* 360 USD 360 USD
Listeners: 250 USD -
Additional Paper(s)** 300 USD -
Additional Page 35USD/One Page 35 USD
Extra Proceeding 100 USD -
PREDICT OF LOSS OF FUEL DURING THE ROAD RECONSTRUCTION IN INDONESIA
Dewa Ketut Sudarsana
Student in Doctoral Civil Engineering Program, University of Brawijaya, Lecturer at University of Udayana, Indonesia
Harnen Sulistio, Achmad Wicaksono and Ludfi Djakfar
Lecturer inCivil Engineering Department, Faculty of Engineering, University of Brawijaya, Malang, East Java, Indonesia
ABSTRACT: National Roads in Indonesia are still in substandard in order continues to be reconstructed to establish connectivity Trans National and supports the Trans Asian. During the reconstruction period has negative impacts such as loss of road user costs, loss of fuel energy, and the environment. Prediction model of the fuel loss has not been studied. National road reconstruction project in Bali, Indonesia is used as a case study. Analysis of fuel consumption refers to the guidelines of Highways Pd-T-15-2005-B, which adapts from HDM IV, 2000. Characteristics traffic during reconstruction, predicted based on the traffic characteristics on pre reconstruction condition by multiplying the adjustment factor Fq for traffic volume, Fv for speed and Fds for the degree of saturation. Average fuel loss on each road link is predicted to 144.6 liters/day. Loss of fuel during duration schedule for completing each road reconstruction predictability of 11,128 to 55,772 liters, and the loss of fuel for the 6 the link road studied is 164,075 liters.
Keywords: road reconstruction, negative impact, loss of fuel, predict
1 INTRODUCTION
In order to establish connectivity Trans Asian, Indonesian National roads are sub-standard condition still continues to do the reconstruction. During the reconstruction period has negative impact on road users and the environment. In Negara-Pekutatan road reconstruction in Bali province in fiscal year 2013 founded the capacity of the road decreased by 32%, the vehicle's speed at peak hours down from 40 km/h to 35 km/hour, the traffic volume decreases to 18% [4]. The decline of the performance traffic characteristics resulting in the loss of road users cost. Research on the loss of the road users cost during the implementation of the National road reconstruction project in the province of
Bali fiscal year 2012 founded 1.37% of the contract of physical value per day [5]. Fuel consumption cost is a component of the road users cost. In Indonesia, Predicted loss of fuel during road reconstruction cannot be done. Prediction of a loss of fuel has not been conducted, so that needs to be studied.
2 MATERIALS AND METHODS
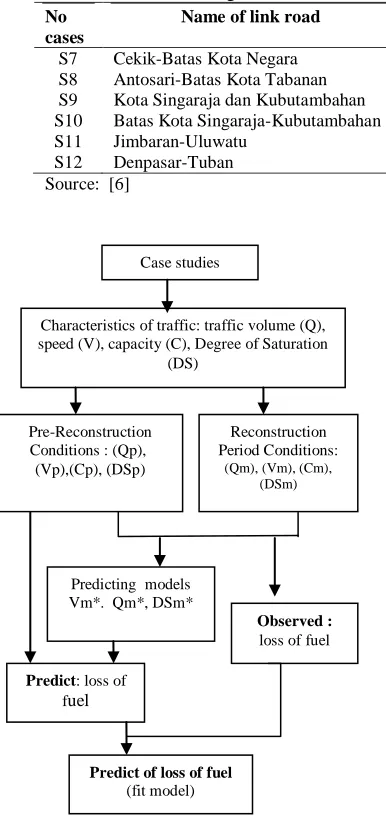
The link road be studied are presented in Table-1. Descriptive and statistical analysis used in this analysis [1]. This paper specifically analyzes predicted a loss of fuel during the road reconstruction.
Table 1. Name and length of link road No
cases
Name of link road S7 Cekik-Batas Kota Negara S8 Antosari-Batas Kota Tabanan S9 Kota Singaraja dan Kubutambahan S10 Batas Kota Singaraja-Kubutambahan S11 Jimbaran-Uluwatu
S12 Denpasar-Tuban Source: [6]
Fig. 1 Framework of analysis
The formulation of fuel consumption, refer to the guidelines of Vehicle
Operating Cost (VOC) Pd-T-15-2005-B by Department of Public Works [3]. These guidelines are adapted some equations and parameters of HDM IV in 2000. Analyzes traffic performance using Indonesian Highway Capacity Manual (IHCM) 1997 guidelines [2]. The framework of the analysis phase is presented in Figure 1.
3 DATA AND ANALYSIS
The characteristics of traffic related to the prediction of fuel consumption are the volume (Q), speed (V) and the degree of saturation (DS). DS is the ratio between the volumes (Q) with a capacity (C). The capacity of urban road can be determined in equation (1) [2].
C = Co x FCw x FCsp x FCsf x FCcs . (1)
Where:
C = actual capacity (pcu/h) Co = capacity of the ideal conditions (pcu/h)
FCw = road width adjustment factors FCsp = separator adjustment factor FCsf = side friction adjustment factor FCcs = city size adjustment factor
Traffic characteristics on pre reconstruction denoted by p, so it can be written Qp, Vp, DSp. During the reconstruction period is denoted by m, so it can be written Qm, Vm, DSm. Average of traffic characteristic values for 6 link roads case study, denoted by r, so that the pre reconstruction conditions can be written Qpr, Vpr and DSpr, while during reconstruction are Qmr, Vmr and DSmr. The graph in Figure-2 it can be seen the average of the volume value of Qpr and Qmr. Figure 3 is a graph of the speed average value of Vpr and Vmr, and Figure 4 is a graph of the degree of saturation average value of DSpr and DSmr
.
Predict: loss of fuel
Observed : loss of fuel
Predicting models Vm*. Qm*, DSm*
Case studies
Characteristics of traffic: traffic volume (Q), speed (V), capacity (C), Degree of Saturation
(DS)
Pre-Reconstruction Conditions : (Qp),
(Vp),(Cp), (DSp)
Reconstruction Period Conditions:
(Qm), (Vm), (Cm), (DSm)
Fig.2 Average traffic volume Qpr (pcu/ h), Qmr (pcu/h) and the volume adjustment factor Fq, by hour of day
Fig.3 Average speed Vpr (km/h), Vmr (km/h) and the speed adjustment factor Fv, by hour of day
Fig.4 Average Degree of Saturation DSpr, DSmr and Degree of Saturation adjustment factor Fds, by hour of day
3.1Traffic volume Qp-Qm relationship The average traffic volume on pre reconstruction (Qpr) with during reconstruction (Qmr) relationship can be
seen in Figure 2 and can be determined as in equation (2).
Qmr = Qpr x Fq ... (2) .
Or
Fq = Qpr/ Qmr Where:
Fq = traffic volume adjustment factors’
Fq values are presented in Figure-2. Based on the Fq values, then the traffic volume during reconstruction (Qm*) can be predicted as in equation (3).
Qm* = Qp x Fq ... (3)
3.2 Speed Vp-Vm relationship The average of vehicle speed on pre reconstruction (Vpr) with during reconstruction (Vmr) relationship can be seen in Figure 3 and can be determined as in equation (4)
Vmr = Vpr x Fv ... (4)
Or
Fv = Vmr / Vpr Where:
Fv = speed adjustment factor
The value of the speed factor Fv is presented in Figure 3. Based on Fv values it can be predicted the speed on during reconstruction (Vm*) as in equation (5).
Vm* = Vp x Fv ... (5)
Where:
Vm* = prediction of speed during reconstruction (km/h)
Vp = speed of pre reconstruction (km/h) Fv = speed adjustment factor
The average degree of saturation on pre reconstruction (DSpr) with during reconstruction (DSmr) relationship can be seen in Figure 4 and can be formulated as in equation (6). formulated as in equation (7).
DSM * = DSP x Fds ... (7)
Where:
DSm* = Prediction of degree of saturation on during reconstruction
DSp = Degree of Saturation on pre reconstruction
Fds = adjustment factor of the degree of saturation, see Figure -4.
3.4 Fuel consumption
The fuel consumption for each vehicle
AR is average of acceleration can be
calculated by equation (9):
AR = 0.0128 x DS ... (9)
Standard deviation of acceleration (SA) is determined from the equation (10): SA = SA max (1.04/(1+ e (a0 + a1)*DS) difference in fuel consumption on during reconstruction (KBBMm) reduced by the fuel consumption on pre reconstruction (KBBMp), and can be formulated as in equation (11).
KBBM = KBBMm = KBBMp ... (11)
By substituting the traffic characteristics on pre reconstruction (Qp, Vp, DSp) and the model prediction of the reconstruction (Qm*, Vm*, DSm*), into the equation (8), (9),) (10) and (11), then KBBM prediction equation obtained as in equation (12).
3.6 Analysis of loss of fuel
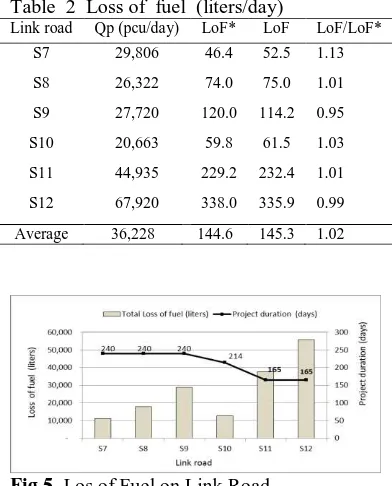
with observational (LoF) is presented in Table-2. The average of LoF* prediction found was 144.6 liters/day, while the average of loss of fuel by observed was 145.3 liters/day. In Table-2 also presented the ratio between LoF with LoF* (RLoF = LoF/LoF*). Average ratio RLoF found was 1.02 (there is a 2% difference). It can be said that the model prediction equation (12) is the fit model. The total loss of fuel prediction each link road for the scheduled duration of the project D (days) is presented in Figure-5. The total loss of fuel each link road ranged from 11,128 to 55,772 liters, and the total loss for the 6 link roads is 164,075 liters.
Table 2 Loss of fuel (liters/day)
Link road Qp (pcu/day) LoF* LoF LoF/LoF* S7 29,806 46.4 52.5 1.13 S8 26,322 74.0 75.0 1.01
S9 27,720 120.0 114.2 0.95 S10 20,663 59.8 61.5 1.03
S11 44,935 229.2 232.4 1.01 S12 67,920 338.0 335.9 0.99
Average 36,228 144.6 145.3 1.02
Fig 5. Los of Fuel on Link Road
4 CONCLUSION
The characteristics of traffic during road reconstruction correlates with the prediction of a loss of fuel such as volume, speed and degree of saturation can be predicted based on the traffic characteristics on pre reconstruction by
multiplying the volume adjustment factor Fq, the speed adjustment factor Fv and degree of saturation adjustment factor Fds. The results of a loss of fuel using the prediction model compared with the observed, differences were found 2% only, it can be said that the prediction model has the fit model. An average of a loss of fuel by prediction on each road link was found as 144.6 liters/day. Total of losses of fuel prediction during reconstruction by 6 link roads is 164.075 liters.
REFERENCES
[1] Bhattacharyya, G.K. and Johnson, R.A., 1977. Statistical Concepts and Methods. John Wiley and Sons. [2] DPU (Departemen Pekerjaan Umum)
1997. Manual Kapsitas Jalan di Indonesia (MKJI).
[3] DPU (Departemen Pekerjaan Umum). 2005. Pedoman Perhitungan Biaya Operasi Kendaraan, Nomor: Pd.T-15-2005-B, Puslitbang Prasarana Transportasi
[4] Sudarsana Dewa Ketut, Harnen Sulistio, A Wicaksono dan Ludfi Djakfar. 2013. Kajian Kinerja Jalan Akibat Adanya Zona Kerja (Work Zone). Prosiding The 16th FSTPT International Symposium, UMS Surakarta, 1 – 3 Nov 2013
[5] Sudarsana Dewa Ketut, Sulistio Harnen, Wicaksono Achmad and Djakfar Ludfi, 2014. The Analysis Of Work Zone Road User Costs Due To The Delay Completion Of The Road Maintenance Project. Adv. in Nat. Appl. Sci., 8(3): 103-108 [6] Sudarsana Dewa Ketut. 2014. Model