Labor Force Shock, Development Financial Institutions, and the Current
Account Dynamics of ASEAN + 6 Countries
Ni Putu Wiwin Setyari Udayana University
Abstract
Heckscher-Ohlin-Mundell framework suggests if a country has increased the permanent labor force unexpectedly, there will be a change in the structure of production. Increases in the relative proportion of labor-intensive product demand occurs and hence decrease investment need, relatively to domestic saving, and encourage the current account surplus.
This paper tries to fill the empirical studies gap on the effects of labor force especially its utilization in the data panel of ASEAN + 6 countries using the generalized method of moments (GMM) used to capture unobserved heterogeneity and endogeneity across countries that often arise in a panel data model. The estimation result shows that the labor force is an asymmetric shock; only affect the country of origin without affecting other members in the group, although including financial institution deepening as a control variable. The analysis also indicates if the labor regulations in these countries tend to be rigid because of the speed of the current account adjustment is relatively slow.
Keywords: saving – investment, current account adjusment, and labor force shock JEL Classification: E21, F32, E24
1. Introduction
A country's current account definition as an increase in net foreign assets might be a bit confusing if the current account just thought of as sum of net exports of a country, for goods and services (where exports of services including domestic capital services abroad as measured by the level of interest and dividend payments on the asset). Keep in mind, that if a country with a positive net exports must acquire foreign assets in equal value since success to sell abroad more than buying from outside. Conversely, a country with negative net exports must have the same value of loans to finance the deficit. The balance of payments recorded country net asset sales in the capital account. Because payment for any goods and services received from foreign parties, any net exports associated with the same magnitude of negative value in the capital account. So, total net exports and capital account identical to zero. Hence the capital account surplus seen from the negative sign of the increase in net foreign asset holdings or equal to the current account (Obstfeld dan Rogoff, 1996). Sachs (1982) stressed that the current account discussion must include investment and growth therein. Empirical evidence findings here confirm if a change in investment level can explain most of the current account behavior of OECD countries.
During the 1980s most of the developing countries seem detached from the international capital markets and experience current account surplus or deficit on a small scale. Therefore, countries are referred as the Asian Tigers are not affected by the debt crisis. In fact China, Korea, Brunei, Japan and Singapore posted a current account surplus while Indonesia, Malaysia, Philippines and Thailand experienced a moderate deficit in the period 1982 and 1990. Current account deficit in Laos, Indonesia and Thailand are the highest in the group. Average deficit experienced by Indonesia and Thailand amounted to 3.2% of GDP, while Laos reached 8.5% of GDP in 1990. Starting in 1990, several developing countries began to attract foreign capital inflows, as seen from deficit on the current account. Capital inflows may affect the current account behavior through savings and investments. Current account imbalances caused by savings and investment mismatch. Period when capital inflows are generally accompanied by increased investment. If capital flows are used to increase investment, assuming a stable savings, it will result in enlargement of current account deficit.
Dynamic movement of the current account is said to be influenced by several factors. Lane (1999) found that monetary sector has significant impact on the current account in the United States. Other source that could affect the current account is the terms of trade which indicated a significant effect on the current account (Chasin and Mc Dermott, 1998). Shock itself can be comes from the specific country and outside. Several studies identify specific productivity shock as one of the main drivers of the current account movement, while the global productivity shocks had no significant effect (Glick dan Rogoff, 1995; Bussière, Fratzscher, dan Müller, 2005).
Jun and Wei (2007) presents a theory about current account adjustment that puts labor market institutional system as center of analysis. Basically an economic adjustment to the shock involves a combination of intratemporal (changes in the composition of trade in goods) and intertemporal (changes in capital flows). When labor are in a specific sector (which can be interpreted as a shock in the short term), the entire adjustment in a relatively small economy moves through capital flows. But when labor are perfect mobility in a country, each shock is reflected through changes in output composition and trade without any change in current account. Labor regulations rigidity will reduce the transition from short-term to long-term, and hence reduce the rate of convergence of the current account to GDP ratio.
with overlapping generation economy (OLG) characteristic in both countries, where every person living in two periods, working in the first period and retired when their old (in second period). Mundell thesis (1957) states if a country labor increased unexpectedly, with an abundance of labor force, it will specialize in labor-intensive products and become an importer of capital-intensive products. A change in the trade structure brings changes capital demand relatively in each country, where those country will experiencing an increase in the proportion of labor-intensive products in its total domestic production and hence decrease domestic investments. These conditions encourage the current account surplus.
The fundamental difference in this article with similar studies is the placement of labor force factors as a centre analysis. This factor is specifically said has a significant effect on the current account movement by using panel data analysis from ASEAN + 6 countries. In order to eliminate the influence of endogeneity and unobservable heterogeneity across countries which often become problem in panel data, this study uses the generalized method of moments (GMM). Considering then if international capital flows is enable to move because of the financial institution, the analysis then developed to include financial system development as a control variable and reflects the effect of monetary sector shock. The analysis showed consistency with theory and previous empirical studies. This paper is organized as follows. Chapter II discusses related theory study. Chapter III contains data and empirical strategy methodology that will be used. Chapter IV discusses the results and discussion, while Chapter V is conclusion.
2. Theory Review
The theory used refers to Jin (2012). Each country is assumed to have same technology to produce intermediate goods traded freely and without any cost. Among these items are combined to produce a group of goods that are used for consumption and investment. Preferences and production technologies owned assumed to have same structure and parameter values between countries. However, the technology used is different in two aspects, namely: 1) in each country only use domestic labor, and 2) intermediate goods supply depending on the specific productivity and labor changes.
Production technology assumed identical in each country, using capital and labor to produce intermediate goods. Production of intermediate goods i in country j is:
i unit of goods used for consumption and investment.
2)
where capital is used to produce goods i in country j augmented by investment, , and capital
stock, . Capital stock function is expressed as:
On the consumer side, in period t, a number of consumers born in country j, so the increase in consumer becomes:
4)
At period t, a young consumer in home country, providing one unit labor and earn income wth
used to consume cty,h and to buy capital. If kih,t,j1 is the amount of capital that young consumers
buy from sector i in country j, with price q per unit, at the end of period itj t to be brought to the period t+ 1, then consumption of young consumers in home country becomes:
capital, so that the function of consumption in period t + 1 becomes:
Lifetime consumption utilities of a consumer in the country who were born at the beginning of period t will be maximum:
Intermediate goods market will be balanced if the global demand for each item i equals to its supply. If Y shows the global output of goods itg i, where
jh f The world's resources restrictions is the total number of final goods in the world, devoted to two requirements, namely consumption and capital formation:Solution for equilibrium in each country was formed based on three assumptions, namely: 1) the elasticity of substitution between goods is unitary (θ = 1), 2) consumers have a preference in a logarithmic form (ρ = 1), and 3) capital adjustment technology is a log-linear form. When θ
= 1, relative change in final result will be perfectly replaced by relative price changes so that the nominal value of final result remains constant across sectors. The second assumption simplifies the problem of consumption or savings and lead to private savings is not dependent on the real interest rate yields. While the third assumption describes the use of capital in the form of specifications to produce an item of goods i in the country j at period t is influenced by investment goods and capital stock at that period. Implication of these three assumptions combination is the total investment-output ratio and the industry level investment-output ratio become constant.
Based on these assumptions, the evolution of the capital stock in each sector, i, in each country, j, is determined only by the present discounted value of the expected commodity i
produced domestically. Allocated part of global investment in industry i is then determined based on the value of the weight proportion of the capital, where the greater weight of the proportion of capital in industry i relative to the average weighted proportion of capital, the greater portion of the global investment coming into industry i.
The portion of a country investment in industry i then becomes the key variables that determine a country capital stock evolution and investment. This means that the larger country j
produce goods i will lead to greater investment in product i is allocated to country j. Investment in any country is not only associated with the size of the expected production but also the composition of production, where the greatest weight is given to the production of capital-intensive goods (composition effect). In contrast to one sector model, relative size of country's production viewed from the portion of goods production that only produced globally. The presence of positive shocks in the form of an increase in technology or labor force permanently from abroad which effectively increase the share of overseas production globally will lower the domestic investment (convergence effect).
The economic value of Net Foreign Assets (NFA) is equivalent to labor saving value of youths, less the of capital stock value required in national production in same period. A country current account (CA) in period t is defined as the change in NFA in period t-1 and t, which can be written as follows:
��� = � ��− � ��− 13)
If a country experienced a rapid increase in labor (productivity), then there is an increase in the income earned by young population, which is the saver in the economy. Because the interest rate yield in each country is same for all periods, as a consequence of the same production technology, saving will be allocated both at home and abroad, which led to capital outflows. These conditions can reflect in the current account surplus.
Factor intensity ratio, kt = Kt/Lt, a country is a reflection of the country's comparative advantage. Decreasing in kt because of high productivity or increasing in labor force make the country has greater comparative advantage in labor. Therefore, this country will specialize in products that are labor intensive. Country with labor-intensive industries structure will have a larger portion of savings compared to share of investment in its GDP. Intersection point where domestic savings (which is provided by young population) sufficient to meet domestic investment needs will bring capital - labor ratio balance. Positive shocks in labor force will reduces kt in periode t, causing changes in production composition lead to increase saving exceed investment demand.
Capital flows as a consequence of globalization or shocks on labor and productivity is described by Jin (2012) with the following proposition. Suppose there are two countries which initially is autarky and open in period t, then the current account (ratio to GDP) in period t
becomes:
��� =
� +� −�
� ( +� −∅+� )+ 14)
where β shows the discount factor and 0 <β < 1. Sk is the weight proportion of the average capital, sl s the weight proportion of the average labor force, and the value > 0. If all countries open in period t, positive shocks due to increasing number of labor force will reduce capital - labor ratio in period t, which causes a change in saving composition to be higher than investment needs. This difference will increase NFA stock and encourage for capital outflows.
� �� =
� +� −
� ( +� −∅+�)+ 15)
Hence the proposition model developed by Jin (2012) explicitly suggests that larger current account deficit in countries that increasingly specialize in capital intensive production when international trade is opened.
II.2 Some Empirical Results of Previous Studies
Several previous studies attempt to identify some of variables that can be a source of shock to the current account. Cashin and McDermott (1998) examine the relationship between the terms of trade shock on savings and current account position. It said if the relationship between these variables is ambiguous. Shock in the terms of trade may worsen or improve the current account position depending on whether the income effect result is greater or smaller than substitution effect. The relative relationship of substitution effects are estimated using data of five OECD countries over the period 1970-1995. The results suggest large and significant effect of this shock on the current account.
Glick and Rogoff (1994) develop an empirical model of investment and current account then applied to the G7 countries data. The results show the difference between global and specific country shock can explain the current account behavior. One puzzle that arises then the current account response to the specific country shock is smaller than response given by the investment.
Lane (1999) indicates that monetary shock could push the current account imbalances. Using VAR analysis, monetary shock results obtained significant effect on the US current account. VAR analysis is also used by Lee and Chinn (2002) in seven countries, namely the United States, Canada, Britain, Japan, Germany, France, and Italy. Their analysis result showed a temporary shock plays a greater role in explaining the current account balance variation, while permanent shock can explain more the exchange rate variation. Temporary shock will improve the current account position. One of the assumptions used in the analysis that global shock has no effect on the current account, and only influenced by country-specific shock.
Sek and Chuah (2011) test current account dynamism in some Asian countries to analyze determinant variables in explaining current account movement, especially exchange rate effect. This research is motivated by changes in the current account of several Asian countries, from deficit to surplus after the 1997 crisis. By using SVAR analysis, estimation results indicate if exchange rate does not affect the current account after the crisis. The main determinant in the current account movements are real shock and CPI. In addition to the analysis by Sachs (1982) asserted if relationship between exchange rate and current account should be examined more closely, because relationship between current account and depreciation can be proved in a large economy OECD countries, but not for other European countries which are relatively small.
3.Data and Empirical Strategy
Due to specialization and industrial restructuring takes time, it is advisable to use a minimum five-year time frame when doing analysis. This study uses time period from 1990 to 2012. Data are taken from the World Development Indicator publication from World Bank and IMF. Included in ASEAN + 6 are all member of ASEAN, except Myanmar because of data limitations, plus six other countries, namely India, Japan, Korea, China, Australia and New Zealand. Six countries latter, along with ASEAN, have agreed to cooperate more comprehensive regional economy, known as the Regional Comprehensive Economic Partnership (RCEP), as an effort to improve their ability to deal with the global economy.
As concluded in the beginning, a shock in labor force will encourage a country more specialized in labor-intensive sectors in its industrial structure. It will respond by increasing exports of capital intensive products in countries that tend to have greater capital to be exchanged in international trade. If all countries open in period t, a positive shock due to increasing number of labor force will reduce capital - labor ratio in period t, which causes a change in the composition of savings to be higher compared to the investment needs. Therefore the capital will tend to flow out into country that specializes in capital-intensive products.
Shock itself has two characteristics (Bajo-Rubio and Roldan, 2011):
1. In which sector that shock occurs, so that it can be distinguished between monetary shock (which reflect changes in the money supply or money demand), real shock (which occurs because of public sector deficit and aggregate demand), supply shock (caused by presence of changes in prices or wages, as well as labor force or productivity) and external shocks (ie changes that occur from abroad, either in monetary, real, and supply shocks)
In accordance with above classification, monetary and external shocks will always be symmetric, unlike real and supply shocks that can be symmetric or asymmetric. Based on the assumption countries are perfectly symmetrical, asymmetric shock impact will be equally for each member and to group as a whole. Asymmetric shock effect could be different for country in which that shock occurred compared to country in which a shock is transmitted. This is due to asymmetric shock occurs in one country can be transmitted to other countries in same sign (locomotive effect) or with different signs (a shock that would be a beggar-thy-neighbor) depending on the transmission channel.
Terminologies will used are as follows: labor force shock will be expressed by dL. To examine labor shock effect occurs, shock sources can be divided into two categories. Labor force shock that comes from internal specific country hereinafter refers to Lc, and shock from the outside or global shock, hereinafter Lw. Specific country schock is labor force growth rate of country i, meanwhile the global shock is labor force growth rate of other countries in ASEAN+6 region.
1. Shock is symmetric if : dL≠ 0
2. Shock is asymmetric if : dLc ≠ 0, dLw = 0 (originating from specific countries) 3. Shock is asymmetric if : dLc= 0, dLw≠ 0 (from abroad)
Shocks multipliers analyzes here: 1. Symmetric labor force shock:
���
�� =
���
�� =
���
�� = 16)
2. Asymmetric labor force shock:
���
��� =
��� ��� > ,
���
��� =
��� ��� < ,
���
��� =
���
��� = 17)
To see role of labor force shock multiplier to current account movement in ASEAN + 6 countries we used panel data analysis. Model as follows:
���� = � + ���� + ����+ �� 18)
where ���� is current account ratio to GDP country i in period t, while ���� is country specific labor force growth country i in period t, and ����is global labor force average growth rate. The global labor force growth rate is taken from the labor force average growth rate of countries others than country i in ASEAN+6 region. This variable is meant to see nature of the shock, symmetrical or asymmetrical, the labor force shock effects of a country to others. If both are significant labor force shock is said to be symmetric. However, if only one is significant, labor force is said to be asymmetric.
The magnitude of labor force multiplier to current account can be estimated with a dynamic panel data. Model transformation into:
���� = ����,�− + ���� + ����+ ��+ �� 19)
gives information about the speed of the current account adjustment in response to imbalances due to shocks. The magnitude of multipliplier effect of country-specific labor force shock seen from number of , while the multiplier effect of global shock seen from the magnitude of . �� capture variation effects that have not change across times. uit value is assumed to have a finite moment and E(uit) = E(ujt ujs) = 0 for t ≠ s
There are two sources of problems in dynamic panel model above, autocorrelation due to the presence of dependent variables lag among independent variables, CAit-1,and the emergence of individual effects heterogeneity, ��. A technique often used to overcome this problem is generalized method of moments (GMM). The advantage of this method is able to overcome the problems caused by unobserved individual effects and endogeneity that appears in lag variables (Baltagi, 2005). That means we can assumes serial correlation absences but not have to be independent all times. Because of this assumption, the value of lag y in two periods or more can be a valid instrument in the first derivative equation. On models with T ≥ 3, then the restriction linear moment = (T-2)(T-1)/2 is:
[(�̅��− ��̅� �− )�� �−� ] = � = , … , − ; = , … , � 20)
Because of independent variables are assumed to be exogenous, all of these variables can be a valid instrument in each equation so that the form of the equation becomes:
Δ���� = �Δ����− + � Δ����+ � ∆����+ ∆ �� 21)
The equation model would eliminate the individual effects, ��, because it does not vary across time then estimatation values obtained are valid and not biased.
An estimator that uses lag as an instrument, under the assumption of white noise errors, would lose their consistency if there is serial correlation across errors. Therefore it is important to report the test statistics validity of of the instrument variables together with parameter estimation. There are three methods used (Arellano dan Bond, 1991): 1. Direct testing on second-order correlation coefficient residuals: 2. Sargan test of over-identifying restrictions, and 3. Hausman specification test.
3. Results and Discussions
IV.1 Overview of Current Account in ASEAN+ 6 countries
ASEAN is said to be one of the most diverse regions in the world with a population exceeding 600 million people. The average population growth rate of ASEAN during the period 2005 - 2012 is 1.45%. This figure was lower than the average population growth in 1980 - 1990, which reached 2.1%, while in 1990-1995 the average growth of 1.8% (ASEAN Statistical
Yearbook, 2013). Asia region recognized to have some natural obstacles. The ten ASEAN
members have very large variations in language, religion and belief, politics and history.
Large populations become an advantage for countries in this region in labor force supply. China and India have the largest labor force and continues to rise from early 1990 to 2012. However, Cambodia is a country with the highest growth rate, which amounted to 3.36% per year, followed by Singapore and Brunei with average labor force growth amounted to 2.94% and 2.90% per year.
Figure 1. Labor Force of ASEAN + 6 countries in 1990 and 2012
Source: World Bank
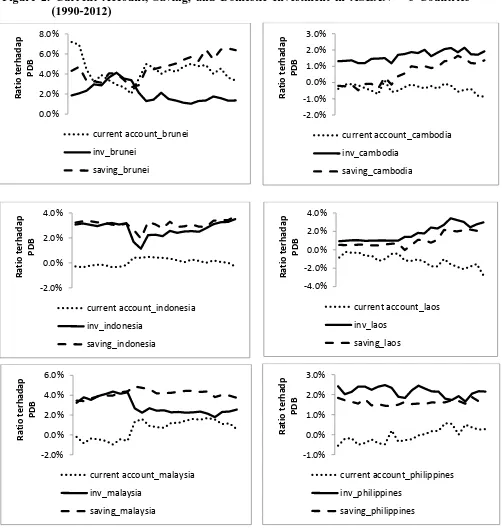
In order to provide an overview on current account in the ASEAN + 6 region, Figure 2 illustrates the movement of savings, domestic investment and the current account, in the form of ratio to gross domestic product (GDP). The first point that can be highlighted from these figures that saving ratio in some countries, such as Brunei, Malaysia and Singapore show a relatively higher level compared to their domestic investment. While countries such as Cambodia, Philippines, and Vietnam show a higher level of investment compared to saving. Investment level seen decreased almost in all countries after the end of 1990s, but began to rise again after 2001. Second, current account fluctuations are likely a reflection in investment movement compared to saving. Change from a large deficit in the current account become surplus for the period 1998 reflected domestic investment declining which is then likely lower than national saving in some countries. As can be seen that the current account surplus in particular the period of 1998 related to saving stability in Malaysia and Thailand as well as saving rate decline in Indonesia and the Philippines. Investment driver then can become variables considered in current account movement.
Contradictory condition occurs in Singapore that was able to show the current account surplus during this period, as well as saving appears to be more influence than the investment. Feldstein and Horioka (1979) state that relationship between current account and investment is evidence of financial markets opening and has nothing to do with domestic saving level. However, in their study, Caprio and Howard (1984), retest of Feldstein and Horioka thesis, discover if international capital flows are not perfect. On average, almost half of the domestic saving changes in a country (OECD) from one period to the next correlated with their current account movement.
- 200 400 600 800 1,000
Brunei Indonesia Malaysia Singapore Vietnam China Japan New Zealand
Juta Orang 2012
Source: IMF and World Bank
Patterns that emerge seem inconsistent with standard view that industrialized economy countries should export capital to developing countries. Because developing countries have high labor ratio - capital, so it should have higher marginal productivity of capital hence attract capital from industrial countries with scarce labor. Moreover, if the developing countries are expecting higher economic growth so as to catch up on industrialized countries, then there is an incentive for them to borrow capital and pushed the current account deficit (Gruber dan Kamin, 2005).
The estimation results by Moreno (2008) showed a significant negative correlation between investment and current account in the five ASEAN countries, namely Malaysia, Indonesia, Thailand, Philippines, and Singapore, in the period 1985-2005. The negative relationship was also found using data across OECD countries by Sachs (1981). However, the simple relationship between investment and current account can not provide evidence of integration degree magnitude of financial markets even if it is assumed that correlation is driven entirely by productivity shock. If the shock is permanent and country-specific, the correlation will be negative. But if there are significant global component in the productivity shock and temporary, then it could be a positive correlation (Glick dan Rogoff, 1995).
Before getting into estimation stage, panel data unit root tests must be passed to ensure each data meet random walk assumption. Testing was conducted by Augmented Dickey Fuller (ADF) and Im, Pesaran, and Shin (IPS) which assumes testing at individual level, whereas on panel data will be tested by Levin, Lin and Chu (LLC) method. ADF unit root test and the IPS techniques common to see whether there is a unit root by allowing coefficient yit-1 heterogeneity based on testing of average individual unit root. If it significant, can be said partially (or entirely) of individual do not have a unit root. Levin, Lin and Chu (LLC) assume that individual unit root tests have limited ability in testing the hypothesis with a high degree of deviation from equilibrium, particularly for panel data with small sample. LLC recommends panel unit root test better than the individual unit root test for each cross section (Baltagi, 2005). Unit root test results of variables used are presented in Table 1.
-1.0% 0.0% 1.0% 2.0% 3.0%
R
a
ti
o
t
e
rh
a
d
a
p
P
D
B
current account_new zealand
inv_new zealand
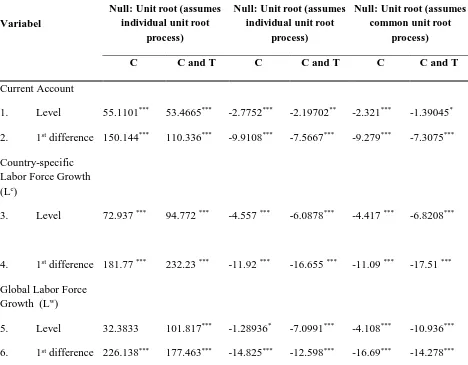
Table 1. Unit Root Tests Results
Variabel
ADF
Null: Unit root (assumes individual unit root
process)
IPS
Null: Unit root (assumes individual unit root
process)
LLC
Null: Unit root (assumes common unit root
process)
C C and T C C and T C C and T
Current Account
1. Level 55.1101*** 53.4665*** -2.7752*** -2.19702** -2.321*** -1.39045*
2. 1st difference 150.144*** 110.336*** -9.9108*** -7.5667*** -9.279*** -7.3075***
Country-specific Labor Force Growth (Lc)
3. Level 72.937 *** 94.772 *** -4.557 *** -6.0878*** -4.417 *** -6.8208***
4. 1st difference 181.77 *** 232.23 *** -11.92 *** -16.655 *** -11.09 *** -17.51 ***
Global Labor Force Growth (Lw)
5. Level 32.3833 101.817*** -1.28936* -7.0991*** -4.108*** -10.936***
6. 1st difference 226.138*** 177.463*** -14.825*** -12.598*** -16.69*** -14.278***
Note:signs *** means significant at α = 1%, ** significant at α = 5%, and * significant at α = 10%
Unit root test results indicate that the current account (ratio to GDP) and the country-specific labor force growth (Lc) was stationary, which means meet of random walk assumption at level in individual and panel model. Global labor force growth data (Lw) also stationary at level, but not for entire model.
model estimation method. Fixed effect model analyze the model by including individual-specific differences in intercept by assuming same slope and constant variance across individual panels
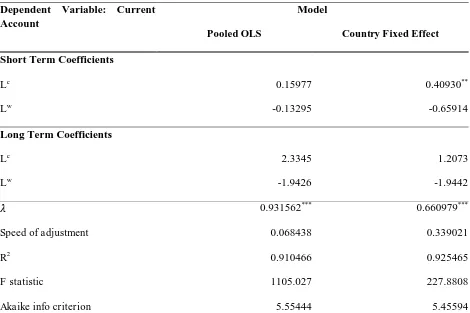
Table 2. Regression Results with OLS and FE
Dependent Variable: Current Account
Model
Pooled OLS Country Fixed Effect
Short Term Coefficients
Lc 0.15977 0.40930**
Lw -0.13295 -0.65914
Long Term Coefficients
Lc 2.3345 1.2073
Lw -1.9426 -1.9442
� 0.931562*** 0.660979***
Speed of adjustment 0.068438 0.339021
R2 0.910466 0.925465
F statistic 1105.027 227.8808
Akaike info criterion 5.55444 5.45594
Note: long-term coefficients are ( �/ − � . Signs*** means significant at α = 1%, ** significant at α = 5%, and *
significant at α = 10%
Comparison between pooled OLS and fixed effect model indicates that fixed effect is better in almost all criteria. R2 values are higher with lower AIC value indicates this model is more appropriate. λ value in line with expectations, is on 0 <λ <1, which shows short-term models will converge towards a long-term. Speed adjustment, (1-λ), the pooled OLS amounted to 0.068438, much lower than the speed of adjustment resulting from the fixed effect amounted to 0.339021. As predicted, when imposing the assumption of homogeneity will cause a rise of bias in coefficient of dependent variable lag (Pesaran, Shin, dan Smith, 1997). Hence the speed of adjustment in the fixed effect model would be higher than the pooled regression model. Adjustment speed value under 0.50 shows that the current account adjustment is relatively slow and tends to be less dynamic.
very elastic. While in short term, changes in the current account surplus amounted to 0.41% every 1% change in labor force growth. On the other hand, the global labor force shock has no effect on the current account.
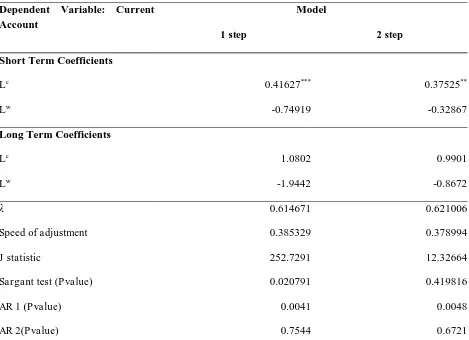
In general, the estimation results obtained from pooled and fixed effect method was satisfactory and in accordance with the theoretical predictions. However, the above model is dynamic equation thus pooled and fixed effect method does not account for unobserved endogeneity that arises because of lag variable in the regression model. Techniques that can be used to overcome this problem is generalized method of moments (GMM). Results of the analysis are presented in Table 3.
Table 3. Estimation Results of GMM Model Dependent Variable: Current
Account
Model
1 step 2 step
Short Term Coefficients
Lc 0.41627*** 0.37525**
Lw -0.74919 -0.32867
Long Term Coefficients
Lc 1.0802 0.9901
Lw -1.9442 -0.8672
λ 0.614671 0.621006
Speed of adjustment 0.385329 0.378994
J statistic 252.7291 12.32664
Sargant test (Pvalue) 0.020791 0.419816
AR 1 (Pvalue) 0.0041 0.0048
AR 2(Pvalue) 0.7544 0.6721
Note: long-term coefficients are ( �/ − � . Signs*** means significant at α = 1%, ** significant at α = 5%, and *
significant at α = 10%
The speed of adjustment of one step GMM is equal to 0.385329 while the two step GMM by 0.378994. This means about 38% of the current account gap is due to an increase in labor force will be adjusted within one period (one year). Adjustments that occurred in the current account balance into the initially pattern still relatively slow. This indicates labor regulations system in ASEAN + 6 countires tend to be rigid and less flexible in balancing the movement of labor mobility across sectors.
Overall estimation results indicates that only country-specific labor force shock has significant effect on current account, while the global labor force shock does not affect. This indicates that if the role of labor's shock is asymmetric, only affects the specific country and has not a significant impact on other countries or region as a whole. A positive sign on the Lc value support the theory put forward by Jin (2012). If a country experienced a rapid increase in labor then there is an increase in the income received by the younger population, which is a party to savers in the economy. Because of the interest rate yield rate in every country is the same for all periods, as a consequence of the same production technology, the savings will be allocated both at home and abroad, which led to capital outflows. It is reflecting on the current account surplus. These results also corroborate the thesis of the Heckscher-Ohlin-Mundell (1957). Increased the labor force in a country will encourage them to specialize in labor-intensive products and encourage capital outflows as a demand decrease for capital in the country
Coefficient of global labor force shock is negative. This means an increase in the labor force from other country (global) will push the current account deficit in a country. Different sign coefficients of country-specific labor force with global labor force indicates if the direction of labor force shock toward to beggar-thy-neighbor, in which the shock is different effect between the country of shock origin and country in which the shock is transmitted. Labor force increase that occurs in one country will push the current account surplus for this country, while its influence into the current account deficit to other countries or group as a whole.
The estimation result also indicates if global labor force shock is not specific only in one country, but has same effect for all members of the group (symmetric). These results are consistent with theoretical predictions. These results are similar to the analysis Glick and Rogoff (1992) with serial data of eight industrialized countries (OECD), which showed that the country-specific productivity shock will worsen the current account, while the global shock impact relatively small and symmetric. Bussiere, Fratzscher, and Müller (2005) also showed similar results, if the specific country productivity shock played a key role on the current account, eventhough the focus of their analysis to budget deficit effect in 21 OECD countries.
Table 4. Estimation Results OLS and FE Regression with Control Variable
Dependent Variable: Current Account
Model
Pooled OLS Country Fixed Effect
Short Term Coefficients
Lc 0.065992 0.388386*
Lw -0.439629 -0.319597
M2c -0.005332 -0.004908
M2w -0.009096 0.010566
Long Term Coefficients
Lc 0.8928 1.13809
Lw -5.9478 -0.93652
M2c -0.0721 -0.01438
M2w -0.1231 0.03096
� 0.926086 0.65874
Speed of adjusment 0.073914 0.34126
R2 0.910975 0.925553
F statistic 663.0814*** 202.845***
Akaike info criterion 5.560871 5.46688
Note: long-term coefficients are ( �/ − � . Signs*** means significant at α = 1%, ** significant at α = 5%, and *
significant at α = 10%
Table 5. Regression Results of GMM Model with Control Variable
Dependent Variable: Current Account
Model
1 step 2 step
Short Term Coefficients
Lc 0.387773** 0.551425**
Lw -0.30163 -0.480249
M2c -0.004485 -0.016448
M2w 0.013509 0.018102**
Long Term Coefficients
Lc 1.01703 1.45899
Lw -0.79110 -1.27067
M2c -0.01176 -0.04351
M2w 0.03543 0.04789
λ 0.618721 0.622052
Speed of adjustment 0.381279 0.377948
J statistic 253.3019 11.92282
Sargant test (Pvalue) 0.019586 0.290255
AR 1 (Pvalue) 0.0019 0.0015
AR 2(Pvalue) 0.5995 0.6394
Note: long-term coefficients are ( �/ − � . Signs*** means significant at α = 1%, ** significant at α = 5%, and *
significant at α = 10%
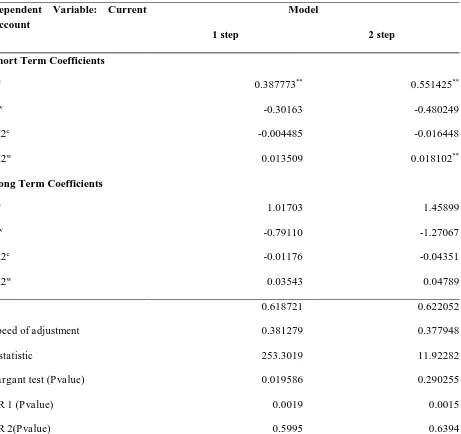
1% the amount of money circulating in the country. Dynamic multiplier value from global shock amounted to 0.018102 indicate if an increase of 1% in the money supply abroad (global) will encourage changes in a country's current account surplus amounted to 0.018%. These findings similar to results of Ferrero, Gertler, and Svensson (2008) which states that if behavior of the international variables (one of which is the current account) are relatively insensitive to monetary shock, different from what happened in domestic variables such as output and inflation. The elasticity of the current account changes caused by the monetary variables shock is relatively smaller than in case of a shock in real sector (labor force growth). Significant value to the global M2 variable indicates if the current account of a country affected by changes in policy or global monetary variables. This also shows the vulnerability of the current account movement from monetary changes in other countries or global. This means that the system of monetary policy in the country should be more preventive in anticipation of any shock that might occur abroad (global).
In accordance with Bajo-Rubio and Roldan predictions (2011) if the monetary shocks will always be symmetrical, unlike the real and supply shocks that can be symmetric or asymmetric. Based on the assumption of ASEAN + 6 countries are perfectly symmetric, symmetric shock effect would be equal both for each member country and to the group as a whole. Monetary shock can be asymmetric, affecting only one member of the group, but in practice the effect of a shock as it would be the same for the country and for other group members. This is because money markets in this group are relatively similar. In other words, the asymmetric impact of monetary shock will affect the same as symmetric shock practically.
Ratio of M2 coefficient to current account has consistently shown a negative sign, indicate that financial system development negatively affect the current account. This means an increase in the financial institutions development tend to bring the current account deficit. These results are in line with other empirical studies if the developing countries financial institutions depth negatively correlated with the investments that may result of this variable describes the existence and development of capital markets that can be accessed. That is better and more integrated financial markets will increase the country's ability to borrow from abroad (Chinn and Prasad, 2003).
7. Conclusion
Estimation model then developed to include the ratio of M2 to control the differences in financial institutions development to the current account fluctuations. The final result shows if financial institutions impact is relatively small and symmetric compared to labor force shock. Global monetary shock have a significant effect on the current account showed vulnerability of current account from global monetary changes so that domestic monetary policy system must be more preventive in anticipation of all the monetary and financial shock that may occur abroad. It is noteworthy if this analysis is done before the ASEAN Economic Community (AEC) is implemented. When AEC began, with a more free capital flows and labor migration across countries, the current account movement could be more dynamic due to reduced restrictions in the rules of employment and foreign investment.
Refferences
Arellano, Manuel and Stephen Bond. “Some Tests of Specification for Panel Data: Monte Carlo Evidence and an Application to Employment Equations”. The Review of Economic Studies, Vol. 58 (2), 1991, pp. 277-297.
Antras, P. and R.J. Caballero. “Trade and Capital Flows: A Financial Frictions Perspective”. Journal of Political Economy, Vol. 117(4), 2009, pp. 701-744.
ASEAN Secretariat. “ASEAN Statistical Yearbook”. ASEAN Secretariat, 2003 – 2014, Jakarta.
Baltagi, Badi H (2005). “Econometric Analysis of Panel Data Third Edition”. John Wiley dan Sons Ltd, The Atrium, Southern Gate, Chichester, West Sussex PO19 8SQ, England.
Bajo-Rubio, Oscar and Carmen Díaz-Roldán. “A General Framework for the Macroeconomic Analysis of Monetary Union”. January 2001.
Bussière, Matthieu, Marcel Fratzscher, and Gernot J. Müller. “Productivity Shocks, Budget Deficits, and the Current Account”. European Central Bank, Working Paper Series No. 509/August/ 2005.
Bosworth, Barry P., and Susan M. Collins, S. “Capital Flows to Developing Economies: Implications for Saving and Investment”. Brookings Papers on Economic Activity, No. 1/1999Lane, Philip R. “Money Shocks and the Current Account”. Trinity College Dublin and CEPR. February 1999
.
Cashin, Paul and C. John McDermott. “Terms of Trade Shocks and the Current Account”. International Monetary Fund Working Paper No. 177, December 1998.
Chinn, Menzie D. and Eswar S. Prasad. “Medium-term Determinants of Current Accounts in Industrial and Developing Countries: An Empirical Exploration”. Journal of International Economics 59, 2003, pp. 47–76.
Ferrero, Andrea, Mark Gertler, and Lars E.O. Svensson. “Current Account Dynamics and Monetary Policy”. National Bureau of Economic Research, Working Paper No. 13906, April 2008.
Feldstein, Martin and Charles Horioka. “Domestic Savings and International Capital Flows”. National Bureau of Economic Research, Working Paper No. 310, 1979.
Glick, Reuven and Kenneth Rogoff. “Global Versus Country-Specific Productivity Shocks and the Current Account”. Journal of Monetary Economics, 35 (1995), pp. 159 – 192.
Gruber, Joseph W. and Steven B. Kamin. “Explaining the Global Pattern of Current Account Imbalances”. International Finance Discussion Papers, No. 846, Federal Reserve System, November 2005.
Herrmann Sabine, and Adalbert Winkler. “Financial markets and the Current Account – Emerging Europe versus Emerging Asia”. Deutsche Bundesbank Discussion Paper Series 1: Economic Studies, No 05, 2008.
Jin, Keyu. “Industrial Structure and Capital Flows”. The American Economic Review, No. 102(5), 2012, pp. 2111-2146.
Ju, Jiandong and Shang-Jin Wei. “A Solution to Two Paradoxes of International Capital Flows”. IMF Working PaperWP/06/178, 2006.
Lee, Jaewoo and Menzie D. Chinn. “Current Account and Real Exchange Rate Dynamics in the G-7 Countries”. International Monetary Fund No. 130, August 2002.
Mundell, Robert A. “International Trade and Factor Mobility”. The American Economic Review, Vol. 47(3), 1957, pp. 321-335.
Moreno, Ramon. “Experience with Current Account Deficits in Southeast Asia”. in Current Account and External Financing, edited by Kevin Cowan, Sebastián, Edwards, and Rodrigo O. Valdés, Santiago, Chile. 2008, Central Bank of Chile.
Obstfeld, M. and K. Rogoff. “The Intertemporal Approach to the Current Account.”In Handbook of International Economics, Vol. 3, 1995, edited by G.M. Grossman and K. Rogoff. North Holland, Amsterdam: Elsevier Science.
.(1996).” Foundations of International Macroeconomics”. The MIT Press. Cambridge, Massachusetts. London, England.
Obstfeld, Maurice . “Does the Current Account Still Matter?” National Bureau of Economic Research, Working Paper No. 17877, 2012.
Sachs, Jeffrey. “The Current Account in the Macroeconomic Adjusment Process. National Bureau of Economic Research, Working Paper No. 796, November 1981.
Sachs, Jeffrey. “Aspects of the Current Account Behavior of OECD Economies”. National Bureau of Economic Research, Working Paper No. 859, February 1982.
Sek, S.K. and C.L. Chuah. “The Dynamic of Current Account in Emerging East-Asian: Does Exchange Rate Matter?” International Journal of Trade, Economics and Finance, Vol. 2(4), August 2011.
Wooldridge, Jeffry M. (2005). “Introductory Econometrics: A Modern Approach”.