THE IMPLICATION OF HEALTH SERVICE QUALITY TOWARDS
PATIENT OVERALL SATISFACTION AND THE IMPACT OF
SOURCES OF EXPECTATION TO THE OVERALL EXPECTATION
Luthfi Afiandi Pradipta1, Harimukti Wandebori1 1School of Business Management, Institut Teknologi Bandung, Indonesia
Email: [email protected]
Abstract
This paper aimed to explore the service quality using the variables which were identified by dagger, et al. (2007) in Hierarchical Model of Health Service Quality and probed its interaction to the patient satisfaction in Mutiara Bunda Women and Child Hospital Salatiga. The SERVQUAL method was employed as the mean to evaluate the service quality. Additionally, the sources of expectation were also being investigated to see how the patients set their initial expectation. The quantitative method would be used through a questionnaire to the patient in the hospital. The result indicated that the perception-expectation gap of health service quality in some extent significantly contributed to the overall satisfaction. The previously-determined sources of expectation also significantly contributed in shaping the overall expectation of patient. This research would contribute to the academical and practical realm in investigating the connection between service quality and customer satisfaction in the health care service industry. Furthermore, this research exhibited the novelty in which the new variables were applied in assessing the service quality by finding out the gap score. This would also increase the awareness of the hospital to improve the service quality in order to improve patient satisfaction which would lead to loyal patient cultivation.
Keywords: expectation, health care, satisfaction, service quality.
INTRODUCTION
Understanding the service quality and the customer satisfaction have been considered as a significant thing to develop the service improvement strategies. Considering the nature of health care, it encourages the patient to demand the highest quality as possible. Thus, understanding their needs, expectation, and perception is essential (Drain, 2001). Similar to the majority of service product, many studies also mentioned that in health care setting, healthcare quality and patient satisfaction have attracted extra attention in recent years. Health care quality is applied to explain which service aspects that need to be modified in order to improve customer satisfaction (Jackson and Kroenke, 1997). The satisfaction of the patient is the proper indicator to identify and measure the quality of a healthcare service provider. A number of researches have been undertaken to investigate the level of service quality in some service industries. However, the investigation to assess the service quality in health care provider with the context-specific variables is still lacking.
ISSN: 2528-617X
Salatiga, the total area of this town is 56.781 KM2. Additionally, the total population as per
the official website of the governmental statistic institution in 2014 is accounted to be 181.193 people. This town lies about 50 KM away from Semarang, which is the capital city of Central Java. Mutiara Bunda Women and Children Hospital itself is the only hospital which operates specifically for Women and Children. However, there are several general hospitals and medium-sized clinics which are owned by the government and private that give the health care service to the inhabitant in Salatiga. Due to its reputation, this hospital successfully brings in the patients from inside Salatiga as well as some cities around it. There are also many patients who are originated from Semarang, Surakarta, Yogyakarta, and many more coming to this hospital to use the service of this hospital.
The purpose of this article is to explore the perceived service quality of Mutiara Bunda Women and Children Hospital in Salatiga based on the model which has been established in previous studies. The service quality is measured by applying SERVQUAL methodologies in which the gap score of each dimension is calculated. Furthermore, it probes the effect of the perceived service quality to the satisfaction of the patient in this hospital. In addition, the sources of expectation are also being explored in order to understand how patient shape their expectation before using the service of the hospital.
LITERATURE REVIEW
A number of previous findings have been largely acknowledged in measuring the level of service quality. However, those research are mainly focused on developing the generic service quality model. Relatively few studies have zeroed on the development of context-specific service quality models, in spite of the service quality evaluations are likely to rely on the context (Babakus & Boller, 1991); (Carman, 1990); (Dabholkar, Thorpe, & Rentz, 1996). In particular, In particular, research has not directly investigated how patient assess the health service quality (Dagger, Sweeny, & Johnson, 2007). In this particular research, it is needed to construct a novel model which will explain the way patient assess the service in the hospital.
Perceived Service Quality
namely access, communication, competence, courtesy, credibility, reliability, responsiveness, security, tangibles, and understanding. Those ten key determinants, however, are made based on the general service industry. Thus, the context-specific variables in measuring the perceived service quality in health care setting need to be developed.
In the chiefly-used model of perceived service quality by Parasuraman, et al, 1985, it is stated that customer also uses the expectation as the base of evaluating the service quality. In the relating article, there are three sources of expectation which are the word of mouth, personal needs, and the past experience.
Model of Health Service Quality
In the healthcare sector, there is an urgent need for differentiation and standardization of the definitions and constructs for satisfaction and perceived health service quality and their adoption in all future health services research (Gill & White, 2009). Even though the five dimensions of service quality, namely tangibles, reliability, empathy, responsiveness, and assurance, has been widely used to measure service quality, but it obtains criticism of its ability to measure quality in every service industry (Buttle, 1996). According to the nature of health care service delivery, the satisfaction of patient is not only influenced by the medical outcome of the service but also the structure and the process of the service delivery (Donabedian, 2005). Health service quality is an important determinant of health service satisfaction (Dagger, et al, 2007). The research which is done by Dagger, et al 2007, has developed and validated a multidimensional scale to measure the service quality ofof health care service. This previous research is also studied to predict the scales implication to the service satisfaction.
Figure 1. Perceived service quality model by Dagger, et al (2007)
The model showcases that the dimensionalities which play a role in determining perceived service quality are interpersonal, technical, administrative, and infrastructure.
ISSN: 2528-617X
Further, the dimensions are elaborated into sub-dimensions that build up each dimension. The service quality instrument developed in this study can be used to monitor and improve the quality of service delivered to customers (Dagger and Sweeney, 2006).
Table 1. Explanation of dimensions of health service quality
Technical quality is also mentioned in the previous study as the component in building up the service quality. In the context of health care, technical quality is described on the basis of the technical accuracy of the medical diagnoses and procedures or the fulfillment of professional specifications (Lam, 1997). An example is given for the technical quality such as the clinical and operating skills of the doctors- the nurses familiarity with the administrations of medicines and the laboratory staffs expertise in doing the blood test (Tomes & Ng, 1995).
However, due to the lack of knowledge and expertise about the medical aspect of the patients, this aspect does not become the useful variable in describing how the patient assess the service quality of the hospital (Bowers, Swan, & Koehler, 1994).
Besides the technical quality, there is a functional quality which describes the way or manner of how the customer receives the technical quality (Seth, Deshmukh, & Vrat, 2005). In health care condition, patients usually rely on functional aspect rather than technical aspect in assessing the quality of the service which is given (Bowers, Swan, & Koehler, 1994).
Service Quality and Customer Satisfaction
The service quality is a measure of how well the service level delivered matches customer expectation (Lewis & Booms, 1983)/ Dustomer satisfaction is the customers feeling that a product/service has met or exceeded his/her expectations (Olajide, 2011). Customer satisfaction is a short-term, transaction-specific measure, whereas service quality is an
Dimension Explanation
Interpersonal The quality of communication that patient has with the staffs in the hospital, including with the doctors, medical staffs, and non-medical staffs.
Technical The excellence of the medical and non-medical staffs to perform the medical service.
Administrative The administrative aspect covers the level of easiness from the admission process, set of regulations, and process and procedures of check out.
attitude formed by long-term, overall evaluation of performance (Hoffman & Bateson, 1997). The view of the customer, or the view of the patient is crucial to monitor and improve the service quality (Badri & Attia:Ustadi, 2009). There are two prevailing arguments regarding service quality, those discuss which one influences another. Bolton and Drew, (1991) suggested that customer satisfaction as a service quality antecedent. While, Antreas and Opoulos, 2003; Cronin and Taylor, 1992; Spreng and MacKoy, 1996 argues that service quality as a customer satisfaction antecedent. Overall, both models have agreed that there is a strong relationship between the service quality and the customer satisfaction. Improvement in service quality will lead to customer satisfaction, customer retention, and positive word of mouth (Bouldinget al.1993; Reichheld and Sasser, 1990).
Sources of Expectations
In the study conducted by (Parasuraman, et al, 1985), the expectation of consumer cannot be isolated with the effect of word of mouth, past experience, and personal needs. customer expectations are beliefs about service delivery that serve as standards or reference points against which performance is judged. Because customers compare their perceptions of performance with these reference points when evaluating service quality (Zeithmal, Bitner, & Gremler, 2013). In the book of services marketing by Zeithmal, Bitner, and Gremler, the explanation of each source of expectation is listed below,
Table 2. Explanation of source of expectation by Zeithmal, Bitner, and Gramler
Sources of
expectation Explanation
Word of Mouth
Personal and sometimes non-personal statements made by parties other than the organization convey to customers what the service will be like and influence both predicted and desired service.
Personal Needs
Conditions which are essential to the physical or psychological well-being of the customer. Personal needs can fall into many categories, including physical, social, psychological and functional.
Past Experience
Uhe customers previous exposure to service that is relevant to the focal service. The service relevant for prediction can be previous exposure to the focal firms service.
IS
ISSN: 2528-617X
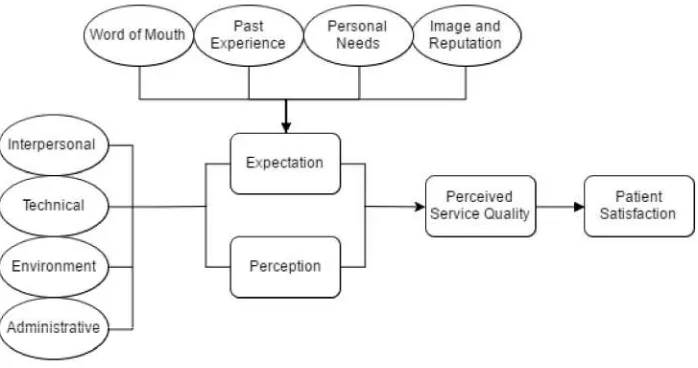
Proposed Model
This research proposed a linear model which investigated the impact of a set of components representing the service quality to the patients overall satisfaction/ Jn this case- the service quality was calculated using the model of SERVQUAL in which the gap between expectation of service and perception about the service was calculated to operationalize the score of service quality. The proposed model hypothesized that each dimension of service quality could significantly describe the variation of the patient satisfaction, as the independent variable.
In addition, the source of expectation possessed by the patient was also examined. As the four sources of expectations had already been identified in previous consideration, then this research would probe the impact of each on the overall expectation. The four sources of expectation were served as the predictors, while the overall expectation was set as the independent variable. It is hypothesized that all four of sources of expectation significantly affected to the overall expectation.
Figure 2. Proposed model
METHODOLOGY
The aim of this research was mainly to investigate the assessment of patient perceived service quality and its effect on the patient satisfaction in Mutiara Bunda Women and Children Hospital Salatiga. There was also a secondary purpose which was to investigate the sources of expectation of patient in this hospital.
Focused Group Discussion
discussion was also expected to give extra information which could enhance the level of specificness of this research to the research object. From this discussion, an additional source of expectation was identified and applied in this research. The additional variable in determining the source of expectation washospital image and reputation.
Questionnaire Distribution
The questionnaire was used to solicit the data from patients. The data that were used in the analysis solely came from the distribution of the questionnaire. In this research, the questionnaire was distributed to the inpatient as well as the outpatient in the gynecology department of Mutiara Bunda Women and Children Hospital. The gynecology department was chosen as the object as this hospital was mainly delivering the health service for maternity and womens health problem/ Jn distributing the questionnaire- non-probability sampling with purposive sampling method is applied. It means that the respondent characteristic is specified previously, that is the patient who uses the service in the department of gynecology only. The questionnaire was administered to 100 respondents and all of those were eligible for further analysis.
In the first part of the questionnaire, some questions asking about the background of respondents were given. The respondent needed to indicate their age group, educational background, and the level of income. This part of the questionnaire were aimed to explore the profile of the respondents.
The service quality questionnaire was constructed based on the statements used in the previous study of Dagger, et al, 2007. Those statements were gathered and adopted from Brady and Cronin 2001; Rust and Oliver 1994; McDougall and Levesque 1994; and Dagger,
et al2007.All of the statements belong to the four dimensions of perceived service quality of Dagger, et al, 2007, which were interpersonal, technical, infrastructure, and
administrative. However, several adjustments in the statement were made based on the previous focused group discussion and observation in order to align them with the actual circumstance of the research object.
As this research needed to find out the gap score, between expectation and reality, of each statement, then all of the statements were transformed into two sorts of question. The first question was aimed to assess the level of expectation the patient had before receiving any service, in which the respondents were asked to give a score (1 to 5) for each statement. In the other question, the respondents were asked to assign a score (1 to 5) for each statement which showed their level of perception towards service after the service encounter. In the final part, the two items of questions, which were adopted from Bitner and Hubert (1994), were given to measure the overall satisfaction of the patient towards the service of the hospital. In this part, respondents were also asked to rate the overall satisfaction (1 to 5) that reflected their feeling towards all services they had received.
ISSN: 2528-617X
to measure the effect of four indicated sources of patients expectation to the overall patients expectation. Respondents were asked to give the rating (1 to 5) to each statement in this section. The rating reflected how strong the respondent thought about the impact of each statement to their expectation. Four indicated sources of expectation were theword of mouth,
personal needs, past experience, and image which was resulted from the focused group discussion. In the final part of this questions, the respondent was asked about the extent to which they had an expectation before using the service of this hospital. In this single question, respondent would assign a range of score from 1 to 5, which indicated how high their expectation towards the services.
Data Analysis
A pilot test of thirty respondents was undertaken to examine the validity as well as reliability. Validity tests how well a developed instrument gauges the particular concept which is supposed to measure. The question is considered as valid when the coefficient of validity exceed the r-table (0,361). The result of validity test indicated that all of the questions were valid. Next, to examine the internal consistency reliability in regards to the scores obtained from the scales, the Cronbach's alpha coefficient was calculated. The Cronbach's alpha was calculated for a set of variables indicating the sources of expectation (12 items with
¡?1-913*- the set of variables reflecting the expected service )33 items with ¡?1-;39*- and a
set of variables representing the perceived service )33 items with ¡?1-;61*/ Bs the
coefficient for all of the set of variable is greater than 0,7, thus it can be considered that all variables were reliable
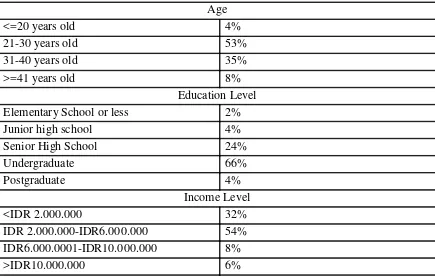
Table 3. Profile of respondent
Age
<=20 years old 4%
21-30 years old 53%
31-40 years old 35%
>=41 years old 8%
Education Level
Elementary School or less 2%
Junior high school 4%
Senior High School 24%
Undergraduate 66%
Postgraduate 4%
Income Level
<IDR 2.000.000 32%
IDR 2.000.000-IDR6.000.000 54%
IDR6.000.0001-IDR10.000.000 8%
In analyzing the data, Microsoft excel and SPSS 13 were utilized. The Microsoft Excel used to recapitulate the data obtained from the questionnaire and find out the gap score in the service quality. This software was also employed to examine the profile of respondent. SPSS 13 was used to do the regression analyses and paired T-test. The regression analyses which was employed in this research was multiple regression. This technique was utilized to search the contribution of two or more independent variables to a dependent variable. While paired T-test was undertaken to test the significant difference between two means of expectation and perception of service.
RESULTS
From the total of 100 respondents who completely filled out the questionnaire, all of them were women as the research was conducted in gynecology department. The result of respondent background is depicted in the table 3.
The result of the respondent profile as shown in the table above could describe the market segmentation of this hospital. From the result above, the hospital mainly delivers the health services to women with age between 21-30 years old, with the educational background of undergraduate, and have come between IDR 2.000.000•IDR 6.000.000.
The calculation of gap score of the service dimensions indicated that there was a quality gap in every dimension of health service quality.
Table 4. The value of each dimension of health service quality
Dimensionalities Expectation
Means
Perception
Means (PM-EM)
Interpersonal Quality 4,1380 3,936 -0,2020
Technical Quality 4,4733 4,030 -0,4433
Infrastructure Quality 4,1900 3,800 -0,3900
Administrative Quality 4,3600 3,825 -0,5350
PM : Perception means ; EM : Expectation means
ISSN: 2528-617X
The t-test is then conducted to probe whether there is a significant different between the expectation and perception in terms of interpersonal, technical, infrastructure, and administrative.
Table 5. T-test result of expected and perception of service quality
Dimensionalities Mean Std. Deviation
Interpersonal Quality 0,202 0,48032 0,04803 0,10669 0,29731 4,206 99 0,00
Technical Quality 0,44333 0,53404 0,0534 0,33737 0,5493 8,302 99 0,00
Infrastructure Quality 0,39 0,57516 0,05752 0,27588 0,50412 6,781 99 0,00
Administrative Quality 0,355 0,64628 0,06463 0,40676 0,66324 8,278 99 0,00
The outcome of the test showed that there was a statistically significant different between the patients expectation and perception towards service in Mutiara Bunda Women and Children Hospital. This was referred by the significance value (p<0,05) in every dimension of health service quality.
After the health service quality is calculated by finding the gap score in all of the health service quality dimensions, the next test was conducted. The multilinear regression was employed to see the impact of the gap of health service dimensions to the overall satisfaction of the patient.
Table 6. Multiple linear regression of service quality dimensions gap score and patient overall satisfaction
Partially, interpersonal quality and administrative quality are the ones which significantly contribute to the patient overall satisfaction. This is indicated by the significance value which is less than 0,05 (p<0,05). However, the other two dimensions, namely technical and infrastructure do not significantly contribute to the patient overall satisfaction with p>0,05. As mentioned in the table above, interpersonal quality obtains the beta value of 0,413 or 41,3%. That value is the biggest beta value among the others, which means that interpersonal quality contributes the most to the overall satisfaction.
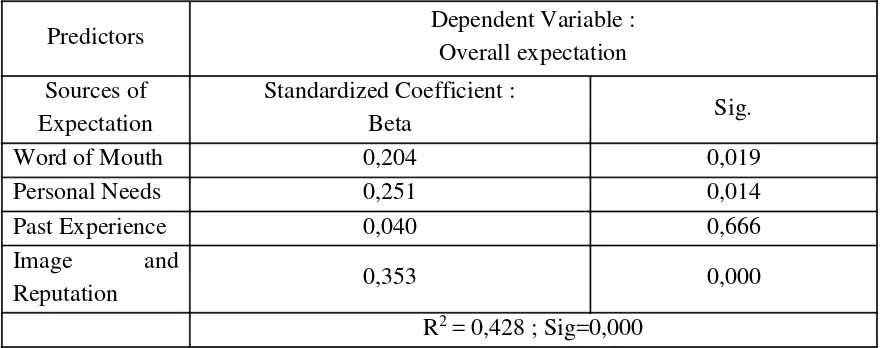
The second part of this research is about the sources of expectation and its relationship with the overall expectation of the patient. This table shows how strong each source of expectation contributed in overall expectation of patient as well as the efficacy of overall variables in explaining the patients overall expectation/
Table 8. Multilinear regression for sources of expectations and the overall expectation
Predictors Dependent Variable :
Overall expectation
Sources of Expectation
Standardized Coefficient :
Beta Sig.
Word of Mouth 0,204 0,019
Personal Needs 0,251 0,014
Past Experience 0,040 0,666
Image and
Reputation 0,353 0,000
R2= 0,428 ; Sig=0,000
The result of the research showed that the overall set of sources of expectation have a significant contribution to shaping the overall expectation of patient. The combination of four variables of the sources of expectation is able to explain 53-9& variability in patients overall expectation.
Three of the variables are significantly contributing to the overall satisfaction, they are the word of mouth, past experience, and image and reputation of the hospital (p<0,05). While, the past experience is accounted to do not have any significant contribution to the overall satisfaction. The biggest contribution to overall expectation is shown by the image and reputation of the hospital (35,3%).
CONCLUSION
ISSN: 2528-617X
From the result of the research, there was a gap in each health service quality dimension which pointed out the lack of ability of the hospital in fulfilling the patient expectation towards the service in several aspects. However, the calculated gap scores of the services of Mutiara Bunda Women and Children Hospital showed a small value (less than 1,00). It inferred that the service quality that was given by the hospital did not highly deviate from the initial expectation of patient. The gap values revealed the priorities of service improvement which had to be undertaken by this hospital. The technical quality, in this case, had the largest gap score among the others, thus the improvement in this aspect was a priority. It was observable which aspect from the health service quality that obtained more expectation from the patient by evaluating the expectation mean of each dimension. Technical quality becomes the dimension which patient put as a priority. Additionally, to evaluate which aspect had been well-performed by the hospital and appreciated better by the patient, it is observable in perception mean of each dimension. The score of technical quality also appeared as the highest score of perception. It meant that the technical quality was the dimension that was most expected by the patient, as well as the dimension which the patient perceived as the best.
In modeling the impact of health service quality using the SERVQUAL methodReichologygap between expectation and perceptionthe explanatory capacity of the newly-proposed model was relatively high in explaining the variation of patient satisfaction. The service quality instrument developed in this study can be used to monitor and improve the quality of service delivered to customers (Dagger&Sweeney, 2006). The result confirmed that improvement in service quality will lead to customer satisfaction (Bouldinget al.1993; held and Sasser, 1990). Nevertheless, not all of the dimensions were significantly impacted to the patient satisfaction. There were two out of four dimensions which significantly contributed to the patient satisfaction, specifically interpersonal and administrative quality. The insignificant influence of technical quality to the overall satisfaction is aligned with the previous study which stated that the lack of knowledge about medical things of the patient makes them hard to assess the quality of technical aspect. Thus, the technical aspect is not a meaningful variable in determining the satisfaction of patient (Bowers, Swan, & Koehler, 1994).
REFERENCES
Antreas, & Opoulos. (2003). Modeling customer satisfaction in telecommunication: Assessing the multiple transaction points on perceived overall performance of the provider.Product Operational Management, 224-245.
Babakus, E., & Boller, G. (1991). An empirical assessment of the SERVQUAL scale.
Journal, 7, 34-46.
Badri, & Attia:Ustadi. (2009). Healthcare quality and.International Journal of Health Care, 382-410.
Bayraktarogulu, & Atrek. (2010). Testing The Superiority of SERVQUAL vs SERVPERF in Higher Education.The Quality Management Journal, 47.
Bolton, & Drew. (1991). A Longitudinal Analysis of the Impact of Service Changes on Customer Attitudes.Journal of Marketing, 1-10.
Boulding, W., Kalra, A. A., Staeling, R., & Zeithaml, V. A. (1993). A Dynamic Process Model of Service Quality: From Expectation to Behavioral Intentions. Journal of Marketing Research, 7-27.
Bowers, M., Swan, J., & Koehler, W. (1994). What attributes determine quality and satisfcation with health care service.Health Care Management Review, 9, 19.
Buttle. (1996). SERVQUAL: Review, Critique, Research Agenda. European Journal of Marketing, 8-32.
Carman, J. M. (1990). Consumer perceptions of service quality: an assessment of the SERVQUAL dimensions.Journal of Retailing, 33-55.
Cronin, & Taylor. (1992). Measuring service quality: a re-examination and extension.
Journal of marketing, 56, 55-68.
Dabholkar, P. A., Thorpe, & Rentz. (1996). A measure of service quality for retail stores: Scale development and validation.Journal of the Academy of Marketing Science, 3-16.
Dagger, Sweeny, & Johnson. (2007). A Hierarchical Model of Health Service Quality Scale Development and Investigation of an Integrated Model.Journal of Service Research, 10, 123-142.
Davis, D., Guiltinan, J., & Jones, W. (1976). Service characteristics, consumer research, and the classification of retail service.Journal of Retailing, 3-21.
Donabedian. (2005). Evaluating the quality of medical car.The Milbank Quarterly, 83, 691-729.
Drain. (2001). Quality improvement in primary care and the importance of patient perception.Journal of Ambulatory Care Management, 357-65.
George, & Berry, L. L. (1981). Guidelines for the advertising of services.Business Horizons, 52-6.
ISSN: 2528-617X
Jackson, L., & Kroenke, K. (1997). Patient satisfaction and quality of care.Military Medicine
vol. 162, 273-7.
Lam. (1997). SERVQUAL: A tool for measuring patients opinions of hospital service quality in Hong Kong.Total Quality Management, 8, 145-152.
Lewis, & Booms. (1983). The marketing aspects of service quality. American Marketing Association Chicago, 99-104.
Olajide, O. P. (2011). Causal Direction between Customer Satisfaction and Service Quality: A Review of Literature.European Journal and Social Studies, 2, 87-96.
Parasuraman, Zeithaml, & Berry. (1985). A Conceptual Model of Service Quality and Its Implications for Future Research.Journal of Marketing, 49, 41-50.
Rashid, & Jusoff. (2009). Service quality in health care setting. International Journal of Health Care Quality Assurance, 5, 471-482.
Reichheld., F. F., & Sasser, W. E. (1990). Zero Defections: Quality Comes to Services.
Harvard Business Review.
Seth, Deshmukh, & Vrat. (2005). Service Quality Models: A review.International Journal of Quality & Reliability Management, 22, 913-949.
Spreng, & MacKoy. (1996). An empirical examination of a model of perceived service quality and satisfaction.Journal of Retailing, 72, 201-214.
Tomes, A., & Ng, S. (1995). Service quality in hospital care: the development of in-patient.
International of Health Care Quality Assurance, 8(3), 25-33.