ARTICLE
Identification of quantitative trait loci for cadmium accumulation and
distribution in rice (
Oryza sativa
)
Yong-Feng Yan, Puji Lestari, Kyu-Jong Lee, Moon Young Kim, Suk-Ha Lee, and Byun-Woo Lee
Abstract:Cadmium (Cd) poses a serious risk to human health due to its biological concentration through the food chain. To date, information on genetic and molecular mechanisms of Cd accumulation and distribution in rice remains to be elucidated. We developed an independent F7RIL population derived from a cross between twojaponicacultivars with contrasting Cd levels,
‘Suwon490’ and ‘SNU-SG1’, for QTLs identification of Cd accumulation and distribution. ‘Suwon490’ accumulated five times higher Cd in grain than ‘SNU-SG1’. Large genotypic variations in Cd accumulation (17-fold) and concentration (12-fold) in grain were found among RILs. Significant positive correlations between Cd accumulation in grain with shoot Cd accumulation and shoot to grain distribution ratio of Cd signify that both shoot Cd accumulation and shoot to grain Cd distribution regulate Cd accumulation injaponicarice grain. A total of five main effect QTLs (scc10for shoot Cd accumulation;gcc3,gcc9,gcc11for grain Cd accumulation; andsgr5for shoot to grain distribution ratio) were detected in chromosomes 10, 3, 9, 11, and 5, respectively. Of these, the novel potential QTLsgr5has the strongest effect on shoot to grain Cd distribution. In addition, two digenic epistatic interaction QTLs were identified, suggesting the substantial contribution of nonallelic genes in genetic control of these Cd-related traits.
Key words:rice, QTL mapping, cadmium, accumulation, distribution.
Résumé :Le cadmium (Cd) présente des risques sérieux en santé humaine en raison de sa concentration biologique au long de la chaine alimentaire. À ce jour, les mécanismes génétiques et moléculaires de l'accumulation et de la distribution du Cd chez le riz restent a` élucider. Les auteurs ont développé une population de lignées recombinantes (RIL) F7dérivées du croisement entre
deux cultivarsjaponicaprésentant des niveaux différents de Cd, ‘Suwon490’ et ‘SNU-SG1’, pour permettre l'identification de QTL contrôlant l'accumulation et la distribution du Cd. Une grande variation phénotypique a été notée tant pour l'accumulation (17×) et la concentration (12×) dans le grain au sein des RIL. Des corrélations positives et significatives ont été observées entre l'accumulation du Cd dans le grain et l'accumulation dans les tiges ainsi que le ratio de distribution du Cd entre les tiges et les grains. Cela signifie que l'accumulation du Cd dans les tiges et le ratio de distribution du Cd entre les tiges et les grains régulent l'accumulation du Cd au sein des grains chez le rizjaponica. Au total, cinq QTL a` effet majeur (scc10pour l'accumulation dans les tiges,gcc3,gcc9etgcc11pour l'accumulation du Cd dans le grain, etsgr5pour le ratio de distribution du Cd entre les tiges et les grains) ont été détectés sur les chromosomes 10, 3, 9, 11 et 5, respectivement. Parmi ceux-ci, le QTL potentiellement inéditsgr5 était celui qui avait l'impact le plus fort sur la distribution du Cd entre les tiges et les grains. De plus, deux interactions épistatiques bigéniques ont été identifiées, ce qui suggère une contribution non-allélique importante dans le contrôle génétique de ces caractères liés au Cd. [Traduit par la Rédaction]
Mots-clés :riz, cartographie QTL, cadmium, accumulation, distribution.
Introduction
Cadmium (Cd) is a nonessential heavy metal that is highly toxic to plants and humans. Arable land of considerable size has been contaminated worldwide with Cd by industrial and agricultural activities, i.e., by the application of phosphate fertilizers or sludge, irrigation with contaminated water, and emissions from smelters (Sanita` di Toppi and Gabbrielli 1999; DalCorso et al. 2008). Although Cd is not an essential element of crops, crops absorb Cd from contaminated soil or irrigation water and then translocate Cd into edible tissues (Guo and Marschner 1996; Popelka et al. 1996;Sanita` di Toppi and Gabbrielli 1999;He et al. 2006). Thus, Cd accumulated in agricultural products pose a seri-ous health risk to humans through the food chain. Rice, which is
one of the most important staple foods in Asia, is the largest source of dietary intake of Cd; therefore, the reduction of Cd accumulation in rice is an urgent need for human health.
Several techniques have been applied in Cd-contaminated paddy fields to reduce the Cd levels of rice grains, including soil dressing, application of alkaline amendments, and water manage-ment (Ishikawa et al. 2005b). However, these means are costly and have some limitations according to soil and weather conditions (Ueno et al. 2009a). Recently, phytoextraction, i.e., the cultivation of hyperaccumulator plants in a contaminated area for the re-moval of Cd from the soil, has been considered as a potential technique (Murakami et al. 2007). However, there are still prob-lems including the availability of restricted hyperaccumulator
Received 17 July 2012. Accepted 26 March 2013. Corresponding Editor: J.P. Gustafson.
Y.-F. Yan.*Department of Plant Science and Research Institute for Agriculture and Life Science, Seoul National University, Seoul 151-921, Korea; Rice Research Institute, Jilin Academy of Agricultural Sciences, Gongzhuling Jilin 136100, China.
P. Lestari.*Department of Plant Science and Research Institute for Agriculture and Life Science, Seoul National University, Seoul 151-921, Korea; Indonesian Center for Agricultural Biotechnology and Genetic Resources Research and Development, Jl. Tentara Pelajar No.3A Bogor 16111, Indonesia.
K.-J. Lee, M.Y. Kim, S.-H. Lee, and B.-W. Lee.Department of Plant Science and Research Institute for Agriculture and Life Science, Seoul National University, Seoul 151-921, Korea. Corresponding author:Byun-Woo Lee (e-mail:[email protected]).
*These authors contributed equally to this work.
Genome Downloaded from www.nrcresearchpress.com by Seoul National University on 05/26/13
plant species and unprofitable production during remediation (Pilon-Smits and Freeman 2006). Considering the substantial con-tribution of Cd in rice grain to high Cd intake in humans, breed-ing or screenbreed-ing of low Cd-accumulated rice cultivar (even growing in contaminated areas) is an effective and desirable means to reduce the Cd accumulation in grain.
Three major transport processes for rice Cd accumulation con-tribute to the divergence of Cd accumulation in grain among rice cultivars. These processes include root uptake of Cd, xylem load-ing and root-shoot translocation, and phloem transport (Uraguchi and Fujiwara 2012). Studies of quantitative trait locus (QTL) anal-yses to detect the responsible transporter genes for the processes have been carried out (Ishikawa et al. 2005a,2010;Tezuka et al. 2010). In addition to the transporters involved in long-distance Cd transport processes, several rice genes related to excess Cd stress (Uraguchi and Fujiwara 2012), particularly genes encoding ABC-type protein (Oda et al. 2011) and cysteine-rice peptides (Kuramata et al. 2009), have been investigated. A molecular approach based on physiological observations of Cd accumulation in rice will en-able the establishment of low Cd rice cultivars.
To identify genes or genomic segments conferring grain Cd concentration, QTL mapping is employed as a general approach. QTL analysis also provides molecular markers associated with grain Cd concentration and thus facilitates marker-assisted selec-tion in crop breeding programs for low or high Cd accumulaselec-tion in the rice plant. Some studies have focused on the identification of QTLs for Cd accumulation in rice.Ishikawa et al. (2005a)located three QTLs controlling brown rice Cd concentration on chromo-somes 3, 6, and 8 using chromosome segment substitution lines (CSSLs). Ueno et al. (2009a) and Xue et al. (2009)identified the major QTLs controlling shoot Cd concentration on chromosomes 11 and 7, respectively. The other QTLs for accumulation and trans-location also have been reported (Kashiwagi et al. 2009;Ishikawa et al. 2010). To understand the molecular genetic mechanism(s) underlying these physiological complexities, Cd accumulation in rice as well as the distribution among rice organs should be stud-ied. However, few QTL analyses regarding Cd accumulation by organ and its distribution from root to shoot and grains at harvest have been reported (Ishikawa et al. 2010).
In this study, using an F7RILs population derived from a cross of
twojaponicarice cultivars with contrasting characteristics of Cd accumulation, ‘Suwon490’ and ‘SNU-SG1’, QTL mapping using SSR markers was performed. The aims of this study were to detect QTLs controlling the Cd accumulation and distribution in rice shoot and grain.
Materials and methods
Plant materials
An F7 RIL population consisting of 91 lines was used in this
study. The population was developed independently from an F1
hybrid between ‘Suwon490’ (a high Cdjaponicacultivar) as a male parent and ‘SNU-SG1’ (a low Cdjaponicacultivar) by single seed descent (SSD). The RIL population and their parents were grown in the Experimental Farm of Seoul National University, Suwon, Korea, according to standard rice cultivation practices.
Cd treatment and measurements
The RIL population and their parents were grown for 30 days in the nursery and transplanted at a spacing of 30 cm × 15 cm with one seedling per hill. The field experiment was laid out in a ran-domized complete block design with three replications. All rice seedlings were grown with irrigation water containing 2 ppm CdCl2throughout the growing season. At harvest, four rice plants
were sampled and separated into root, straw, and grain.
For Cd measurement, the samples were oven dried at 70 °C for 2 days to a constant mass, ground to powder, and wet digested for Cd analysis. Two grams of plant sample was digested with a 20 mL
mixed solution containing 87% concentrated HNO3and 13%
concen-trated HClO4(Ince et al. 1999). Cd concentration in shoot (CDS) and
Cd concentration in grain (CDG) were determined using an atomic absorption spectrophotometer (AA-6401; Shimadzu, Japan). Shoot to grain ratio of Cd accumulation (SGR), representing Cd distribution from shoot to grain, was also calculated.
SSR marker analysis
Rice leaves of the parents and the progeny were collected at the tillering stage for DNA extraction. The leaves were ground into fine powder using a mortar and pastel with liquid nitrogen. The genomic DNA was extracted using a miniprep CTAB method (Murray and Thompson 1980) with minor modifications: at the final stage of extraction, DNA samples were diluted to 20 ng/L
with Tris–EDTA buffer (pH 8.0) and kept at –20 °C until analysis. DNA concentration was measured spectrophotometrically.
In total, 340 rice RM-series simple sequence repeat (SSR) mark-ers, developed byTemnykh et al. (2000,2001), were selected for linkage map analysis. For each SSR primer pair, the original for-ward primer sequence was redesigned by adding a universal M13 (−21) tail (5=-TGTAAAACGACGGCCAGT-3=) to the 5=end (Schuelke 2000). Four universal M13 (−21) primers were individually labeled with different fluorescent dyes, including 6-FAM, VID, NED, or PET (Applied Biosystems, Forest City, Calif., USA), to allow fluores-cence detection.
The total set of 340 SSR markers was tested for parental poly-morphisms among ‘Suwon490’ and ‘SNU-SG1’. Only 124 SSR primer pairs showing polymorphisms between the mapping par-ents (Fu 2008) were used for SSR genotyping in the 91 RILs. Ampli-fication reactions were carried out in a total volume of 5 L,
containing 20 ng genomic DNA, 1× PCR buffer, 0.2 mmol/L of each dNTP, 0.25 U ofTaqDNA polymerase (Vivagen, Seongnam, Korea), 0.5 mol/L of sequence-specific reverse primer, 0.5 mol/L of fluorescence-labeled universal M13 (−21) primer, and 0.125 mol/L of forward primer with M13 (−21) tail. Two rounds of PCR amplifi-cation reaction were conducted as follows: initial denaturation for 10 min at 95 °C; 35 cycles of 30 sec at 95 °C, 30 sec at 54 °C, and 45 sec at 72 °C; 10 cycles of 35 sec at 95 °C, 45 sec at 53 °C, and 45 sec at 72 °C; and a final extension for 10 min at 72 °C in a thermo cycler (PTC-100; MJ Research, USA).
Linkage map construction and QTL analysis
All primers that exhibited high stability and scorable polymor-phic bands between parental genotypes were used for further evaluation on the 91 F7individuals of the mapping population.
The genetic linkage map was constructed based on 124 SSR mark-ers that were selected from parental polymorphism using Map-maker 3.0 (Lander et al. 1987;Lincoln et al. 1993) and MapChart 2.0. The Kosambi mapping function was used for calculating ge-netic distance in centiMorgans (cM) (Kosambi 1943), and the order of markers was established using three-point analysis. The chro-mosomal location of main-effect QTLs was determined by interval mapping using a mixed linear model approach and QTL Mapper 2.0 software (Gao et al. 2004). To determine the empirical signifi-cance threshold for declaring a QTL, 5000 permutations were per-formed to calculate logarithm of odds (LOD) thresholds for each trait atP= 0.05 andP= 0.01 using the Qgene 3.06 software for Macintosh (Nelson 1997). The proportion of phenotypic variation explained by each QTL was calculated as theR2value.
Results
Phenotypic variation of Cd accumulation and distribution Mean value, standard deviation, and range of Cd concentrations of parents and the F7population are summarized inTable 1. A
divergence of the three Cd-related traits between mapping par-ents (‘Suwon490’ and ‘SNU-SG1’) were detected. The male parent ‘SNU-SG1’ showed relatively low CDS (Cd accumulation in shoot) and CDG (CD accumulation in grain) compared with ‘Suwon490’.
Genome Downloaded from www.nrcresearchpress.com by Seoul National University on 05/26/13
‘Suwon490’ accumulated 3.8- and 5.4-fold higher Cd in shoot and in grain in comparison to ‘SNU-SG1’, respectively. Accordingly, SGR of ‘Suwon490’ (17.2%) was higher than that of ‘SNU-SG1’ (11.6%).
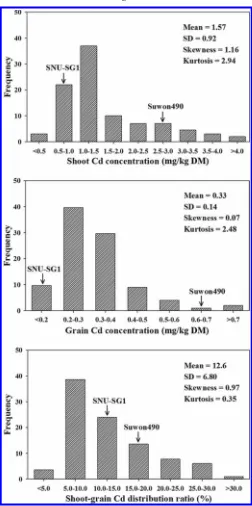
The pattern of the frequency distribution of CDS, CDG, and SGR in the RILs revealed a continuous variation, indicating that these traits are controlled by several QTLs (Fig. 1). The CDS varied from 0.3 to 0.5 mg/kg DM and CDG ranged from 0.1 to 1.2 mg/kg DM. Averages of CDS and CDG of the lines were higher (1.57 and 0.33 mg/kg DM) than those of the low Cd parent (‘SNU-SG1’). Pos-itively skewed distributions toward lower values of Cd concentra-tion were observed in all three Cd-related traits in the RIL population. Transgressive segregation occurred in both directions for CDS and SGR, suggesting that several genes may be involved in Cd accumulation in both parents.
Correlation between Cd-related traits for F7RILs is presented in
Table 2. In the RILs, a highly significant positive correlation be-tween CDS and CDG was observed (0.33, P< 0.01). While, SGR showed significantly negative correlation with CDS (−0.71, P< 0.05). In contrast, a highly significant positive correlation was detected between CDG and SGR (0.21, P < 0.01). Interestingly, 76 lines (83.5%) possessed a lower grain Cd concentration than the maximum threshold value of that for food safety (0.4 mg/kg DM, Codex Alimentarius Commission, 2004;Fig. 2), in which the vari-ation of SGR ranged from 3.1% to 40.7% in RILs.
Construction of a framework linkage map
The total set of 340 RM markers was initially screened to survey polymorphism between parents. After screening informative SSR markers, we obtained 124 SSR markers suitable for linkage map construction. Using the RIL population containing 91 individuals, a framework linkage map with the selected markers was con-structed to identify the QTLs governing Cd accumulation and dis-tribution. Total markers were successfully integrated into the linkage analysis. The map covered 1542 cM for the 12 chromo-somes, with an average interval of 12.4 cM between adjacent markers. The marker orders in each chromosome were consistent with the map developed previously byTemnykh et al. (2001).
Detection of QTLs for Cd accumulation and distribution The main effects and graphical location of the QTLs for each trait are presented inTable 3andFig. 3. Composite interval map-ping revealed a total of five main effect QTLs on chromosomes 3, 5, 9, 10, and 11 that are associated with Cd accumulation and distribution (CDS, CDG, and SGR) in this RIL population. One QTL (ssc10) for CDS was identified between RM239 and RM311 on chro-mosome 10. The percentage of the CDS phenotypic variation explained by this QTL was 17.4%, and the ‘SNU-SG1’ allele contrib-uted to the decreased CDS at thessc10locus. Three QTLs for CDG (gcc3,gcc9, andgcc11) were detected on chromosomes 3, 9, and 11, respectively. Thegcc3locus with a LOD score of 3.62, flanked by RM545 and RM1338, accounted for 16.7% of the phenotypic varia-tion. The other two QTLs for CDG,gcc9, at the interval of RM1328 and RM219, and gcc11, flanked by RM286 and RM4B, exhibited
explainable phenotypic variations of 17.8% and 16.1%, respectively. All together, the three QTLs accounted for 50.6% of the total phe-notypic variation in the RIL population, and the favorable alleles were contributed from the low Cd parent (‘SNU-SG1’).
The remaining QTL (sgr5) with the highest effect on SGR desig-nating Cd distribution was mapped on chromosome 5, flanked by RM593 and RM437 with a LOD value of 5.67. The favorable allele of ‘SNU-SG1’ seemed to decrease SGR at thesgr5locus. Phenotypic variation in SGR explained by this QTL was 24.9%. In addition to the identified QTLs, the digenic epistatic effects were found for two pairs of loci that accounted for 16.7% and 13.0% of the pheno-Table 1.Phenotypic variation of cadmium (Cd) concentration and
distri-bution in the parents and F7RIL population derived from a cross between
two temperatejaponicarice cultivars, ‘Suwon490’ × ‘SNU-SG1’.
Parents RIL population
Trait
Suwon490 (mean ± SD)
SNU-SG1
(mean ± SD) Mean ± SD Range CV (%)
CDS 2.98±0.20 0.79±0.04 1.57±0.92 0.3⬃5.0 59.0
CDG 1.02±0.14 0.19±0.03 0.33±0.14 0.1⬃1.2 43.5
SGR 17.16±2.75 11.6±2.18 12.6±6.80 3.1⬃40.7 53.8
Note: CDS, shoot Cd concentration (mg/kg DM); CDG, grain Cd concentration (mg/kg DM); SGR, Cd shoot to grain distribution ratio (%). Cd concentration and distribution were measured at the harvest stage.
Fig. 1. Frequency distribution of cadmium (Cd) concentration in shoot and grain, and shoot-grain Cd distribution ratio in a F7RIL
population derived from a cross between two temperatejaponicarice cultivars, ‘Suwon490’ × ‘SNU-SG1’. Cd concentration and distribution were measured at the harvest stage of rice.
Genome Downloaded from www.nrcresearchpress.com by Seoul National University on 05/26/13
typic variation, respectively (Table 4). The negative additives found in the identified locus also indicate that the allele decreas-ing Cd concentration is majorly transmitted from the low Cd parental line (‘SNU-SG1’) to the offspring.
Discussion
Cd tolerance and concentration are quantitatively inherited traits that are controlled by multiple genes (Xue et al. 2009). Japonicarice, which commonly exhibits lower Cd levels than in-dica, possibly centralizes more genes effecting the low Cd accumu-lation. Accordingly, we developed populations using twojaponica cultivars with contrasting Cd levels as shown by the higher Cd concentration of the female ‘Suwon490’ both on shoot and grain than those of the male ‘SNU-SG1’. Both parental genotypes pos-sessing a large number of different alleles for controlling Cd concentration probably could have caused the transgressive seg-regation in this progeny. Similar transgressive segseg-regation lines for Cd concentration in rice detected in previous studies (Ishikawa et al. 2005a,2005b,2010) support this study. Furthermore, the results are in good agreement with previous studies that Cd con-centration along with Cd tolerance are quantitatively inherited traits controlled by multiple genes (Zhang et al. 2008). ‘Suwon490’, considered a non stay-green cultivar, displayed dif-ferent phenotypic characters for yield-related traits compared with ‘SNU-SG1’, whereas ‘SNU-SG1’, identified as a functional stay-green, is a potential source of stay-green related traits (Fu et al. 2011), which facilitates the breeding of genetic materials. The phe-notypic difference of the parents led to the development of F7RIL
progeny with wide and continuous variations in grain and shoot Cd concentrations (Table 1andFig. 1). To make the benefits of this
developed mapping population widely available, it is crucial to understand the molecular genetic mechanism of Cd accumula-tion and distribuaccumula-tion.
A successful linkage map is a fundamental prerequisite to ge-netically elucidate the position of genes/QTLs linked with target traits, including Cd concentration, and to contrive a breeding program for the development of low Cd rice cultivars. Several genetic linkage maps and QTL mapping analyses have been con-ducted for Cd accumulation in rice (Ishikawa et al. 2005a;Ueno et al. 2009a,2009b;Xue et al. 2009). However, limited information of molecular genetics of Cd accumulation and distribution until maturity in rice is available. Referring to QTL detection on the basis of natural allelic differences between parental lines (Ishikawa et al. 2010), the parents with divergent characteristics in CDS and CDG as shown in this study are important for QTL analysis.
Significant positive correlation between CDS and CDG in the progeny (Table 2) is consistent with previous studies (Liu et al. 2005;He et al. 2006;Liu et al. 2007;Yan et al. 2010b) as expected. The higher CDS in rice cultivar reflects differential distribution of Cd between roots, shoot, and grain. In this study, the highly sig-nificant negative correlation between CDS and SGR was detected, while significant positive correlation was found between CDG and SGR (Table 2). These results are in good agreement with the report of Liu et al. (2005)in that shoot to grain Cd distribution was strongly correlated with grain Cd accumulation among 52 rice genotypes, signifying that shoot to grain Cd distribution was the process revealing the highest correlation with its genotypic vari-ation in grain Cd level (Liu et al. 2007).
This study is the first report of QTLs analysis for final CDS and CDG at harvest. Even though this map was not evenly distributed on the entire rice genome, the best coverage markers were able to identify the main effect QTLs for Cd accumulation and distribu-tion that have not been reported elsewhere. In this study, three QTLs for CDG were detected on chromosomes 3, 9, and 11 with high explainable phenotypic variation (Table 3;Fig. 3). Among the three QTLs, one QTL (gcc3) on chromosome 3 was located near the QTL at the same chromosomal region for the same trait found by Ishikawa et al. (2005a) who used chromosome segment substitu-tion lines derived from a cross of japonicaandindicacultivars. However,gcc9andgcc11 were novel QTLs identified on chromo-somes 9 and 11, respectively. Recently, a number of QTLs for CD accumulation at a young stage of rice growth have been identified on chromosomes 2, 4, 5, 7, and 11 (Kashiwagi et al. 2009;Ueno et al. 2009a;Xue et al. 2009). We detected a novel QTL on chromosome 10 controlling final CDS in the mature stage at harvest, which was different from the reports. As proved byXue et al. (2009), QTLs for Cd concentration in rice organs were found in various chromo-somal regions as a result of diverse rice growth stage effects in the different Cd stress levels. Beside the differential Cd accumulation among rice organs at different growth stages (Kashiwagi et al. 2009;Yan et al. 2010a), divergent genetic background of both parents could be one of the reasons for the novel QTLs. In light of previous studies (Fu et al. 2011), a number of novel main effect QTLs for stay-green related traits were also detected. ‘SNU-SG1’ would be a promising mapping parent to understand genetic mechanism of superior agronomical characters in rice, including Cd accumulation and distribution.
Previous studies mostly focused on QTLs controlling Cd uptake by root, root-shoot Cd distribution, and shoot Cd accumulation (Kashiwagi et al. 2009;Ueno et al. 2009a,2009b;Xue et al. 2009; Ishikawa et al. 2010). Any positional congruence of the Cd accu-mulation QTLs was not found between this study and the previous ones. The first evidence of a novel potential QTL for SGR with explainable phenotypic varition of 24.9% was identified on chro-mosome 5 in this study. The main effect of the QTL associated with Cd distribution from shoot to grain was relatively high as reflected by the high LOD score and the high explainability of Table 2.Correlation between cadmium (Cd)
accu-mulation characteristics in a F7RIL population
de-rived from a cross between two temperatejaponica cultivars, ‘Suwon490’ × ‘SNU-SG1’.
Trait CDS CDG
CDG 0.33**
SGR −0.71** 0.21*
Note: CDG, grain Cd concentration; CDS, shoot Cd con-centration; SGR, Cd shoot to grain distribution ratio. * and **, significant atP< 0.05 andP< 0.01, respectively.
Fig. 2. Correlation between grain cadmium (Cd) concentration and shoot-grain distribution ratio in a F7RIL population derived from a
cross between two temperatejaponicarice cultivars, ‘Suwon490’ × ‘SNU-SG1’. The horizontal line indicates the maximum threshold value of Cd concentration in polished rice for food safety (0.4 mg/kg DM;Codex Alimentarius Commission 2004).
Genome Downloaded from www.nrcresearchpress.com by Seoul National University on 05/26/13
phenotypic variation (Table 3). Besides, the QTL had a negative additive effect, revealing that the allele of this QTL reducing Cd concentration in rice grain is transmitted to the offspring mainly from ‘SNU-SG1’. This result demonstrates that shoot Cd accumu-lation is considered as the Cd pool that can be remobilized to seed and affect the final level in the rice grain (Kashiwagi et al. 2009; Yan et al. 2010a,2010b).
Furthermore, two pairs of loci (RM413/RM430 and RM267/ RM433) exhibiting significant digenic epistatic effects were found in this study. These specific pairs of loci may contribute to the variation of Cd distribution in this population (Table 4) through loci interaction. However, the two loci involved in epistatic inter-action may still show independent assortment at the genotypic
level. In addition to additive effects, this digenic epistatic effect signifies that the interaction of nonallelic genes also makes a substantial contribution to the genetic control of Cd distribution in the F7RILs. The negative additive values also indicated that the
allele conferring low Cd accumulation was inherited from the low Cd parent to progeny, which is relevant to the skewness for the three traits. The accumulation of favorable alleles from both par-ents could be a reason for this positively skewed distribution for CDS and CDG, especially dominant contribution of ‘SNU-SG1’.
For the elimination of Cd toxicity in rice it is necessary to ex-ploit rice cultivars absorbing less Cd and also translocating it less into grain, suggesting the possibility to incorperate lower Cd con-centration trait in rice breeding program as demonstrated in this Table 3.Main effect QTLs for the cadmium (Cd) concentration and distribution in a F7RIL population derived from a
cross between two temperatejaponicacultivars, ‘Suwon490’ × ‘SNU-SG1’.
Trait QTL Chr. Marker interval LOD Additive effect R2(%)
CDS scc10 10 RM239–RM311 3.78 −1.42 17.4
CDG gcc3 3 RM545–RM1338 3.62 −0.14 16.7
gcc9 9 RM1328–RM219 3.88 −0.17 17.8
gcc11 11 RM286–RM4B 3.46 −0.10 16.1
SGR sgr5 5 RM593–RM437 5.67 −14.57 24.9
Note: CDS, shoot Cd concentration (mg/kg DM); CDG, grain Cd concentration (mg/kg DM); SGR, shoot to grain distribution ratio of Cd; Chr., chromosome. QTLs are named by an abbreviation of the trait followed by the number, which represents the chromosome number.
Fig. 3 Chromosomal locations of the QTLs for three cadmium (Cd)-related traits on genetic linkage map across a F7RIL population of
‘Suwon490’ × ‘SNU-SG1’ and other reported rice populations. The map distance between markers (cM) and marker order are in agreement with the rice linkage map constructed byTemnykh et al. (2001).
Table 4.Digenic epistatic effects for cadmium (Cd) distribution in a F7RIL population derived from
a cross between two temperatejaponicacultivars, ‘Suwon490’ × ‘SNU-SG1’.
SSR locus Allele Locus/allele P R2(%)
RM413/RM430 RM430 <0.0001 16.7
RM413 Suwon490 SNU-SG1
Suwon490 12.8 11.9
SNU-SG1 24.5 7.9
RM267/RM333 RM333 <0.0001 13.0
RM267 Suwon490 SNU-SG1
Suwon490 16.2 11.0
SNU-SG1 10.5 15.4
Genome Downloaded from www.nrcresearchpress.com by Seoul National University on 05/26/13
study. The male parent ‘SNU-SG1’ together with the transgessive low Cd lines may have specific mechanism to prevent excess Cd accumulation in shoot under high Cd toxicity condition (Das et al. 1997). As proven previously, Cd tolerant plants showed a dimin-shed accumulation in shoots and higher accumulation in roots as compared with the nontolerant plants (Das et al. 1997). Several genes encoding the changes in the activities of enzymes and trans-porters were reported to have contributions to the Cd tolerant rice plants under Cd stress (Uraguchi and Fujiwara 2012).
In conclusion, the QTLs detected in the current study would be worthy for understanding the genetic mechanism and breeding of low Cd accumulation rice cultivars and (or) Cd-tolerant rice culti-var for safe rice production. Low-Cd lines revealed in this study are potential candidates for improving rice varieties for food safety and human health. Thus, thejaponicafunctional stay-green culti-var ‘SNU-SG1’, having higher grain yield potential (Fu et al. 2011) along with tolerance to excess Cd, can be exploited as a potent genetic resource of breeding program for improving desired Cd accumulation rice varieties.
Acknowledgements
This research was supported by Bio-industry Technology Devel-opment program, Ministry for Food, Agriculture, Forestry and Fisheries, Republic of Korea. We also thank the National Instru-mental Center for EnvironInstru-mental Management at Seoul National University, South Korea.
References
Codex Alimentarius Commission. 2004. Report of the 36th session of the Codex Committee on Food Additives and Contaminants, Joint FAO/WHO Food Stan-dard Programme Report ALINORM 04/27/12, Rotterdam, the Netherlands. DalCorso, G., Farinati, S., Maistri, S., and Furini, A. 2008. How plants cope with
cadmium: staking all on metabolism and gene expression. J. Integr. Plant Biol.50: 1268–1280. doi:10.1111/j.1744-7909.2008.00737.x. PMID:19017114. Das, P., Samantaray, S., and Rout, G.R. 1997. Studies on cadmium toxicity in
plants: a review. Environ. Pollut. 98: 29–36. doi:10.1016/S0269-7491(97) 00110-3. PMID:15093342.
Fu, J.-D. 2008. Physiological characteristics of functional stay green rice during grain filling and its quantitative trait loci (QTL) analysis. Ph.D. thesis, Depart-ment of Plant Science, Seoul National University, Seoul, Korea.
Fu, J.-D., Yan, Y.-F., Kim, M.Y., Lee, S.-H., and Lee, B.-W. 2011. Population-specific quantitative trait loci mapping for functional stay-green trait in rice (Oryza sativaL.). Genome,54(3): 235–243. doi:10.1139/G10-113. PMID:21423286. Gao, Y.-m., Zhu, J., Song, Y.-s., He, C.-x., Shi, C.-h., and Xing, Y.-z. 2004. Analysis of
digenic epistatic effects and QE interaction effects QTL controlling grain weight in rice. J. Zhejiang Univ. Sci.5: 371–377. doi:10.1631/jzus.2004.0371. PMID:14994424.
Guo, Y.L., and Marschner, H. 1996. Genotypic differences in uptake and distri-bution of cadmium in bean and maize inbred lines. J. Plant Nutr. Soil Sci.159: 55–60.
He, J.Y., Zhu, C., Ren, Y.F., Yan, Y.P., and Jiang, D. 2006. Genotypic variation in grain cadmium concentration of lowland rice. J. Plant Nutr. Soil Sci.169: 711–716. doi:10.1002/jpln.200525101.
Ince, N.H., Dirilgen, N., Apikyan, I.G., Tezcanli, G., and U¨stün, B. 1999. Assess-ment of toxic interactions of heavy metals in binary mixtures: a statistical approach. Arch. Environ. Contam. Toxicol. 36: 365–372. doi:10.1007/ PL00006607. PMID:10227854.
Ishikawa, S., Ae, N., and Yano, M. 2005a. Chromosomal regions with quantita-tive trait loci controlling cadmium concentration in brown rice (Oryza sativa). New Phytol. 168: 345–350. doi:10.1111/j.1469-8137.2005.01516.x. PMID:
16219074.
Ishikawa, S., Ae, N., Sugiyama, M., Murakami, M., and Arao, T. 2005b. Genotypic variation in shoot cadmium concentration in rice and soybean in soils with different levels of cadmium contamination. Soil Sci. Plant Nutr.51: 101–108. doi:10.1111/j.1747-0765.2005.tb00012.x.
Ishikawa, S., Abe, T., Kuramata, M., Yamaguchi, M., Ando, T., Yamamoto, T., and Yano, M, 2010. A major quantitative trait locus for increasing cadmium-specific concentration in rice grain is located on the short arm of chromo-some 7. J. Exp. Bot.61: 923–934. doi:10.1093/jxb/erp360. PMID:20022924. Kashiwagi, T., Shindoh, K., Hirotsu, N., and Ishimaru, K. 2009. Evidence for
separate translocation pathways in determining cadmium accumulation in grain and aerial plant parts in rice. BMC Plant Biol.9: 8. doi: 10.1186/1471-2229-9-8. PMID:19154618.
Kosambi, D.D. 1943. The estimation of map distances from recombination val-ues. Ann. Eugen.12: 172–175. doi:10.1111/j.1469-1809.1943.tb02321.x. Kuramata, M., Masuya, S., Takahashi, Y., Kitagawa, E., Inoue, C., Ishikawa, S.,
et al. 2009. Novel cysteine-rich peptides fromDigitaria ciliarisandOryza sativa enhance tolerance to cadmium by limiting its cellular accumulation. Plant Cell Physiol.50: 106–117. doi:10.1093/pcp/pcn175. PMID:19017626.
Lander, E.S., Green, P., Abrahamson, J., Barlow, A., Daly, M.J., Lincoln, S.E., and Newburg, L.A. 1987. MAPMAKER: an interactive computer package for con-structing primary genetic linkage maps of experimental and natural popu-lations. Genomics, 1: 174–181. doi:10.1016/0888-7543(87)90010-3. PMID:
3692487.
Lincoln, S.E., Daly, M.J., and Lander, E.S. 1993. Constructing genetic linkage maps with MAPMAKER/EXP version 3.0. A tutorial and reference manual. 3rd ed. Technical Report, Whitehead Institute for Biomedical Research, Cam-bridge, Mass.
Liu, J., Zhu, Q., Zhang, Z., Xu, J., Yang, J., and Wong, M. 2005. Variations in cadmium accumulation among rice cultivars and types and the selection of cultivars for reducing cadmium in the diet. J. Sci. Food Agric.85: 147–153. doi:10.1002/jsfa.1973.
Liu, J., Qian, M., Cai, G., Yang, J., and Zhu, Q. 2007. Uptake and translocation of Cd in different rice cultivars and the relation with Cd accumulation in rice grain. J. Hazard. Mater. 143: 443–447. doi:10.1016/j.jhazmat.2006.09.057. PMID:17079078.
Murakami, M., Ae, N., and Ishikawa, S. 2007. Phytoextraction of cadmium by rice (Oryza sativaL.), soybean (Glycine max(L.) Merr.), and maize (Zea maysL.). Envi-ron. Pollut.145: 96–103. doi:10.1016/j.envpol.2006.03.038. PMID:16781805. Murray, M.G., and Thompson, W.F. 1980. Rapid isolation of high molecular
weight plant DNA. Nucleic Acids Res.8: 4321–4325. doi:10.1093/nar/8.19.4321. PMID:7433111.
Nelson, J.C. 1997. QGENE: software for marker-based genomics analysis and breeding. Mol. Breed.3: 239–245. doi:10.1023/A:1009604312050.
Oda, K., Otani, M., Uraguchi, S., Akihiro, T., and Fujiwara, T. 2011. Rice ABCG43 is Cd inducible and confers Cd tolerance on yeast. Biosci. Biotechnol. Biochem.75: 1211–1213. doi:10.1271/bbb.110193.
Pilon-Smits, E., and Freeman, J. 2006. Environmental cleanup using plants: bio-technological advances and ecological considerations. Front. Ecol. Environ.
4: 203–210. doi:10.1890/1540-9295(2006)004[0203:ECUPBA]2.0.CO;2. Popelka, J.C., Schubert, S., Schulz, R., and Hansen, A.P. 1996. Cadmium uptake
and distribution during reproductive development of peanut (Arachis hypo-gaeaL.). Angew. Bot.70: 140–143.
Sanita` di Toppi, L., and Gabbrielli, R. 1999. Response to cadmium in higher plants. Environ. Exp. Bot.41: 105–130. doi:10.1016/S0098-8472(98)00058-6. Schuelke, M. 2000. An economic method for the fluorescent labeling of PCR
fragments. Nat. Biotechnol.18: 233–234. doi:10.1038/72708. PMID:10657137. Temnykh, S., Park, W.D., Ayres, N., Cartinhour, S., Hauck, N., Lipovich, L., et al.
2000. Mapping and genome organization of microsatellite sequences in rice (Oryza sativaL.). Theor. Appl. Genet.100: 697–712. doi:10.1007/s001220051342. Temnykh, S., Declerck, G., Luashova, A., Lipovich, L., Cartinhour, S., and McCouch, S. 2001. Computational and experimental analysis of microsatel-lites in rice (Oryza sativa L.): frequency, length variation, transposon associa-tions, and genetic marker potential. Genome Res.11: 1441–1452. doi:10.1101/ gr.184001. PMID:11483586.
Tezuka, K., Miyadate, H., Katou, K., Kodama, I., Matsumoto, S., Kawamoto, T., et al. 2010. A single recessive gene controls cadmium translocation in the cadmium hyperaccumulating rice cultivar Cho-Ko-Koku. Theor. Appl. Genet.
120: 1175–1182. doi:10.1007/s00122-009-1244-6. PMID:20039013.
Ueno, D., Kono, I., Yokosho, K., Ando, T., Yano, M., and Ma, J.F. 2009a. A major quantitative trait locus controlling cadmium translocation in rice (Oryza sa-tiva). New Phytol.182: 644–653. doi:10.1111/j.1469-8137.2009.02784.x. PMID:
19309445.
Ueno, D., Koyama, E., Kono, I., Ando, T., Yano, M., and Ma, J.F. 2009b. Identifica-tion of a novel major quantitative trait locus controlling distribuIdentifica-tion of Cd between roots and shoots in rice. Plant Cell. Physiol.50: 2223–2233. doi:10. 1093/pcp/pcp160. PMID:19884249.
Uraguchi, S., and Fujiwara, T. 2012. Cadmium transport and tolerance in rice: perspectives for reducing grain cadmium accumulation. Rice,5: 5. doi:10. 1186/1939-8433-5-5.
Xue, D., Chen, M., and Zhang, G. 2009. Mapping of QTLs associated with cad-mium tolerance and accumulation during seedling stage in rice (Oryza sativaL.). Euphytica,165: 587–596. doi:10.1007/s10681-008-9785-3.
Yan, Y.-F., Choi, D.-H., Kim, D.-S., and Lee, B.-W. 2010a. Absorption, translocation, and remobilization of cadmium supplied at different growth stages of rice. J. Crop Sci. Biotechnol.13(2): 69–73. doi:10.1007/s12892-010-0045-5. Yan, Y.-F., Choi, D.-H., Kim, D.-S., and Lee, B.-W. 2010b. Genotypic variation of
cadmium accumulation and distribution in rice. J. Crop Sci. Biotechnol.13(2): 69–73. doi:10.1007/s12892-010-0036-5.
Zhang, J., Zhu, Y.-G., Zeng, D.-L., Cheng, W.-D., Qian, Q., and Duan, G.-L. 2008. Mapping quantitative trait loci associated with arsenic accumulation in rice (Oryza sativa). New Phytol.177: 350–356. doi:10.1111/j.1469-8137.2007.02267.x. PMID:17995916.