Research papers
Infaunal community responses to a gradient of trawling disturbance
and a long-term Fishery Exclusion Zone in the Southern Tyrrhenian Sea
M. Cristina Mangano
a,b,n, Michel J. Kaiser
b, Erika M.D. Porporato
a,
Gwladys I. Lambert
b, Paola Rinelli
c, Nunziacarla Spanò
aaDiSBA Dipartimento di Scienze Biologiche ed Ambientali, Università degli Studi di Messina, Viale F. Stagno d0
Alcontres 31, 98166 Messina, Italy bSchool of Ocean Sciences, Bangor University, Menai Bridge, Anglesey, LL59 5AB, UK
cInstitute for the Coastal Marine Environment, Council National of Research, Spianata S. Raineri 86, 98122 Messina, Italy
a r t i c l e
i n f o
Article history: Received 2 May 2013 Received in revised form 19 December 2013 Accepted 30 December 2013 Available online 13 January 2014
Keywords: Trawling impact Continental shelf Upper slope
Vessel monitoring system Ecosystem management
a b s t r a c t
Historically the majority of Mediterranean trawlfisheries occur on the continental shelf with a smaller proportion focused on the shelf slope and deep sea areas. Understanding how trawlfisheries affect the wider ecosystem is an important component of the ecosystem-based approach tofisheries management. In this context the current study examined the impact of the otter trawl fishery on the infaunal communities found on the continental shelf and upper slope off the coast of Sicily and Calabria, Italy. A total of thirty six sites were sampled across a gradient offishing intensity and from within a large bay from which trawling has been excluded for 22 years. Fishing intensities were ascertained post-hoc from vessel monitoring system data. Seabed characteristics of the sites studied were uniform across the continental shelf and slope areas that were studied, such that the only factor that varied wasfishing intensity. The density index (DI) and total number of species (S) were significantly higher in thefishery closure area compared with other continental shelf sites. In particular, bioturbating decapod fauna occurred only within thefishery closure area. Fished sites were dominated primarily by burrowing deposit feeding worms, small bivalves and scavenging biota. In contrast, the response tofishing on the upper slope was less clear. This observation was treated with caution as the power to detectfishing effects was lower for the upper slope sites as a result of possible illegalfishing that had compromised two of the four replicate sites within the closed area. While the present study was able to quantify the effect of the demersal trawlfleet on the benthic infauna of the continental shelf, the effects of trawling on the upper shelf slope remain unclear and warrant further study.
&2014 Elsevier Ltd. All rights reserved.
1. Introduction
The direct physical effects of trawl disturbance on continental-shelf benthic communities are well understood for a range of
fishing-gear types and in a variety of seabed habitats (Kaiser et al., 2006). However, the majority of these studies are focused on small-scale experimental manipulations whereas a much smaller number of studies have investigated the response of benthic fauna to trawling disturbance at the mesoscale of afishing ground and across a gradient of trawling impact (de Groot, 1984; Dayton et al., 1995; Thrush et al., 1995; Auster et al., 1996; Jennings and Kaiser, 1998; Pauly et al., 1998; Hall, 1999; Norse and Watling, 1999; Kaiser and de Groot, 2000; Hinz et al., 2009).De Juan et al. (2011,
2012a) studied the effects of trawl disturbance in the North-Western Mediterranean Sea but suggested that such studies needed to be expanded to encompass a wider variety of systems in the Mediterranean in order to be able to draw consistent conclusions about the response of benthic communities to trawl disturbance in this region (see also Smith et al. (2000),Dimech et al. (2012).
The recent emphasis on the ecosystem-based management approach increased the need to understand the effects of anthro-pogenic disturbance on marine ecosystems that area associated withfishing activities so as to be able to introduce management measures that maintain the structure and functioning of marine communities (FAO, 2003; Sinclair and Valdimarsson, 2003; Browman and Stergiou 2005; Levin et al., 2009; Stelzenmüller et al., 2013). The establishment of ecosystem-based management plans and monitoring of the effectiveness of their implementation and the resulting outcomes are a mandatory requirement under current European legislation (Frid et al., 2005; FAO General Fisheries Commission for the Mediterranean, 2010). However, to Contents lists available atScienceDirect
journal homepage:www.elsevier.com/locate/csr
Continental Shelf Research
0278-4343/$ - see front matter&2014 Elsevier Ltd. All rights reserved. http://dx.doi.org/10.1016/j.csr.2013.12.014
nCorresponding author at: DiSBA Dipartimento di Scienze Biologiche ed
Ambien-tali, Università degli Studi di Messina, Viale F. Stagno d0Alcontres 31, 98166 Messina, Italy. Tel.:þ39 906765541,þ39 3489392878.
date the implementation of Ecosystem-Based Fisheries Manage-ment (EBFM) in the Mediterranean basin has been hampered both by a lack of a good understanding of the ecological role of the species affected byfishing activities and by an inadequate knowl-edge of their distribution in relation to the distribution offishing activities (Pikitch et al., 2004; de Juan et al., 2012b). The adoption of management actions at a regional scale is difficult due to the geophysical and political complexity of the Mediterranean basin (Cacaud, 2005). De Juan et al. (2012b) suggested that an EBFM approach in the Mediterranean Sea could be accomplished through the development of a management plan based on the establishment of marine spatial planning and the use of areas of the sea with varying levels of conservation.
To expand our understanding of the response of benthic communities in a data poor region (the Mediterranean) to trawling disturbance and, to provide suggestions for a sustainable use of marine resources in the context of EBFM, the present study aimed to quantify the responses of infaunal communities to a gradient of
fishing intensities in the Southern Tyrrhenian Sea (Central
Med-iterranean Sea). A previous study in this location (see Mangano et al., 2013) highlighted differences in the biological traits compo-sition of mega-epibenthic communities among areas subjected to different levels offishing intensity but did not consider the effects offishing on the infaunal component of the benthic community.
The present study was conducted from Cape Suvero (Calabria) to Cape Cefalù (Sicily) and focused on the infaunal communities asso-ciated with trawled muddy seabed habitats at a depth of between 50 and 400 m that encompassed the continental shelf and the upper shelf slope ecosystems. The responses of benthic infauna that experi-enced different amounts of trawling impact were studied by taking samples across sites in the Gulf of Sant0Eufemia (Calabria) and the Gulfs of Patti and Sant0Agata (Sicily). The
fishing history for the
previous twelve months at each site was ascertaineda posteriorifrom the analysis of vessel monitoring system (VMS) data. Although it was impossible to reconstruct a historical trend in the response of the benthic communities to trawl disturbance, the availability of vessel monitoring system data for the trawlfleet enabled us to undertake a comparative study of the response of the community to the cumulative effects offishing (Hinz et al., 2009). The vessel monitoring system (VMS) data enabled us to obtain high resolution quantitative
estimates offishing activity at a relevant spatial scale (Bastardie et al., 2010; Lee et al., 2010; Lambert et al., 2012; Hintzen et al., 2012). VMS has become a critical tool that enables scientists to evaluate the footprint offishing activity in the marine environment, in this regard, VMS data can support the assessment offishing activity and marine spatial planning by providing a more detailed insight into thefishing effort and distribution (EC, 1997; Dinmore et al., 2003; Murawski et al., 2005; Mills et al., 2007; Lambert et al., 2012; Hinz et al., 2013). In particular, the study provides important insights into the distribution offishing disturbance on the seabed in a central Mediterraneanfishing ground, a necessary step to evaluate the relative impact of this activity on the natural environment and, particularly, to examine the effects of trawl disturbance on benthic communities.
The study utilises the presence of the Fishery Exclusion Zone of the Gulf of Patti (Messina) as a baseline against which to evaluate the effects offishing on the seabed across an area that extended from the gulf of Sant0Eufemia on the west coast of Calabria to the Gulf of Sant0Agata, Sicily.
2. Materials and methods
2.1. Study area
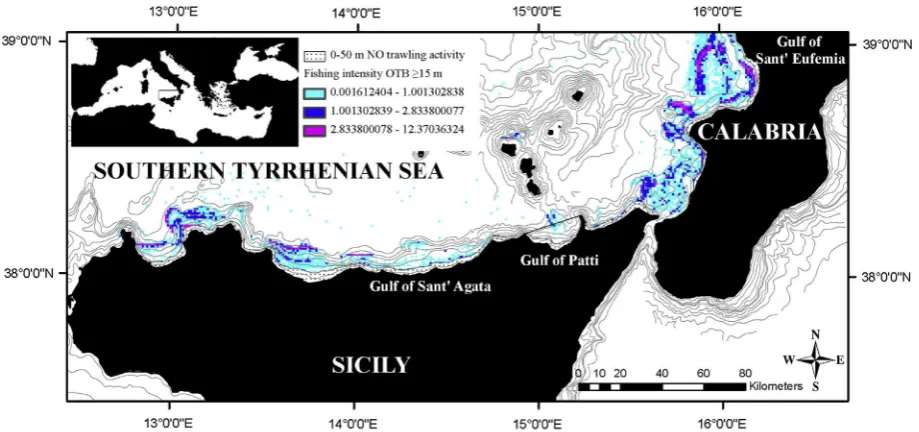
The surveyed area extended from a depth of 50 to 400 m across an area of 800 km2that encompassed the Gulf of Sant0Eufemia on the west coast of Calabria (300 km2) and the Gulfs of Patti and
Sant0Agata on the northern coast of Sicily (respectively 240 and 260 km2) (Fig. 1). The Gulf of Patti is a Fishery Exclusion Zone that
has been closed to commercial trawling since 1990 (Regional Law N. 25/90). The fishing activity inside this gulf is restricted to artisanalfishing that extends over the continental shelf and upper slope and includes mainly highly selective static gears such as trammel nets and set gillnets. The Gulf of Sant0Eufemia and the Gulf of Sant0Agata are characterised by medium-large trawling
fleets resulting in an intensive mixed demersal trawl fishery dominated by round fish (European hake, red mullet, Pagellus spp.), flatfish species (common sole, anglerfish Lophius spp.), several Crustaceans (Norway lobster, giant red shrimp, red shrimp, deepwater rose shrimp) and Cephalopods (shortfin squid,
European squid, common cuttlefish), as well as artisanalfisheries (Mangano et al., 2013). In the last two decades both the Gulf of Sant0Eufemia and the Gulf of Sant0Agata have been described as overfished (Internal Report CNR, 1988; Greco et al., 1993; Greco, 1994). The only regulation imposed along the twofished gulfs is a ban on trawling in water shallower than 50 m as occurs for all Italian coastlines and elsewhere in the Mediterranean basin. All three Gulfs are characterized by very similar environmental variables (Table 1).
2.2. Sampling design
A total of 24 samples were collected in each of the three surveyed Gulfs, during July 2009, using a 70 l modified Van Veen grab with a sampling surface area of 0.25 m2. In each Gulf, four
transects approximately 5 km apart were sampled, with sampling sites stratified by depth zone (50–100, 100–200, 200–400 m). Two samples were collected at each of the sampling sites and these were merged together and the total number of individuals was standardised to a sampling surface of 0.50 m2. A half litre sample
of sediment was collected for particle-size determination. Percen-tage fractions of each sediment size-class category were dry sieved through a stack of ASTM-USA meshes. The silt and clay compo-nents were extracted by washing over a 63-mm mesh, and were subsequently separated using the column dispersion method (Buchanan, 1984). The descriptive dispersion index of mean grain size (Mz) was evaluated according toFolk and Ward (1957).
Macrobenthic faunal organisms were extracted from the sedi-ment after washing over a 0.5 mm mesh and thereafter preserved in 70% ethanol except polychaetes that were fixed with 4% buffered formalin. In the laboratory fauna samples were sorted and identified to the lower taxonomic level possible and the total number of each species was quantified and standardised.
2.3. Estimation offishing intensity
VMS position, time, speed, and anonymous vessel identification data for bottom otter trawlers (OTB) in the territorial waters of the Southern Tyrrhenian Sea for the year 2009 were provided by the Italian Coast Guard (FMC—Fishing Monitoring Centre, Rome). Data included Italian vessels Z15 m operating in the study area
(European Commission (EC), 2003). Before analysis, data were screened to identify basic inaccuracies in vessel identity, position, speed and duplicate VMS records and records close to (within 1 km of) port were removed, along with erroneous position records allocated to land (Lee et al., 2010). Based on direct observations of fishing vessels operating in the study area and an analysis of the frequency distribution of the calculated speed
between consecutive VMS records, the calculation of fishing intensity was restricted to speeds 42 and r4 knots (Piet et al., 2007; Lambert et al., 2012). The value zero was considered to indicate that vessels were anchored. All analyses were conducted using the VMStools package in R (Hintzen et al., 2012).
Fishing intensity was calculated for a 12-month period by estimating the area swept by point summation of VMS data on a grid cell size of 1 km1 km (Lambert et al., 2011). Point summa-tion consists of summing the area swept attributed to each VMS point in a defined cell. The swept area was calculated by multi-plying the time interval between positions, thefishing speed, and the spread of the gear. Otter trawls were assumed to be 89 m wide considering an average measure of horizontal door spread, HDS, for a conventional otter trawler operating on Mediterranean Sea. This measure was preferred to a more usual measure of horizontal net opening, as a result of recent observations of the impact on the seabed of two traditional otter nets operating on Mediterranean soft bottomfishing grounds (Sala et al. 2009; Sala and Lucchetti, 2012). The measure takes into account the horizontal surface of contact between the mouth of the net and the seabed but also includes a number of important points of contact such as ropes, chains and the two doors. All of these components of the gear have the potential to have a direct impact on macrofauna. Although this approach may result in an overestimate in thefishing activity we considered to be a conservative approach.
Fishing intensity was defined as the summed swept-area divided by the surface area of the cell (year–1) and was calculated
for a cell size of ca. 1 km1 km. The grid scale of analysis is important whenfishing activity is used as a pressure indicator of the state of the environment (Lambert et al., 2012). The EU directives on the Data Collection Framework (DCF) and associated documentation define standardized indicators (Commission of the European Communities (COM), 2008; EC (European Commission), 2008a, 2008b) and recommend that the analysis VMS data should be based on grid cells of 3 km3 km. Nevertheless we preferred to use a smaller grid and hence to obtain a finer-resolution to reflect better the heterogeneity in fishing effort distribution. As grid size was defined in fixed kilometre units, longitude and latitude VMS position records were projected into the Universal Transverse Mercator (UTM) geographic coordinates system. The sum of the swept area in each 1 km2cell was represented with
ArcGIS 9.3, giving the actual fishing frequency per annum (Figs. 1 and 2a–c).
2.4. Analysis of environmental characteristics
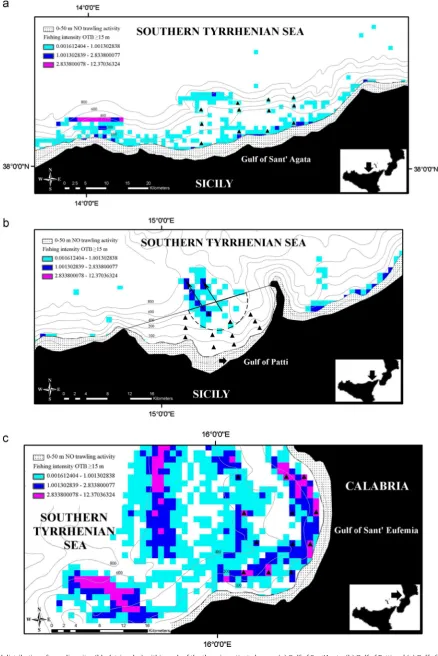
Prior to any analysis of the infaunal community data in relation to fishing activity, it was important to establish whether there Table 1
Summary of the abiotic environmental characteristics (mean795% CI) measured at each sampling site on the continental shelf (50–200 m) and upper slope (200–400 m). Minimum and maximumfishing intensity values (swept area/year) were reported for each habitat in each gulf. Statistical tests for differences in the environmental metrics between the three Gulfs (SEu¼Sant’Eufemia, Pat¼Patti, SAg¼Sant’Agata) were undertaken using either ANOVA (F) or Kruskal–Wallis (H) tests.
50–200 SEu Pat SAg F/H p
Depth 149.75738.65 127.88733.87 124.54731.50 H¼2.75 0.253
Sand 8.6375.40 3.5674.73 6.62712.98 H¼3.56 0.168
Silt 86.3777.30 92.4575.21 84.12713.47 H¼1.80 0.406
Clay 4.8673.53 3.9971.26 9.2777.53 F¼2.06 0.153
Mz (mean grain size) 6.2070.33 6.4670.26 6.4370.88 H¼5.92 0.052
Fishing intensity min–max 0.931–6.368 0 0.032–0.367 200–400
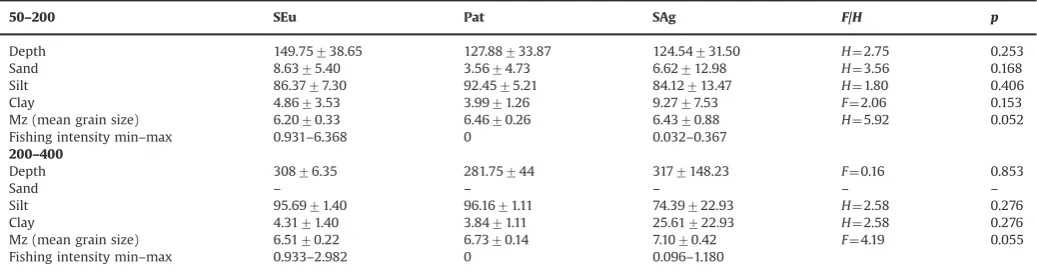
Fig. 2.Spatial distribution of sampling sites (black triangles) within each of the three investigated areas: (a) Gulf of Sant’Agata, (b) Gulf of Patti and (c) Gulf of Sant’Eufemia. The spatial distribution offishing intensity (swept area year 1) at a scale of 1 km
²is also given. The stippled band represents the depth range between 0 and 50 m that is closed to otter trawlfishing activity. The black line delineates the seaward limit of the extension of the Exclusion Fishery Zone that has been established inside the Gulf of Patti since 1990; the thick black arrow indicates the position of Portorosa harbour; the two thin black arrows indicate the possible direction in which vesselsfish illegally from inside of the area closure; the semi-circular dotted line is the extent to which illegalfishing could occur without detection from the VMS. Code: OTB¼Bottom Otter
were any potentially confounding variables. A Euclidian distance matrix of normalised environmental data was computed using the log(xþ1) transformed abiotic habitat characteristics found at the individual sampling sites (using Primer v.6, Clarke and Gorley (2006)). A two-way Analysis of Similarity test (ANOSIM) was performed on depth (50–100, 100–200, 200–400) and location (three gulfs, SEu¼Gulf of Sant0Eufemia, Pat¼Gulf of Patti, SAg¼Gulf of Sant0Agata). The environmental data used to compute the Euclidian distance matrix were: depth, mean particle size, percentage of sand, silt and clay. In order to account for any potential autocorrelation between the environmental variables and the distribution and intensity of the trawl fisheries, the correlation coefficients (Pearson0s) were computed for each com-bination of environmental variable andfishing. If variables were found to be autocorrelated (i.e. rho4¼0.95), one of the variables was removed from further analyses. Additionally, an ANOVA test was performed to ascertain whether there were significant differ-ences in the environmental parameters among the three spatially distinct Gulfs.
2.5. Analysis of infaunal community
The analyses of infauna community data were undertaken using the PRIMER (v.6) software package. Species abundance data (0.50 m 2) were fourth-root transformed to down weight the
influence of extremely abundant species, and clustered using the Bray–Curtis index of similarity. A multidimensional scaling ordina-tion (MDS) plot was then computed from the resulting similarity matrix. A BIOENV procedure was undertaken, using a Spearman rank correlation coefficient, to explore which of the variables measured at each site (environmental variables andfishing inten-sity) best explained the multivariate relationship in the ordination of infaunal samples (Clarke and Ainsworth, 1993).
Differences in community composition and structure that were related to fishing intensity were tested using an Analysis of Similarity (ANOSIM) test. For this test, sites were grouped into
fishing intensity categories. Fishing intensity was expressed as the number of times an area of seabed was swept area/year for each 1 km2 cell and was grouped into three categories: 0 (Fishery
Exclusion Zone, no fishing intensity), 1 (low fishing intensity 0.001–1.000 swept area/year), 2 (high fishing intensity 1.001– 7.000 swept area/year). The three categories were grouped after checking the effective values of fishing intensity registered in proximity to each sampling site located along the study area (Fig. 2a–c). We adopted a categorical approach for our analysis to improve the statistical power to detect the effects of fishing. A Similarity Percentage (SIMPER) routine was used to determine which species contributed most to the similarity or dissimilarity for those sites that experienced the same (categorical) fishing intensity differentiated by habitat (shelf or upper shelf slope communities) (Clarke and Warwick, 1994).
The response of univariate community metrics to fishing intensity in both the shelf and slope habitats were tested sepa-rately with ANOVA, these metrics included: the total number of individuals per unit area (N), the total number of species per unit area (S), Species richness (d) together with two weighted struc-tural indices Shannon–Wiener diversity (H0) and Pielou0s index of evenness (J0). All metrics were tested to see if they satis
fied the
assumptions required for ANOVA. Anderson–Darling and Levene0s tests were used to test respectively normality and homogeneity of variance and the indices were log(xþ1) transformed when neces-sary. The non-parametric Kruskal–Wallis test was performed on untransformed data when the assumptions were not met. Apost hocanalysis of the difference between mean values was under-taken using Tukey0s test to detect signi
ficant pairwise differences
among the analysed factor. The same statistical approach was
adopted to examine the response of selected individual species to trawl intensity for both shelf and upper shelf slope habitats.
3. Results
3.1. Fishing intensity
The analysis of the distribution of fishing intensity from the VMS data demonstrated the non-random behaviour of thefishing
fleet, which is presumably influenced by historical patterns of
fishing performance and regulatory restrictions, as well as by the location of the fishing resources (Fig. 2a–c). In the Gulf of Sant0Agata
fishing was mainly confined to coastal areas. The Gulf
of Sant0Eufemia was subjected to a very patchy distribution of
fishing intensity that had its highest concentration and intensity in proximity to the 100 and 600 m bathymetric lines that ran in parallel to the coastline. Inside the Fishery Exclusion Zone in the Gulf of Patti, the VMS data indicated that there was some evidence of limited infringement of the closed area which seemed to relate to a bathymetric feature (a protrusion of the deepest level of the slope) that extends offshore reaching a depth of 600 and 800 m. This feature is symptomatic of a canyon which is a habitat generally targeted by shrimpfisheries that are the most commonly practiced and profitablefisheries activity in this area.
In general, the highest values offishing intensity were recorded on the continental shelf compared to the upper slope (Table 1). Within the continental shelf, the lowest values offishing intensity occurred inside the Gulf of Sant0Agata, and varied from 0.032 to 0.367 swept area/year. The highest values offishing intensity on the continental shelf occurred inside the Gulf of Sant0Eufemia, and varied from 0.743 to 6.638 swept area/year. The Gulf of Sant0Eufemia also had the highest values of
fishing intensity for
the upper slope, that ranged from 0.933 to 2.982 swept area/year, whereas the fishing intensity in the Gulf of Sant0Agata varied between 0.096 and 1.180swept area/year.
3.2. Environmental characteristics of sampling sites
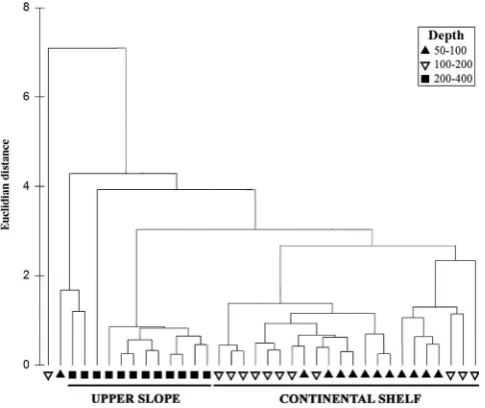
A cluster diagram (Fig. 3) and subsequent ANOSIM test showed that there were significant differences in the environmental variables among the three depth levels (ANOSIM, R¼0.239,
po0.001). Pairwise tests indicated significant differences between depth levels 50–100 and 200–400 (ANOSIM test R¼0.396, po0.001), 100–200 and 200–400 (ANOSIM test R¼0.219, po0.001). As there was no significant difference between the two shallowest depth levels they were considered as a single ‘continental shelf0category of 50–200 mcfthe 200–400 m‘upper slope’. This pattern was consistent for all three Gulfs. In general, thefinest fraction of sediments was highest on the slope where no sand fraction was present in the sediment (Table 1). Pearson correlations of environmental variables with fishing intensity within the continental shelf and upper slope habitats showed that there was no correlation between fishing intensity and the environmental variables (Table 2). The sand and silt fractions were correlated with median particle size in the continental shelf, whereas silt and clay fractions were correlated with the median particle size in the upper slope (Table 2). One pair of variables were autocorrelated but only in the upper slope sites, hence both were retained in the analysis.
3.3. Infaunal community
The BIOENV analysis with the infaunal abundance data for the continental shelf habitat showed that the ordination was best explained by the two variables percentage of clay and median particle size (Rho¼0.342). The ordination of infaunal abundance data for the upper slope habitat was best explained by depth and percentage silt content (Rho¼0.278). These low correlation coeffi -cients indicate that other factors explain the patterns in the infaunal community data.
A one-way ANOSIM revealed that fishing had a significant effect on the species abundance data in the continental shelf (ANOSIM,R¼0.194, po0.05) but not in the upper slope. For the continental shelf the pairwise tests showed that there was a significant difference only between the Fishery Exclusion Zone and the highfishing intensity range (R¼0.261,po0.05). Asfishing activity did occur (illegally) inside the EFZ, a second ANOSIM test was performed on the upper slope dataset allocating data from two of the EFZ to low and high categories of fishing intensity (Fig. 4). The two samples were located inside the central portion of the gulf nearest the boundary of the closure, in proximity to an area where VMS data analysis highlighted two different levels of
fishing intensity (dashed line inFig. 2b). Based on typicalfishing speeds, it was estimated that it was possible for a vessel to transit from the nearest VMS record to the location of these sample sites and return without detection by the VMS. The ANOSIM test achieved once this change had been made showed a significant
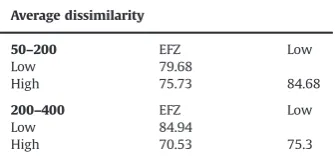
effect on species abundance (ANOSIM,R¼0.549,po0.05). Simila-rities among samples were visualised using Multi-Dimensional Scaling (MDS) (Figs. 4 and 5) and show how these two sample sites group most strongly with thefished sites outside the EFZ (dashed circle inFig. 5). A SIMPER analysis highlighted those taxa that accounted for the differences between the differentfishing inten-sity categories found on the continental shelf and the upper slope (Table 3). The average dissimilarly values between the three
fishing intensity categories are reported in Table 4. The number
of taxa that contributed to the average similarity was highest in the EFZ in the Gulf of Patti, in contrast to the sites subjected to the highest level offishing intensity that were characterised by the presence of a very restricted number of taxa. In contrast, only three families of polychaetes contributed to the average of simi-larity in the EFZ on the upper slope. The average of dissimisimi-larity was highest between the low and high categories of fishing intensity on the shelf and between the EFZ and the low level of
fishing disturbance on the upper slope.
The overall macro-benthic community found in the fishing grounds along the study area was dominated by deep burrowing infaunal deposit feeders. The infaunal community at all sites was generally dominated by polychaetes of which the Maldanidae and Capitellidae were the most common families. The sub-surface feeding Maldanidae were found across all levels of fishing dis-turbance in both shelf and slope habitats. On the continental shelf,
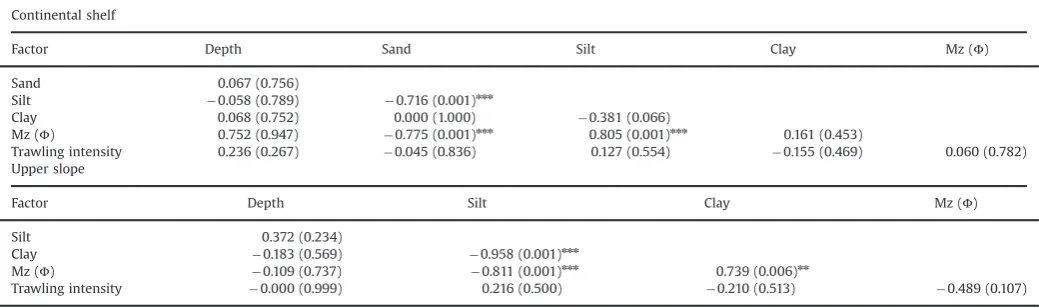
Table 2
Correlation analysis of physical environmental metrics and trawling intensity for the continental shelf (50–200 m), and the upper slope (200–400 m) areas. Pearson correlation coefficients are shown withpvalues in parentheses. The degrees of freedom were, d.f.¼22 for the continental shelf and d.f.¼10 for the upper slope. The asterisks
indicate significant correlationnnn
po0.001. A Bonferroni correction was applied to account for multiple testing. Continental shelf
Factor Depth Sand Silt Clay Mz (Φ)
Sand 0.067 (0.756)
Silt 0.058 (0.789) 0.716 (0.001)nnn
Clay 0.068 (0.752) 0.000 (1.000) 0.381 (0.066)
Mz (Φ) 0.752 (0.947) 0.775 (0.001)nnn 0.805 (0.001)nnn 0.161 (0.453)
Trawling intensity 0.236 (0.267) 0.045 (0.836) 0.127 (0.554) 0.155 (0.469) 0.060 (0.782) Upper slope
Factor Depth Silt Clay Mz (Φ)
Silt 0.372 (0.234)
Clay 0.183 (0.569) 0.958 (0.001)nnn
Mz (Φ) 0.109 (0.737) 0.811 (0.001)nnn 0.739 (0.006)nn
Trawling intensity 0.000 (0.999) 0.216 (0.500) 0.210 (0.513) 0.489 (0.107)
the density of Spionidae, Cirratulidae, Lumbrineridae, and the thalassinid shrimp Jaxea nocturna attained significantly higher abundances within the EFZ. Notably the polychaete family Poeci-lochaetidae together with some “rare species”as three decapod crustaceans, the two scavengers Liocarcinus navigatorandEbalia tuberosa, and the burrowerCallianassa subterranea, three bivalve molluscs Tropidomya abbreviata, Mendicula ferruginosa and Thyasira alleniand the ophiuroid echinodermAmphiurafiliformis were collected exclusively from within the EFZ. In contrast, Glyceridae (mobile predatory polychaetes) were more abundant at sites subjected to high levels offishing intensity.
Fig. 5.Multidimensional scaling plots of infaunal abundance data for the samples from the upper slope (200–400 m). Left MDS plot considering the four samples inside the EFZ as unfished. Right MDS plot considering two of four EFZ samples to be subjected tofishing activity.Note: dashed circles indicated the samples affected by possible illegal fishing activity.
Table 3
Output from the SIMPER analysis for the community data from the continental shelf and upper slope. Only those taxa that contributed 90% of the similarity are shown for sites within each of the differentfishing intensity categories.
Continental shelf Av. Density Con. % Code Upper slope Av. Density Con. % Code (50–200 m) √N/0.5 m2 (200–400 m) √N/0.5 m2
EFZ EFZ
Average similarity: 35.63 Average similarity: 22.64
Maldanidae 1.54 19.25 P Capitellidae 1.28 71.89 P
Lumbrineridae 1.09 11.99 P Spionidae 0.65 15.19 P
Cirratulidae 1.05 10.14 P Maldanidae 0.89 12.92 P
Glyceridae 0.92 9.98 P
Capitellidae 1.06 9.85 P
Spionidae 1.02 7.63 P
Nephtyidae 0.65 4.27 P
Eunicidae 0.64 4.17 P
Sternaspis scutata 0.88 4.01 P
Alpheus glaber 0.59 3.64 C
Oenonidae 0.47 2.33 P
Jaxea nocturna 0.47 2.12 C
Terebellidae 0.47 2.02 P
Lowfishing intensity Lowfishing intensity Average similarity: 17.12 Average similarity: 19.46
Nucula sulcata 0.80 38.84 M Maldanidae 1.22 75.07 P
Maldanidae 0.92 25.58 P Abra longicallus 0.65 24.93 M
Terebellidae 0.45 8.37 P
Eunicidae 0.45 5.34 P
Phyllodocidae 0.45 4.70 P
Abra alba 0.33 3.37 M
A. glaber 0.30 3.07 C
Amphinomidae 0.30 2.86 P
High Fishing intensity High Fishing intensity Average similarity: 25.29 Average similarity: 43.58
A. glaber 0.87 15.89 C Maldanidae 1.40 28.67 P
Oestergrenia digitata 0.87 15.89 E A. longicallus 1.36 26.47 M
Sternaspis scutata 0.87 15.89 P Capitellidae 1.15 13.85 P
Capitellidae 1.11 12.44 P Terebellidae 0.89 13.14 P
Glyceridae 1.04 11.55 P Eunicidae 0.65 5.41 P
Eunicidae 0.79 9.45 P Nephtyidae 0.59 5.29 P
Maldanidae 1.24 9.45 P
Fishing intensity categories were: EFZ¼nofishing, Low¼0.001–1.000, High¼1.001–6.368 swept area/year. Abbreviation codes: Av. Density¼number of individuals N/0.5 m2,
Con. %¼percentage contribution to the overall similarity, P¼Polychaetes, C¼Crustacea, E¼Echinodermata, M¼Mollusca.
Table 4
Average of dissimilarity between the three fishing intensity categories EFZ, Low and High.
Average dissimilarity
50–200 EFZ Low
Low 79.68
High 75.73 84.68
200–400 EFZ Low
Low 84.94
Only organisms belonging to two families of polychaetes showed significant differences in the upper slope. Subsurface deposit feeding Capitellidae had significantly higher densities within the EFZ and highly exploited sites. The surface deposit feeding Terebellidae reached the highest density in proximity to the higher levels offishing intensity (Table 5). Orbinid polychaetes were found only inside the EFZ on the upper slope.
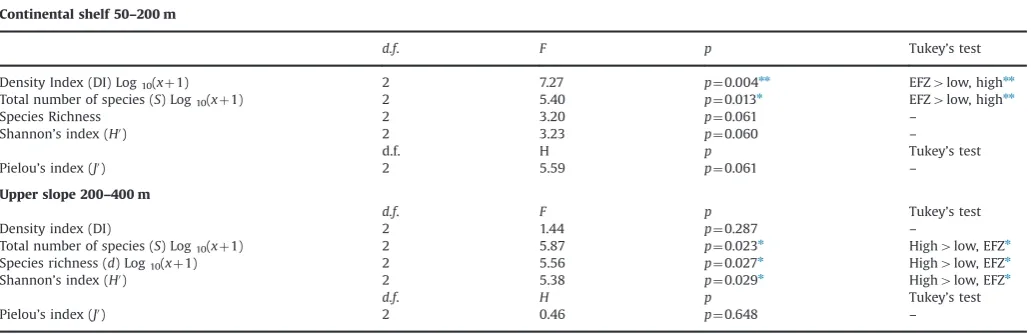
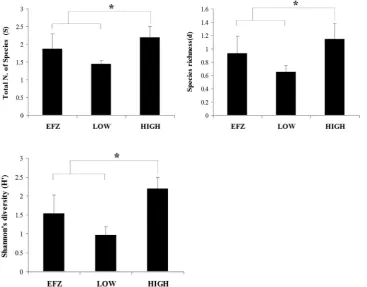
On the continental shelf the gross community metrics revealed that the density index (N) and the species richness (S) were significantly different across the different categories of fishing intensity. The indices showed the same trend with the highest values found in the EFZ in the Gulf of Patti (Table 6,Fig. 6). The other three indices of species diversity, Shannon’s and Pielou’s, were similar at all sites. In the upper slope, three of the univariate diversity indices were significantly different (the total number of species (S), the species richness (d) and the Shannon’s diversity) (Table 6, Fig. 7). For all three indices the highest values were recorded at the higher level of disturbance.
4. Discussion
The present study considered the response of benthic infaunal communities to a gradient of fishing disturbance within the
continental shelf and upper slope where demersal otter trawling in the Mediterranean is most intense (Dimech et al., 2008; de Juan et al., 2009; Mangano et al., 2013). The sites sampled during this study were originally chosen without reference to VMS data, thus the analysis of VMS data was retrospective in this respect and explains why the distribution of sites among different intensities offishing disturbance and depth zones was not balanced. Never-theless, given the paucity of such studies that examine fishing effects at the scale of thefleet, we propose that the present study provides some valuable insights into the effects of otter-trawling in the Mediterranean basin. The evaluation offishing intensity measures using VMS data offered the opportunity to define an accurate gradient of trawling impact and thereby to detect with a great precision the degree of disturbance on infaunal communities from fishing ground, as underlined by the differences obtained after comparing the infaunal community from the EFZ and the less trawled areas in the continental shelf. The improved accuracy for estimatingfishing effort at a small scale using VMS data was also evident in the upper slope where, the spatial distribution analysis offishing intensity inside the EFZ helped us to infer that illegal
fishing may have occurred within the closed area (Hinz et al., 2013).
As highlighted in previous experimental and short-term studies on this type of habitat in the Mediterranean Sea, the fauna was Table 5
Kruskal–Wallis tests (H) and one-way ANOVA test (F) of the response of key species or taxa to different levels offishing intensity within each of the different depth zones. A full list of species density with measures of error are given in supplementary materials.
Taxa df H/F p Tukey’s test
Continental shelf 50–200 m Capitellidae 2 H¼7.75 p¼0.021n EFZ4high
Cirratulidae 2 H¼9.98 p¼0.007nn EFZ4high4low
Glyceridae 2 H¼6.44 p¼0.040n High4EFZ4low
J. nocturna 2 H¼6.55 p¼0.038n EFZ
4low, high
Lumbrineridae 2 H¼7.20 p¼0.027n EFZ
4high4low
Spionidae 2 H¼9.65 p¼0.008nn EFZ
4high Upper slope 200–400 m Capitellidae Log10(xþ1) 2 F¼6.19 p¼0.020n EFZ4lowohigh
Terebellidae 2 H¼8.56 p¼0.036n High4EFZ
The ranges offishing intensity were respectively: EFZ¼nofishing, low¼0.001–1.000, high¼1.001–6.368 swept area/year.
Post-hoc multi-comparison Tukey’s test results are presented, asterisks indicatepvaluesnnn po0.001. n
po0.05 Post-hoc multi-comparison Tukey’s test results are presented, asterisks indicatepvalue.
nn
po0.01 Post-hoc multi-comparison Tukey’s test results are presented, asterisks indicatepvalue.
Table 6
Results of the one-way ANOVA and Kruskal–Wallis tests, for tests of the response of univariate community metrics (based on abundance data) to variations infishing intensity set as a factor.
Continental shelf 50–200 m
d.f. F p Tukey’s test
Density Index (DI) Log10(xþ1) 2 7.27 p¼0.004nn EFZ
4low, highnn Total number of species (S) Log10(xþ1) 2 5.40 p¼0.013n EFZ4low, highnn
Species Richness 2 3.20 p¼0.061 –
Shannon’s index (H0) 2 3.23 p
¼0.060 –
d.f. H p Tukey’s test
Pielou’s index (J0) 2 5.59 p¼0.061
–
Upper slope 200–400 m
d.f. F p Tukey’s test
Density index (DI) 2 1.44 p¼0.287 –
Total number of species (S) Log10(xþ1) 2 5.87 p¼0.023n High4low, EFZn
Species richness (d) Log10(xþ1) 2 5.56 p¼0.027n High4low, EFZn
Shannon’s index (H0) 2 5.38 p¼0.029n High
4low, EFZn
d.f. H p Tukey’s test
Pielou’s index (J0) 2 0.46
p¼0.648 –
nnn
po0.001 Post-hoc multi-comparison Tukey’s test results are given, asterisks indicatepvalue.
The ranges offishing intensity were respectively: EFZ¼nofishing, low¼0.001–1.000, high¼1.001–6.368 swept area/year.
n
po0.05 Post-hoc multi-comparison Tukey’s test results are given, asterisks indicatepvalue.
nn
generally impoverished, even the area where no fishing distur-bance had occurred for several decades (Pranovi et al., 2005; Smith et al., 2000; de Juan et al., 2007; 2011). The presence of impover-ished communities characterised by the reduction in the total number of species and density in the most highly exploited areas (Smith et al., 2000), confirmed that the infaunal communities were negatively affected byfishing disturbance.
In general the fished areas of seabed were dominated by a relatively homogeneous community of sedentary vermiform sub-surface deposit feeders (Maldanidae) and, opportunistic organisms such as scavenging carnivores (Glyceridae) were more character-istic of sites that experienced the higher values of fishing disturbance. In contrast, fragile particle feeders (reef-forming tube-worms as Spionidae) and fragile bioturbators (J. nocturna andAlpheus glaber) were mainly present only inside the EFZ area.
Both multivariate community analyses and univariate community metrics changed with the level of fishing disturbance on the continental shelf. However, on the upper slope the community responses tofishing disturbance were evident only for univariate community metrics (Table 6, Fig. 7). The lack of such a clear response tofishing disturbance within the upper slope areas may be due a lack of statistical power due to the confounding effects of illegalfishing activity at the sample sites adjacent to the boundary of the Fishery Exclusion Zone inside the Gulf of Patti. This latter hypothesis is supported by the vessel monitoring system data analysis that showed the presence offishing activity within the EFZ that could have extended to encompass the area from which the upper slope samples were taken. Both of the sampling sites that were located closest to confirmed VMS records within the EFZ had community structures that were most similar to areas of the Fig. 7.Response of the total number of species (S), Species richness (d) and Shannon’s diversity index (H0) (795% CI) along a gradient of
fishing intensity from zero, inside the EFZ, to the highest level of exploitation along the upper slope. The data are shown as Log10(xþ1) transformed values. Significant differences are indicated byn
po0.05. Plots correspond to significant results from the ANOVA test (Table 5).
Fig. 6.Mean (795% CI) total number of species (S) and total number of individuals (N) along a gradient offishing intensity from zero, inside the EFZ, to the highest level of exploitation along the continental shelf. The data are shown as Log10(xþ1) transformed values. Significant differences are indicated bynnpo0.01. Plots correspond to
upper slope subjected to either low or high levels of fishing disturbance (Fig. 5).
The response of the infaunal community on the upper slope to
fishing disturbance is perhaps not intuitive, however a recent study in the Mediterranean demonstrated that demersal trawling leads to significant transport of organic material and sediment off the continental shelf and down the slope (Puig et al., 2012). As otter trawling disturbs the upper layers of sediment this leads to the remobilisation of labile organic material. If the latter is transported down the slope then this would represent a subsidy to biota that feed on organic material (Aller, 1982; Hall, 1994; Hill et al., 1999; Thrush et al., 2008; Palanques et al., 2001). The consequent increase in the availability of organic matter in the sediment may result in an increase in deposit feeders and their associated demersal fish predators (Frid et al., 2000). This may explain why the Terebellidae are more common on the upper slope. Most of the species collected in these areas are subsurface motile burrowers with a more robust body structure and moderate vulnerability that may be located below the depth of penetration by thefishing gear (e.g. the bivalveAbra longicallus) (Philippart, 1998; Ramsay et al., 1998; Smith et al., 2000; Brown et al., 2005). In contrast, in the absence offishing, fragile subsurface organisms, such as the sedentary deposit feeding Cirratulidae and Spionidae, were more abundant in the EFZ together with bioturbating decapod crustaceans and fragile sedentary surface feeding ophiur-oids asA.filiformis. The notable absence of bioturbating fauna in
fished areas of the seabed indicates the potential for a loss of some ecosystem functions that maintain the structure and oxyge-nation of muddy sediment habitats (Reise, 1981; Fenchel, 1996; Widdicombe et al., 2004). The loss of such organisms would presumably lead to changes in habitat complexity and community structure (Jennings and Kaiser, 1998).
Interestingly this study focused not only on the continental shelf but also on the upper slope for which the impact of trawling remains little studied despite the importance of this area of seabed to thefishingfleet in the Mediterranean basin. The magnitude of the response of benthic infaunal communities to otter trawl disturbance was much more pronounced in the continental shelf compared with the upper slope. Although thefinding for the latter may in part be due to an issue of statistical power, this area of seabed appears to be naturally impoverished in terms of faunal diversity. If this holds true, then demersalfishing impact may be much less pronounced in this habitat compared with others.
5. Conclusions
The present study highlights the important role that areas closed to fishing perform by acting as baselines against which communities subjected to fishing disturbance can be compared. Such comparative areas allow a robust assessment of the magni-tude of the response of communities tofishing disturbance which could form the basis of developing a management regime to reduce such effects. Soft bottom ecosystems remain poorly studied although they are considered among the most productive, provid-ing habitats for many exploited commercial species with high economic value (Hinz et al., 2009; de Juan et al., 2009; Dimech et al., 2012). The access to VMS data proved an invaluable tool to provide insights into the potential confounding effects of illegal
fishing in some areas of the EFZ, and thereby informed the interpretation of the results.
Given that the Fishery Exclusion Zone of the Gulf of Patti has been in place for 22 years, although there are significant and clear differences in benthic community composition on the continental shelf compared with surroundingfished areas, there is sufficient overlap in the community structure to suggest that recovery could
be relatively rapid within fishing grounds in the event that demersalfishing were to be removed from an area.
Acknowledgments
The VMS data were provided in a raw, uninterpreted form, by the Italian Coast Guard (FMC—Fishing Monitoring Centre, Rome), we are particularly grateful to the C.C. Dario Cau, Acting Head of Section Maritime Traffic monitoring, the L.T. Luigia Caiazzo and Loredana Valentino (e-geos). We would like to thank Dr. Andrea Cosentino (DISBA, Benthic Ecology Laboratory, University of Messina) for his help and commitment during the taxonomic determination of polychaetes. Our thanks are also expressed to Dr. Antonello Sala (Resp. Reparto Tecnologia della Pesca CNR— ISMAR, Ancona), who kindly provided different technical advices.
Appendix A. Supporting information
Supplementary data associated with this article can be found in the online version athttp://dx.doi.org/10.1016/j.csr.2013.12.014.
References
Aller, R., 1982. The effects of macrobenthos on chemical properties of marine sediment and overlying water. In: McCall, P.L., Tevesz, M.J.S. (Eds.), Animal-Sediment Relationship. Plenum Press, New York, pp. 53–102
Auster, P.J., Malalesta, R.J., Langton, R.W., Watling, L., Valentine, P.C., Donaldson, C.L. S., Langton, E.W., Shepard, A.N., Babb, I.G., 1996. The impact of mobilefishing gear on seafloor habitats in the Gulf of Maine (Northwest Atlantic). Implications for conservation offish populations. Rev. Fish. Sci. 4, 185–202.
Bastardie, F., Nielsen, J.R., Ulrich, C., Egekvist, J., Degel, H., 2010. Detailed mapping of
fishing effort and landings by couplingfishing logbooks with satellite-recorded vessel geo-location. Fish. Res. 106, 41–53.
Browman, H.I, Stergiou, K.I., 2005. Politics and socio-economics of ecosystem-based management of marine resources. Mar. Ecol. Prog. Ser. 300, 241–296. Brown, E., Finney, B., Dommisse, M., Hills, S., 2005. Effects of commercial otter
trawling on the physical environment of the southeastern Bering Sea. Cont. Shelf Res. 25, 1281–1301.
Buchanan, J.B., 1984. Sediment analysis. In: Holme, NA, McIntyre, AD (Eds.), Methods for the Study of Marine Benthos. Blackwell Scientific Publications, Oxford and Edinburgh, pp. 41–65
Cacaud, P., 2005. Fisheries laws and regulations in the Mediterranean: a compara-tive study. Studies and Reviews. General Fisheries Commission for the Medi-terranean, No 75. FAO, Rome
Clarke, K.R., Ainsworth, M., 1993. A method of linking multivariate community structure to environmental variables. Mar. Ecol. Prog. Ser. 92, 205–219. Clarke, K.R., Warwick, R.M., 1994. Similarity-based testing for community pattern:
the two-way layout with no replication. Mar. Biol. 118, 167–176.
Clarke, K.R., Gorley, R.N., 2006. Primer v6: User Manual/Tutorial. PRIMER-E, Plymouth.
Commission of the European Communities (COM), 2008. Communication from the Commission to the Council and the European Parliament. The Role of the CFP in Implementing an Ecosystem Approach to Marine Management. European Commission, Brussels p. 187
Dayton, P.K., Thrush, S.F., Agardy, M.T., Hofman, R.J., 1995. Environmental effects of marinefishing. Aquat. Conserv. 5, 205–232.
de Groot, S.J., 1984. The impact of bottom trawling on benthic fauna of the North Sea. Oceanogr. Manage. 9, 177–190.
de Juan, S., Thrush, S., Demestre, M., 2007. Functional changes as indicators of trawling disturbance on a benthic community located in afishing ground (NW Mediterranean Sea). Mar. Ecol. Prog. Ser. 334, 117–129.
de Juan, S., Demestre, M., Thrush, S., 2009. Defining ecological indicators of trawling disturbance when everywhere that can befished isfished: a Mediterranean case study. Mar. Policy 33, 472–478.
de Juan, S., Demestre, M., Sánchez, P., 2011. Exploring the degree of trawling disturbance by the analysis of benthic communities ranging from a heavily exploited fishing ground to an undisturbed area in the NW Mediterranean. Sci. Mar. 75 (3), 507–516.
de Juan, S., Demestre, M., 2012a. A trawl disturbance indicator to quantify large scalefishing impact on benthic ecosystems. Ecol. Indic. 18, 183–190. de Juan, S., Moranta, J., Hinz, H., Barberá, C., Ojeda-Martinez, C., Oro, D., Ordines, F.,
Ólafsson, E., Montserrat, D., Massutí, E., Lleonart, J., 2012b. A regional network of sustainable managed areas as the way forward for the implementation of an ecosystem-based fisheries management in the mediterranean. Ocean Coast. Manage. 65, 51–58.
within and outside the Maltese Fishery Management Zone (FMZ). Sci. Mar. 72 (4), 669–682.
Dimech, M., Kaiser, M.J., Ragonese, S., Schembri, P.J., 2012. Ecosystem effects of
fishing on the continental slope in the Central Mediterranean Sea. Mar. Ecol. Prog. Ser. 449, 41–54.
Dinmore, T.A., Duplisea, D.E., Rackham, B.D., Maxwell, D.L., Jennings, S., 2003. Impact of a large-scale area closure on patterns offishing disturbance and the consequences for benthic communities. ICES J. Mar. Sci. 60, 371–380. EC (European Commission), 1997. Commission regulation (EC) no. 1489/97 of 29
July 1997 laying down detailed rules for the application of Council regulation (EEC) No 2847/93 as regards satellite-based vessel monitoring systems. Off. J. Eur. Union L202, 18–23.
EC (European Commission). 2003. Council Regulation (EC) No. 2244/2003 of 18 December 2003 Laying Down Detailed Provisions Regarding Satellite Based Vessel Monitoring Systems.
EC (European Commission), 2008a. Commission decision of 6 November 2008 adopting a multiannual community programme pursuant to Council regulation (EC) No 199/2008 establishing a community framework for the collection, management and use of data in thefisheries sector and support for scientific advice regarding the Common Fisheries Policy (2008/949/EC). Off. J. Eur. Union L346, 37–88.
EC (European Commission), 2008b. Commission regulation (EC) No. 665/2008 of 14 July 2008 laying down detailed rules for the application of Council regulation (EC) No 199/2008 concerning the establishment of a community framework for the collection, management and use of data in thefisheries sector and support for scientific advice regarding the Common Fisheries Policy. Off. J. Eur. Union L186, 3–5.
FAO, 2003. Fisheries Management. 2. The Ecosystem Approach to Fisheries. FAO, Rome p. 112
FAO, April 2010. General Fisheries Commission for the Mediterranean, 2010. Report of the Thirty-fourth Session. Athens, Greece, 12–17. (pp)FAO, Rome p. 98(GFCM Report. No. 34)
Fenchel, T., 1996. Worm burrows and oxic microniches in marine sediments. 1. Spatial and temporal scales. Mar. Biol. 127, 289–295.
Folk, R.L., Ward, W.C., 1957. Brazos River bar: a study in the significance of grain size parameters. J. Sediment. Petrol. 27, 3–26.
Frid, C., Harwood, K., Hall, S., Hall, J., 2000. Long-term changes in the benthic communities on North Seafishing grounds. ICES J. Mar. Sci. 57, 1303–1309. Frid, C., Paramor, O., Scott, C., 2005. Ecosystem-based fisheries management:
progress in NE Atlantic. Mar. Policy 29, 461–469.
Greco, S., Cavaliere, A., Perdichizzi, F., Cammaroto, S., 1993. Sintesi dell’attività svolta dall’unita operativa“T6”: Terreno Meridionale (Da Capo Suvero a Capo San Vito).—Atti del seminario nazionale delle unita operative italiane svoltosi presso l’Istituto di Tecnologia della Pesca e del Pescato di Mazara del Vallo: "La
valutazione delle risorse demersali dei mari italiani”. N.T.R.-I.T.P.P, 2. Special Publication, pp. 139–141.
Greco, S., 1994. Considerazioni sullo stato di sfruttamento delle risorse demersali (Capo Suvero-San Vito Lo Capo). Biol. Mar. Mediterr. 1, 61–66.
Hall, S.J., 1994. Physical disturbance and marine benthic communities. Life in unconsolidated sediments. Oceanogr. Mar. Biol. Ann. Rev. 32, 179–239. Hall, S.J., 1999. The Effects of Fishing on Marine Ecosystems and Communities.
Blackwell Scientific Publications, Oxford UK
Hill, A., Veale, L., Pennington, D., Whyte, S., Brand, A., Hartnoll, R., 1999. Changes in Irish Sea benthos: possible effects of 40 years of dredging. Estuarine Coastal Shelf Sci. 48, 739–750.
Hintzen, N.T., Bastardie, F., Beare, D., Piet, G., Ulrich, C., Deporte, N., Egekvist, J., Degel, H., 2012. VMStools: open-source software for the processing, analysis and visualization offisheries logbook and VMS data. Fish. Res. 115-116, 31–43. Hinz, H., Prieto, V., Kaiser, M.J., 2009. Trawl disturbance on benthic communities:
chronic effects and experimental predictions. Ecol. Appl. 19 (3), 761–773. Hinz, H., Murray, L.G., Lambert, G.I., Hiddink, J.G., Kaiser, M.J., 2013. Confidentiality
overfishing effort data threatens science and management progress. Fish Fish. 14 (1), 110–117.
Internal Report CNR (Ministero della Marina Mercantile Consiglio Nazionale delle Ricerche) (Eds.) (1988) ATTI: Seminari delle Unità Operative Responsabili dei Progetti di Ricerca Promossi nell’Ambito dello Schema Preliminare di Piano per la Pesca e l’Acquacultura, Vol III. Ministero della Marina Mercantile—Consiglio Nazionale delle Ricerche, Rome, pp. 1295 1335, 1411 1451.
Jennings, S., Kaiser, M.J., 1998. The effects offishing on marine ecosystems. Adv. Mar. Biol. 34, 201–352.
Kaiser, M.J., de Groot, S.J., 2000. The Effects of Fishing on Non-target Species and Habitats. Biological, Conservation and Socio-economic Issues. Blackwell Scien-tific Publications, Oxford UK
Kaiser, M.J., Clarke, K.R., Hinz, H., Austen, M.C.V., Somerfield, P.J., Karakassis, I., 2006. Global analysis and prediction of the response of benthic biota tofishing. Mar. Ecol. Prog. Ser. 311, 1–14.
Lambert, G.I., Jennings, S., Kaiser, M.J., Hinz, H., Hiddink, J.G., 2011. Quantification and prediction of the impact offishing on epifaunal communities. Mar. Ecol. Prog. Ser. 430, 71–86.
Lambert, G.I., Hiddink, J., Hintzen, N.T., Hinz, H., Kaiser, M.J., Murray, L., Jennings, S., 2012. Implications of using alternate methods of vessel monitoring system (VMS) data analysis to describefishing activities and impacts. ICES J. Mar. Sci. 69, 682–693.
Lee, J., South, A.B., Jennings, S., 2010. Developing reliable, repeatable, and accessible methods to provide high-resolution estimates offishing-effort distributions from vessel monitoring system (VMS) data. ICES J. Mar. Sci. 67, 1260–1271. Levin, P.S., Fogarty, M.J., Murawski, S.A., Fluharty, D., 2009. Integrated ecosystem
assessments: developing the scientific basis for ecosystem-based management of the Ocean. PLoS Biol. 7 (1), e1000014, http://dx.doi.org/10.1371/journal. pbio.1000014.
Mangano, M.C., Kaiser, M.J., Porporato, E.M.D., Spanò, N., 2013. Evidence of trawl disturbance on mega-epibenthic communities in the Southern Tyrrhenian Sea. Mar. Ecol. Prog. Ser. 475, 101–117.
Mills, C.M., Townsend, S.E., Jennings, S., Eastwood, P.D., Houghton, C.A., 2007. Estimating high resolution trawl fishing effort from satellite-based vessel monitoring system data. ICES J. Mar. Sci. 64, 248–255.
Murawski, S.A., Wigley, S.E., Fogarty, M.J., Rago, P.J., Mountain, D.G., 2005. Effort distribution and catch patterns adjacent to temperate MPAs. ICES J. Mar. Sci. 62, 1150–1167.
Norse, E., Watling, L., 1999. Impacts of mobile fishing gear: the biodiversity perspective. In: Benaka, L. (Ed.), Fish Habitat: Essential Fish Habitat and Rehabilitation. American Fisheries Society, Bethesda, MD, pp. 31–40 Palanques, A.J., Guillen, P., Puig, P., 2001. Impact of bottom trawling on water
turbidity and muddy sediment of an unfished continental shelf. Limnol. Oceanogr. 46, 1100–1110.
Pauly, D., Christensen, V., Dalsgaard, J., Froese, R., Torres , F., 1998. Fishing down marine food webs. Science 279, 860–863.
Philippart, C., 1998. Long-term impact of bottomfisheries on several by-catch species of demersalfish and benthic invertebrates in the south-eastern North Sea. ICES J. Mar. Sci. 55, 342–352.
Piet, G.J., Quirijns, F.J., Robinson, L., Greenstreet, S.P.R., 2007. Potential pressure indicators forfishing, and their data requirements. ICES J. Mar. Sci. 64 (110–121). Pikitch, E.K., Santora, C., Babcock, E.A., Bakun, A., Bonfil, R., Conover, D.O., Dayton, P., Doukakis, P., Fluharty, D., Heneman, B., Houde, E.D., Link, J., Livingston, P.A., Mangel, M., McAllister, M.K., Pope, J., Sainsbury, K.J., 2004. Ecosystem-based
fishery management. Science 305, 346–347.
Pranovi, F., Raicevich, S., Libralato, S., Da Ponte, F., Giovanardi, O., 2005. Trawl Fishing Disturbance and Medium-term Macroinfaunal Recolonization Dynamics: A Functional Approach to the Comparison between Sand and Mud Habitats in the Adriatic Sea (Northern Mediterranean Sea). In: Barnes PT, Thomas JP (Eds.) Benthic Habitats and the Effects of Fishing.
Puig, P., Canals, M., Company, J.B., Martín, J., Amblas, D., Lastras, G., Palanques, A., Calafat, A.M., 2012. Ploughing the deep seafloor. Nat. Lett., http://dx.doi.org/ 10.1038/nature11410
Ramsay, K., Kaiser, M.J., Hughes, R.N., 1998. Responses of benthic scavengers to
fishing disturbance by towed gears in different habitats. J. Exp. Mar. Biol. Ecol. 224 (1), 73–89.
Reise, K., 1981. High abundance of small zoobenthos around biogenic structures in tidal sediments of the Wadden Sea. Helgoländer wissenschaftliche Meeresun-tersuchungen 34, 413–425.
Sala, A., Prat Farran, J.A., Antonijuan, J., Lucchetti, A., 2009. Performance and impact on the seabed of an existing- and an experimental-otterboard: comparison between model testing and full-scale sea trials. Fish. Res. 100, 156–166. Sala, A., Lucchetti, A., 2012. Impact and performance of Mediterraneanfishing gear
by side-scan sonar technology. Can. J. Fish. Aquat. Sci. 69, 1–10.
Sinclair, M., Valdimarsson, G., 2003. Responsible Fisheries in the Marine Ecosystem. CABI Publishing, Cambridge, MA
Smith, C.J., Papadopoulou, K.N., Diliberto, S., 2000. Impact of otter trawling on an eastern Mediterranean commercial trawlfishing ground. ICES J. Mar. Sci. 57, 1340–1351.
Stelzenmüller, V., Breen, P., Stamford, T., et al., 2013. Monitoring and evaluation of spatially managed areas: a generic framework for implementation of ecosystem based marine management and its application. Mar. Policy 37 (1), 149–164.
Thrush, S., Hewitt, J., Cummings, V., Dayton, P., 1995. The impact of habitat disturbance by scallop dredging on marine benthic communities: what can be predicted from the results of experiments? Mar. Ecol. Prog. Ser. 129, 141–150.
Thrush, S., Halliday, J., Hewitt, J.E., Lohrer, A.M., 2008. The effects of habitat loss, fragmentation, and community homogenization on resilience in estuaries. Ecol. Appl. 18, 12–21.