Sustainable Forest Management
© 2003 Forest & Wood Products Research & Development Corporation All rights reserved.
Publication: Effect of forest harvesting on soil physical properties: Developing and evaluating meaningful soil indicators of sustainable forest management in
southeastern Australia
The Forest and Wood Products Research and Development Corporation (“FWPRDC”) makes no warranties or assurances with respect to this publication including merchantability, fitness for purpose or otherwise. FWPRDC and all persons associated with it exclude all liability (including liability for negligence) in relation to any opinion, advice or information contained in this publication or for any consequences arising from the use of such opinion, advice or information.
This work is copyright and protected under the Copyright Act 1968 (Cth). All material except the FWPRDC logo may be reproduced in whole or in part, provided that it is not sold or used for commercial benefit and its source (Forest and Wood Products Research and Development Corporation) is acknowledged. Reproduction or copying for other purposes, which is strictly reserved only for the owner or licensee of copyright under the Copyright Act, is prohibited without the prior written consent of the Forest and Wood Products Research and
Development Corporation.
Project no: PN99.805
Researchers:
S.T. Lacey, M.A. Rab., R.J. McCormack
CSIRO Forestry and Forest Products
PO Box E4008, Kingston ACT 2604 Tel: 02 6281 8312 Fax: 02 6281 8312
Forest and Wood Products Research and Development Corporation
PO Box 69, World Trade Centre, Victoria 8005
Effect of forest harvesting on soil physical properties:
Developing and evaluating meaningful soil
indicators of sustainable forest management
in southeastern Australia
Prepared for the
Forest & Wood Products
Research & Development Corporation
by
S.T. Lacey
M.A. Rab
R.J. McCormack
Preface
The Australian Government Wood and Paper Industry Strategy (1995) and forest industry provided funding for research projects on assessing the value and
applicability in Australian forests of particular indicators from the Montreal Process. The Forest and Wood Products Research and Development Corporation managed these projects and the key outputs were reports to the FWPRDC from 1999-2003,
when all projects were concluded. This report, PN99.805, is part of a series, which
includes those from:
PN97.104, PN97.601 & PN99.801, PN98.801, PN98.803, PN98.806, PN99.802, PN99.803, PN99.804, PN99.805, PN99.807, PN99.807 Part A, PN99.807 Part B, PN99.808, PN99.808 Part A, PN99.808 Part B, PN99.808 Part C, PN99.808 Part D, PN99.808 Part E1, PN99.808 Part E2, PN99.808 Part E3, PN99.808 Part E4, PN99.808 Part E5, PN99.809, PN99.810, PN99.811, PN99.812, PN99.814, PN99.814A.
The key findings of these projects were summarised in FWPRDC Project PN03.815
Table of Contents
SUMMARY ... viii
GENERAL INTRODUCTION ... xii
PART I EFFECT OF FOREST HARVESTING ON SOIL PHYSICAL PROPERTIES AND REGENERATION IN SOUTH EASTERN NEW SOUTH WALES ... XIV 1.0 Introduction ...1
2.0 Methods ...2
2.1 General Overview ...2
2.2 Study Sites ...2
2.3 Soil sampling equipment ...3
2.4 Logging Study...7
4.1 Soil Disturbance and Physical Property Changes...35
4.2 Machine Tracking ...36
4.3 Tree Volume in Relation to Disturbance ...37
4.4 Implications for Sustainability...38
4.5 Implications for Assessment of Sustainability...39
5.0 Conclusions ...40
Acknowledgements ...41
PART II EFFECT OF FOREST HARVESTING ON SOIL PHYSICAL PROPERTIES AND REGENERATION IN THE VICTORIAN CENTRAL HIGHLANDS ...42
Part II – Study A The degree and extent of soil disturbance on operational logging coupes ...43
3.1 Operational categories and soil disturbance classification...50
3.2. Operational Categories...50
3.3. Soil profile disturbance ...51
4.0 Discussion...53
5.0 Conclusions ...54
Acknowledgements ...55
Part II – Study B Soil physical properties and tree growth 10-yrs after logging...56
Summary ...56
1. Introduction ...57
2. Methods ...58
2.1 Study area ...58
2.2 Logging and seed-bed preparation ...59
2.3 Soil physical properties...59
2.4 Tree growth ...60
3. Results...62
3.2 Tree growth ...68
Part II – Study C A comparison of three sampling systems for assessment of soil sustainability indicators...79
Summary ...79
1.0 Introduction ...80
2.0 Methods ...81
2.1 Study area ...81
2.2 Harvesting and seed-bed preparation ...81
2.3 Pre-harvest sampling...81
2.4 Post-harvest sampling ...82
2.4 Characterisation of soil profile disturbance and fire intensity...84
2.5 Measurement of soil properties ...85
2.6 Soil sustainability indicators and total area affected...85
3.0 Results...86
3.1 Distribution of disturbed area ...86
3.2 Soil physical properties...88
3.3 Soil sustainability indicators and total area affected...96
4.0 Discussion...99
4.1 Effect of sampling method on accuracy and variability of soil sustainability parameters ...99
4.2 Effect of sampling intensity on the accuracy and variability of soil sustainability parameters...100
4.3 Interpretation of soil sustainability parameters ...100
5.0 Conclusions ...104
PART III – OVERVIEW...105
1.0 General Discussion...105
1.1 Capability and suitability of the interim soil physical indicator (4.1e) to characterise changes created by forest harvesting...105
1.2 Relationships between changes in soil physical properties and subsequent forest growth ...107
1.3 Temporal changes in soil physical properties...108
1.4 Evaluation of different methods of post-harvest indicator assessment to devise cost-effective procedures for monitoring ...109
1.5 Guidelines for selecting and characterising a network of reference sites suitable for long-term monitoring...110
2.0 Recommendations ...112
2.1 A framework for monitoring for indicator 4.1e...112
2.2 Necessary forest management response...112
2.3 Further research priorities ...113
3.0 Conclusions ...114
4.0 References...115
APPENDICES...A1
List of Tables
Part I
Table 1. Ground condition classification system used at compartment 551, Coupe 1, Yambulla State Forest (after Rab, 1999). ...13
Table 2. Disturbance classification categories of compartment 394. ...14
Table 3. Pre-logging mean bulk density of disturbed core and undisturbed core methods with and without correction for gravel content (Mg m-3). ...18
Table 4. Area and percent of coupe under various traffic intensity classes, log landings harvested area and undisturbed area...19
Table 5. Percent of coupe occupied by three types of ground classification estimated from two different survey methods...21
Table 6. Mean bulk density (Mg m-3) and post-hoc comparisons of different operational categories.. ...22
Table 7. Mean disturbed core bulk density (Mg m-3) without correcting for core gravel content and post-hoc comparisons of different operational categories...23
Table 8. Mean bulk density of disturbance classes and dominant horizon exposed classes.. ...23
Table 8. Mean stem volume (m3 ha-1) and variability by disturbance class for the two largest trees of each plot.. ...31
Table 9. Mean tree volume and results of analysis of variance multiple range test for various components of the track-type plots, all trees used.. ...33
Table 10. Least square mean of five largest trees per plot by disturbance class and aspect class...35
Part II Study A
Table 1. Summary of site characteristics, machinery configuration and logging records for ...20 operation logging coupes in the Victorian Central Highlands forest...46
Table 2. Distribution of aspect for 20 operational logging coupes in the Victorian Central Highlands forest. ...47
Table 3. Distribution of slope (degrees, % of coupe area) for 20 operational logging coupes in the Victorian Central Highlands forest...47
Table 4. Characteristics of timber extraction (snigging) machines...48
Table 5. The system used for classifying soil impacts following timber harvesting and before site preparation (after Rab, 1999)...49
Table 6. Percentage of, and variation in, logging coupe area occupied by each operation category following timber harvesting and prior to site preparation. ...51
Table 7. Percentage of, and variation in, logging coupe area occupied by soil disturbance category following timber harvesting and prior to site preparation. ...52
Part II Study B
Table 1. Texture for undisturbed and disturbed sites at three depths 10-yrs after logging in the Old Mill coupe...63
Table 2. Organic matter content (%) at three soil depths (mean + standard errors) in general logging areas, snig tracks and log landing 10-yrs after logging in the Old Mill coupe...64
Table 3. Effect of soil profile disturbance and compaction on bulk density (Mg m-3) at three soil depths (mean + standard errors) in general logging areas, snig tracks and log landing 10-yrs after logging in the Old Mill coupe. ...65
Table 4. Effect of soil profile disturbance and compaction on macroporosity (%) at three soil depths (mean + standard errors) in general logging areas, snig tracks and log landing 10-yrs after logging in the Old Mill coupe...67
Table 5: Models used to test the effect of soil disturbance category on the growth and productivity of Eucalyptus regnans F. Muell saplings on Old Mill coupe for the Compacted and
uncompacted analysis. ...69
Table 6. The confidence intervals of the difference between the E. regnans sapling growth and productivity variables of the undisturbed area and the mean of all other soil disturbance categories within each analysis type...69
Table 7. The number of dominant + co-dominant and intermediate + suppressed E. regnans
saplings observed in each soil disturbance category. ...75
Part II Study C
Table 1. A system for classifying soil impacts following timber harvesting and site preparation. 83
Table 2. Proportion of the coupe area (as % of total coupe area) affected by various operation categories (Mean ± SE displayed) assessed following timber harvesting and regeneration slash burning using three sampling methods for Dindi Mill coupe in the Toolangi forest district, Victoria. ...86
Table 3. Proportion of the coupe area (as % of total coupe area) affected by various soil disturbance categories (Mean ± SE displayed) assessed following timber harvesting and regeneration slash burning using three sampling methods for Dindi Mill coupe in the Toolangi forest district, Victoria. ...88
Table 4. Soil bulk density (BD, Mg m-3) affected by various operation categories (mean ± SE displayed) assessed following timber harvesting and regeneration slash burning using three sampling methods for Dindi Mill coupe in the Toolangi forest district, Victoria...91
Table 5. Soil Organic matter content (OM, %) affected by various operation categories (Mean ± SE displayed) assessed following timber harvesting and regeneration slash burning using three sampling methods for Dindi Mill coupe in the Toolangi forest district, Victoria...94
Table 6. Effect of sampling methods and level of operating standards of bulk density (BD) and organic matter content (OM) on the area (% of coupe area) affected by the indicators 4e and 4d for Dindi Mill coupe in the Toolangi forest district, Victoria. ...96
Table 7. Extent of soil disturbance (% of coupe area) assessed following timber harvesting and site preparation for Dindi Mill coupe in the Toolangi forest district, Victoria. ...97
Table 9. Effect of sampling methods and level of operating standards of bulk density (BD) and organic matter content (OM) on the total area disturbed estimated using eq. 1 (T, % of coupe area) following timber harvesting and site preparation for Dindi Mill coupe in the Toolangi
forest district, Victoria...98
Table 10. Coefficient of variation (CV, %) for determining indicators 4a, 4d and total area affected (T) using three sampling methods and levels of changes in bulk density (BD) and organic matter content (OM) for Dindi Mill coupe in the Toolangi forest district, Victoria...99
List of Figures
Part I
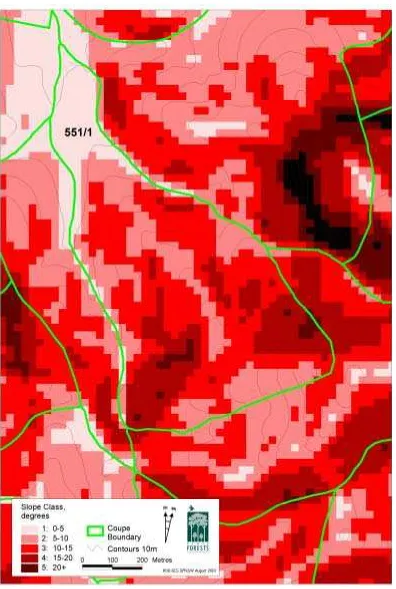
Figure 1. Location of the study area within southeastern Australia and the location of the two study sites within the study area. ...4Figure 2. Topography of compartment 551, Coupe 1. ...5
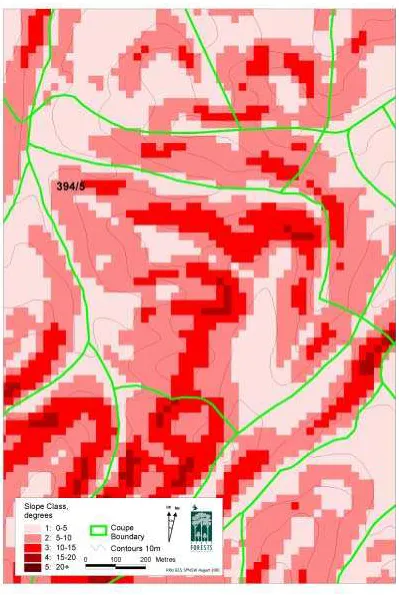
Figure 3. Topography of Compartment 394, Coupe 5. ...6
Figure 4. Coring equipment used to take A), disturbed cores, and B) undisturbed cores.. ...7
Figure 5. Pre-harvest sampling locations, compartment 551...8
Figure 6. A portion of the snig track network with counter bars and number of passes labelled...10
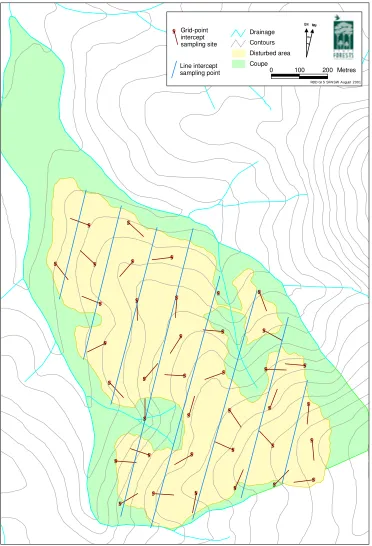
Figure 7. Line intercept and grid point intercept transect locations for post-harvest assessment in the logging study of compartment 551. The snig track network, mapped by hand-held GPS, is also shown...12
Figure 8. Map of compartment 394 showing API mapped disturbance and randomly located sample plots. ...16
Figure 9. Plan view of arc feature rectangular sample plots. ...16
Figure 10. Distribution of individual tracks identified by GPS tracking data. Numbers represent the estimated number of passes and line thickness is proportional to the number of passes (track usage classes)...20
Figure 11. Breakdown of operation categories by disturbance severity for the line intercept survey data...22
Figure 12. Aeration porosity of four post-harvest operation categories. ...24
Figure 13. Mean penetration resistance and 95% confidence interval for post-logging operational category by depth class at Compartment 551. ...25
Figure 14. Percentage of penetrations reaching a given depth for post-logging operational category by depth class at Compartment 551. ...25
Figure 15. Relationship between mean penetration resistance (0-100 mm) and mean bulk density of the operation category ground condition classes. ...26
Figure 16. Histograms and box plot of number of passes recorded by machine tracking by each snig track class. The histogram bars are in categories of 5 passes...27
Figure 17. Snig track bulk density (a) and penetration resistance (b) against number of passes recorded by machine tracking...27
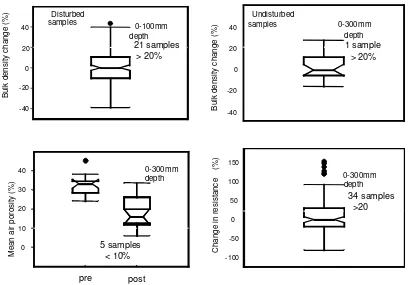
Figure 18. Box plots showing distribution of percent change in bulk density for 100 mm and 0-300 mm depths, mean air porosity, and percent change in penetration resistance...29
Figure 20. Mean of plot tree volume for the five largest trees for all disturbance categories.. ...31
Figure 21. Box plots of plot-level tree volume in 1 m increments from the plot centre for each of the track disturbance classes. All trees used...32
Figure 22. Average tree volume by disturbance class and sub-plot for the four track-type
disturbance classes in compartment 394. Five largest trees used. ...33
Figure 23. Mean of plot tree volume for the five largest trees versus mean plot penetration
resistance over 25-100 mm depth. Snig plots include track area only...34
Part II Study A
Figure 1. Location of the study area...45
Figure 2. The extent of soil profile disturbance associated with each of the operational categories.50
Figure 3. The significant models from logistic regression analysis of the relationship between soil profile disturbance and timber volume extracted, overlaid on the field data. ...52
Part II Study B
Figure 1. Location of Old Mill study area...58
Figure 2. Organic matter content (%) on various soil disturbance classes and operation categories compared to undisturbed areas in the 0-100 mm soil depth during 1989 and 1999 in the Old Mill coupe in the Victorian Central Highlands forest...64
Fig. 3. Bulk density (%) on various soil disturbance classes and operation categories compared to undisturbed areas in the 0-100 mm soil depth during 1989 and 1999 in the Old Mill coupe in the Victorian Central Highlands forest...66
Figure 4. Relationship between decrease in macroporosity and increase in bulk density caused by logging in Old Mill coupe...67
Figure 5. Macroporosity (%) on various soil disturbance classes and operation categories compared to undisturbed areas in the 0-100 mm soil depth during 1989 and 1999 in the Old Mill coupe in the Victorian Central Highlands forest. ...68
Figure 6. The mean and 95% confidence interval of 10-yrs old E. regnans sapling DBHOB for various sampling site in the Old Mill coupe. ...70
Figure 7. The mean and 95% confidence interval of 10-yrs old E. regnans sapling height at various sampling site in the Old Mill coupe. ...70
Figure 8. The mean and 95% confidence interval of 10-yrs old E. regnans sapling height to
DBHOB ratio at various sampling site in the Old Mill coupe. ...72
Figure 9. The mean and 95% confidence interval of 10-yrs old E. regnans sapling percentage of free-bole at various sampling site in the Old Mill coupe. ...72
Figure 10. The mean and 95% confidence interval of 10-yrs old E. regnans sapling stem volume at various sampling sites in the Old Mill coupe...73
Part II Study C
Figure 1. Location of the Dindi Mill coupe ...82
Figure 2. Coefficient of variation (CV, %) for estimating area affected by various operation categories using three sampling methods for Dindi Mill coupe in the Toolangi forest district, Victoria. ...87
Figure 3. Proportion of the coupe area affected by various fire categories assessed following timber harvesting and regeneration slash burning using three sampling methods for Dindi Mill coupe in the Toolangi forest district, Victoria. ...89
Figure 4. Frequency of distribution of soil bulk density before and after harvest of Dindi Mill coupe in the Toolangi forest district, Victoria. ...90
Figure 5. Area affected by various levels of changes in bulk density from pre-harvest mean in the 0-100 mm soil depth for Dindi Mill coupe in the Toolangi forest district, Victoria. ...92
Figure 6. Coefficient of variation (CV, %) for estimating area affected by changes in bulk density (BD) using three sampling methods for Dindi Mill coupe in the Toolangi forest district, Victoria. ...92
Figure 7. Frequency of distribution of organic matter content in the 0-100 mm soil depth before and after harvest of Dindi Mill coupe in the Toolangi forest district, Victoria. ...93
Figure 8. Area affected by various levels of changes in organic matter content from pre-harvest mean in the 0-100 mm soil depth for Dindi Mill coupe in the Toolangi forest district, Victoria. ...95
SUMMARY
General
This study was conducted to collect and analyse strategic data relating to soil physical property change from forest harvesting in southeastern Australia. A major aim was to obtain and analyse data that could provide links between degree of soil change and degree of individual and stand-level growth impacts. Several approaches to quantifying disturbance and soil change were implemented on common sites to evaluate alternative approaches. These baseline studies also included the innovative technique of mapping logging machine movements by GPS throughout the harvesting operation to gain a better understanding of the links between traffic intensity, disturbance, and soil property changes.
The studies were undertaken as two major groups: a set of three investigations conducted in dry sclerophyll Eucalyptus sieberi forest in NSW and a set of three studies undertaken in moist E. regnans forest in Victoria..
The overall aims of the study were as follows:
To assess the capability and suitability of the interim soil physical indicator (4.1e) to characterise the forest soil environment and the changes created by forest harvesting;
Establish relationships between changes in soil physical properties post-harvest and subsequent forest growth at long-term and retrospective research sites;
Monitor temporal changes in soil physical properties post-harvest at long-term sites;
Evaluate different methods of post-harvest indicator assessment to devise cost-effective procedures for monitoring soil physical indicators under operational forest management; and
Develop guidelines for selecting and characterising a network of reference sites suitable for long-term monitoring of soil physical and, potentially, soil carbon indicators.
NSW Studies
There were two major studies: One was a logging study in which we characterised the effects of logging on soil physical properties. In the other study, we measured tree regeneration and soil strength in relation to prior soil disturbance in a coupe that had been logged some nine years beforehand. For the purposes of this summary, we will refer to these as the logging study and the regeneration study. Both studies sites were located in Yambulla State Forest where the soils are infertile with a coarse sandy pale texture supporting dry sclerophyll forest.
For the logging study, soils were sampled for bulk density and aeration porosity on a broad grid prior to logging. During logging, forwarding machines were tracked by automatically recording GPS equipment to develop a map of traffic intensity. After logging, two alternative survey methods were used to assess the extent of soil disturbance in a series of disturbance classes corresponding to operational category (snig tracks, access tracks, etc) or disturbance severity. Soils were sampled for bulk density, aeration porosity ands soil strength following one of the sampling patterns.
In the regeneration study, vegetation plots were established in a coupe that had been logged in June 1990, had aerial photographs taken, and those photographs interpreted for soil disturbance classes. Plots were of two types: rectangular plots subtending track type disturbance features plus adjacent forest, and circular plots that were located in areas of broader, generalised disturbance. Some 104 plots across eight disturbance class were assessed for properties relating to eucalypt regrowth (height, DBHOB, total number of trees< 10 cm DBH) and properties of potentially interacting vegetation. Soil strength was also measured at each plot and a range of site characteristics, mainly terrain attributes, determined for each plot.
About 20% of the coupe was occupied by snig tracks. Heavily disturbed classes such as major snig tracks, access tracks, log landings and additional sub-soil disturbed areas accounted for between 5 to 10% of the coupe.
The survey method based on a grid with 50 m randomly oriented transects (grid point-intercept method) and method based on regularly spaced transects across the coupe gave produced comparable results with a few differences between individual disturbance classes.
Soil physical property change was relatively low. Only the most heavily disturbed classes showed evidence of significant increase in bulk density or soil strength or reduction in aeration porosity: access tracks, log landings, and major snig tracks.
The matching of trafficking intensity (number of passes) with disturbance classes and soil physical properties did not reveal any clear relationships. Major snig tracks were partly associated with high numbers of passes, but a significant proportion of these tracks also had relatively few passes. Soil physical property change was less clearly related to the number of passes, and this probably reflected the low overall level of soil physical property change. Nevertheless, the machine tracking approach shows promise and is worth pursuing for further refinement of the technology.
When soil sample data were evaluated with reference to the interim indicator 4.1e, we found that only one sample location exceeded the criterion of a more than 20% increase in bulk density in the 0-300 mm depth. When examined for 0-100 mm depth, this increased to 21, or 12%, of samples. Very few samples fell below the 10% critical value for aeration porosity that is adopted in the interim indicator. We also evaluated soil strength measurements in the context of an indicator (although there is no proposed criterion) and found a much higher proportion exceeding a 20% increase. If examined in the same manner as aeration porosity, i.e. with reference to an absolute critical value (we adopted 2.5 MPa), only 10 samples exceeded the value.
The results of the regeneration study were as follows.
The access road, landing snig tracks (i.e., snig tracks closest to landings), and major snig tracks had significantly higher soil strength to around 150 mm than the least disturbed classes.
Statistically significant differences in tree volume between disturbance classes were few as data were variable. Nevertheless, the range in means was large, and the evidence for reduced tree growth on access tracks and, to a lesser extent, landing snig tracks and major snig tracks was strong. There was a tendency for growth to be less on the track disturbance classes than the general disturbance area classes. Variability (coefficient of variation) was also greater for track classes.
There was some evidence, though not compelling, for an edge effect for track disturbance classes. (Edge effect is a documented phenomenon whereby trees adjacent tracks grow larger than those in adjacent areas that would appear to have similar levels of soil disturbance.)
For disturbance class level data, there was a clear relationship between tree volume per hectare and soil strength. At plot level the relationship was not apparent.
A significant relationship between tree growth and aspect was found, but not for any other of the many explanatory variables that we measured or extracted from digital elevation model datasets. The aspect effect was relatively evenly distributed through the various disturbance classes and was of no assistance in elucidating differences between disturbance classes.
Victorian Studies
Each of the studies in Part II is prefaced by a summary, so the reader is asked to examine these rather than repeat them here. A very brief account of the major points of each study are as follows.
Study 1: The extent of the operational categories across the logged area appeared to be independent of the site and operational factors recorded, but there was a strong relationship between the volume of timber extracted per unit area and the degree and extent of soil profile disturbance.
Study 2: Primary snig tracks and subsoil disturbed areas still had significantly higher bulk density and lower organic matter and aeration porosity than undisturbed areas. Tree volumes were lower on primary snig tracks, and, though with less compelling evidence, on secondary snig tracks and minor and moderately disturbed areas.
Study 3: Some differences were found between the three transect methods applied. However, estimates of the various disturbance class were relatively insensitive to sample size indicating that less intensive sampling may be adequate.
Recommendations
On the basis of the combined results, our recommendations for an indicator that can be cost effectively applied on an operational basis to ground-based native forest logging is as follows.
The framework for monitoring for indicator 4.1e for ground-based native forest logging should be based on simple mapping of disturbance categories with interpretation underpinned by scientifically established relationships between disturbance class, soil type, and logging conditions (soil moisture). Note that at present, there is insufficient data to define the effect of moisture status at the time of logging to incorporate it in the framework, but the potential exists if the relationship is better defined in future.
Integration of high resolution hand-held GPS equipment with hand-held computers supporting GIS functionality provides a highly cost-effective platform for efficient data acquisition. It may be necessary to perform a supplementary transect-quadrat survey with three or four transects with the purpose of identifying S2 and S3 level disturbance not connected with the track network.
Data should be reported as “the area and percent of the net logged area occupied by detrimental disturbance”. Detrimental disturbance would be defined as follows: For operations on high-fertility forest soils, all areas of unrehabilitated log landings, log truck access tracks, primary snig tracks, secondary snig tracks and additional areas of S3 disturbance. For operations on low-fertility forest soils, all areas of unrehabilitated log landings, log truck access tracks, primary snig tracks, and any additional areas of S3 level disturbance. For sites of intermediate or indeterminate fertility status the high-fertility criterion should be applied until a substantive basis to alter it is obtained.
For sustainability reporting purposes, data would be reported in aggregated format (as detrimental disturbance). However, data should be stored as collected and, wherever possible, in GIS compatible format. This will enable re-classification of detrimental disturbance as future research results and refinements of the relationships dictate. It will also permit the spatial data to be directly integrated with forest management information systems.
It is suggested that a target of 20% of the coupes in a forest management area should be randomly selected and assessed in the manner outlined. This is a preliminary recommendation, but in general, the figure should be adjusted up or down as required consistent with a reasonable imposition on forest management labour costs. (However it should not fall below 10% whilst 100% would be ideal, especially for the management utility of the survey data.)
With respect to messages for forest managers, the most important finding from these studies was that heavy soil disturbance appears to be reducing, or at least potentially reducing, regeneration vigour and, ultimately, timber volumes, in the Victorian Central Highlands. This requires further validation, but evidence would suggest that managers should take this threat seriously and begin to seek methods for reducing disturbance, such as pre-planning snig track locations.
GENERAL INTRODUCTION
Native forest harvesting, by its nature, requires heavy machinery to transport logs from stump to landing and to load trucks. Sometimes these machines are adapted earthmoving machines such as bulldozers and excavators, whilst purpose-built, rubber-tyred skidders are also employed widely for their higher work rate. In all cases, the machines are large and impose high ground pressures that cause soil disturbance and compaction. In addition, sloping terrain often results in a significant proportion of the extraction network being made up of formed tracks that involve major topsoil disturbance or displacement. Forest managers know that this heavy disturbance has the potential to degrade soil quality, chiefly relating to soil physical properties, but also to chemical fertility through topsoil displacement (Lacey, 1993).
Australian scientists have now conducted a number of studies into this aspect of harvesting with results clearly demonstrating the decline in soil quality (e.g., Jakobsen, 1983; Incerti et al., 1987; Williamson, 1990; Rab, 1994, 1996, Lacey et al., 1994). The proportion of the harvested area affected, however, is subject to variation, especially between major logging systems (Lacey, 1993). Considerable doubt also persists over the degree and extent of soil change needed to cause a change to ecosystem function or commercial productivity. Typically, a rather small proportion of a harvested unit will display evidence of large, and presumably deleterious, change. This area can range from 5 to 15% of the area. On the other hand, a significantly larger area can show evidence of moderate, but statistically significant change; change that may or may not affect productivity. This portion of the harvested area can be as much as 50 to 70% (Rab, 1996) and would clearly be of concern if it were sufficient to slow individual tree growth. However, measurements of the effects of soil physical change on the regenerating stand from Australian native forests are scarce and limited in scope (e.g., Jakobsen, 1983; King et al., 1993).
The challenge to develop indicators of “the area and percent of forested land with significant compaction or change in soil physical properties” (see preface) clearly lies with the biological effects of these changes and their spatial and temporal patterns. How much change is required to cause a measurable reduction in individual tree growth (i.e. what is significant)? What percentage area needs to be so affected to constitute a stand-level reduction (the basis of an indicator)? There is unlikely to be one answer to each of these questions because factors such as inherent soil fertility (itself a complex of properties), climate, and forest type are all likely to influence critical values. It is essential, therefore, to obtain data oriented towards answering these questions replicated across contrasting environments.
In addition to simply knowing what level of changes are “significant”, it would also be useful to gain a better understanding of the relationship between machine operation and the resultant changes in soil properties. Such relationships could provide innovative strategies to minimise impacts, document indicators of change, or both.
This study was conducted to collect and analyse strategic data relating to soil property change from forest harvesting in southeastern Australia. A major aim was to obtain and analyse data that could provide some links between degree of soil change and degree of individual and stand-level growth impacts. However, we also set out to conduct a detailed study of the soil disturbance process during logging to elucidate machine-soil relationships and provide sites with well-characterised baseline conditions for long-term monitoring. Several approaches to quantifying disturbance and soil change were implemented on common sites to provide indications of the more accurate and/or easily applied approaches amongst varying methodologies. These baseline studies also included the innovative technique of mapping logging machine movements by GPS throughout the harvesting operation. This machine tracking was done to gain a better understanding of the links between traffic intensity, disturbance, and soil property changes.
two major study sections are followed by a third short section; a general discussion and recommendations of the implications of both studies for the development of indicators for “The area and percent of forested land with significant compaction or change in soil physical properties resulting from human activities.”
The overall aims of the study were as follows:
To assess the capability and suitability of the interim soil physical indicator (4.1e) to characterise the forest soil environment and the changes created by forest harvesting;
Establish relationships between changes in soil physical properties post-harvest and subsequent forest growth at long-term and retrospective research sites;
Monitor temporal changes in soil physical properties post-harvest at long-term sites;
Evaluate different methods of post-harvest indicator assessment to devise cost-effective procedures for monitoring soil physical indicators under operational forest management; and
by
Stephen Lacey, Jagrutee Parekh
State Forests of NSW, Research and Development Division, PO Box 100, Beecroft, NSW, 2119
and
Bob McCormack
CSIRO, F orestry and F orest Products, PO Box E 4008, Kingston, ACT 2604
PART I
EFFECT OF FOREST HARVESTING
ON SOIL PHYSICAL PROPERTIES
1.0 Introduction
In New South Wales, most native forest logging falls into one of two types. The most widespread type is selective logging of trees suitable for use as sawlogs and poles. The other is called integrated harvesting, where not only sawlogs and poles are removed, but also trees that are not suited to sawlogs or poles, but which can be chipped for use in paper production. Integrated logging is concentrated in, though not totally restricted to, far southeastern NSW where pulp timber is directed to the Daishowa chip mill and woodchip export facility, which is located south of Eden. Sawlogs have been processed in Bombala since the closure of the Eden sawmill in 1998.
Of the two types of logging, the southern integrated logging operations are by far the more intensive and cause a considerably greater amount of soil disturbance within the logged area. Early environmental concerns about the effects of this higher logging intensity led to a number of studies on ecological and hydrological effects. Logging methods have changed continually over time in response to research or through the adoption of precautionary principles.
In the late 1980s, continuing need to explore the effects of integrated logging led to research on disturbance, soil physical properties and erosion (Lacey et al. 1994). This research, covering several soil types, found that logging disturbance caused changes to soil physical properties through compaction and displacement. It further showed that these changes were most pronounced and potentially detrimental to subsequent plant growth on temporary internal roads (access tracks), log landings (or log dumps) and, to a lesser extent, major snig tracks. Evidence of change was apparent on less severely disturbed snig tracks or disturbed areas, but the likelihood of negative effects in the subsequent rotation was not considered high. It was concluded that the key to whether the effects of soil physical change lowered site productivity in the long term was whether detrimental changes over a significant area were cumulative from rotation to rotation (Lacey et al. 1994). Without a better understanding of the effects of individual soil physical property values on tree growth, the impacts of disturbance could not be confidently predicted. The management recommendation from this research, which is still applicable, is that provided areas such as access tracks, log dumps and major snig tracks are re-used in successive rotations, then the chance of cumulative damage could be minimised.
With the launch of the Montreal Process for Criteria and Indicators for Sustainable Forest Management, there was a need to re-visit the question of sustainability of operations with respect to soil disturbance. Criterion 4.1e relates to the “area and percent of forest land with significant compaction or changes in soil physical properties resulting from human activities.” These simple words raise numerous scientific questions: Which soil physical properties should we examine? What is significant change? What cost-efficient measurement methods could we adopt that would allow us to measure and report such an indicator with an acceptable level of precision? Indeed, what is an acceptable level of precision?
Questions such as these had occupied the minds of forest soil scientists in the USA since more than 20 years ago. The US National Forest Management Act, 1976 required that logging "will not produce substantial and permanent impairment of the productivity of the land." (This included soil physical properties.) Faced with the same questions and uncertainties raised by the more recent sustainability concept, forest soil scientists suggested a criterion that no logging operation should cause more than a 20% increase in bulk density over more than 20% of the logged area. This was adopted and a statistically based method of quantifying the changes was proposed (Howes et al., 1983; Hazard and Geist, 1984) and the criterion was widely applied in the United States.
(MIG, 1998). The research presented within this report was conceived to evaluate this proposed indicator and, if necessary, propose alternatives.
For the NSW situation, we felt that because of the differences in logging intensity, and proportions of area affected, that the highest priority was to examine integrated logging. This aim was aided by the fact that there was pre-existing research (Lacey et al., 1994). Stemming from this earlier research, some aerial photographs existed that had been interpreted for soil disturbance classes (although the data were never published other than in an environmental impact statement). These photographs offered a chance to examine the links between disturbance, soil physical properties and tree growth in 8-year-old regeneration. We also saw a need to make detailed measurements of a new logging operation to apply the indicator, trial alternative survey methods of gathering the necessary data, and to apply new machine-tracking technology. The machine tracking, using low-maintenance GPS equipment, was designed to provide some understanding of the link between the logging operation itself and soil disturbance and physical property changes. The potential for automation with this technology also presented the possibility of an extremely efficient method of gathering data for reporting an appropriately phrased indicator.
So with this background, the project was conceived with the following specific aims:
To quantify soil disturbance and associated soil physical property change in dry sclerophyll forest on adamellite-derived soil;
To carefully characterise logging traffic, by the use of skidder-mounted GPS, and relate it to soil disturbance and change;
To apply alternative measurement techniques in characterising disturbance and apply the interim indicator to gain insights into the identification of appropriate, cost effective approaches to reporting the proposed indicator;
To quantify tree growth response to various classes of disturbance in regenerating dry sclerophyll forest on adamellite-derived soil.
2.0 Methods
2.1 General Overview
The study involved two major components, each centered on a different logging coupe. One component was a logging study in which we characterised the effects of logging on soil physical properties. We first measured pre-harvest soil properties, then recorded all harvesting machine movements during logging, and finally, at the completion of logging, re-characterised the resulting disturbance and soil property changes. The coupe examined was Coupe 1 of Compartment 551, Yambulla State Forest (Figure 1). In the other component of the study, we measured tree regeneration and soil strength in relation to prior soil disturbance in a coupe that had been logged some nine years before measurements were made. The coupe was formerly Coupe 5 of Compartment 394, Yambulla State Forest (Figure 1).
2.2 Study Sites
of steeper slopes, whilst Compartment 551 contained significant areas of slopes between 10 to 20 degrees. Figures 2 and 3 show the slope classes of the two coupes.
The soil is classified as a coarse sandy yellow podzolic using the Great Soil Group classification (Stace et al. 1968). Under the new Australian Soil Classification the soil can represent a number of soil orders, mainly Tenosols and Kandosols, but also Kurosols, Podosols, and Hydrosols (Isbell, 1996). This suggests a highly variable soil landscape, but it is mainly the B horizon which varies in depth, texture, and pedological organisation. It is notable that the soil is also quite uniform in terms of the ubiquitous dominance of the coarse sand fraction (Ryan, 1993). The soil is derived from quartz-rich Devonian adamellite, which exists as a large pluton underlying the area known as the Wallagaraugh adamellite. The soil is characterised by its high content of coarse sand and small, gravel-sized quartz grains. Slope position has a strong influence on soil genesis and depth ranges from zero at rock outcrops to several meters on footslopes, but is more commonly 50 to 100 cm deep on the hillslopes and crests.
Ryan (1993) gave a detailed account of the soil landscape model: a toposequence consisting of upslope residual or degrading zones and lower slope aggrading zones reflecting a strong transportational influence on profile development. Whilst the coarse quartz grains are found throughout the profile, clay content increases in the B-horizon. On hillslopes, the B-horizon still tends to be very sandy, and the increased clay content of the <2-mm fraction, whilst sufficient to push the classification into the “podsolic” category, is not enough to prevent the in-situ soil from being predominantly coarse sandy in nature. In the aggrading zones, the profile is considerably more clayey, especially in the B2 horizon.
The soils are low in overall fertility. They are strongly acid, relatively high in exchangeable aluminium, and low in total phosphorus and exchangeable cations (Ryan, 1993).
Vegetation, consistent with the low soil fertility, is dry sclerophyll forest with a relatively simple structure consisting of overstorey, shrub layer and ground cover. The overstorey is dominated by silvertop ash (Eucalyptus sieberi muell.). This species is present in percentages from around 50% ranging up to almost pure stands, depending mainly on landscape position. Other overstorey species include E. cypellocarpa, E. globoidea, E. obliqua and E. muelleriana. Common species of the shrub layer are Acacia terminalis, A. stricta, A. mearnsii, Daviesia latifolia, Allocasuarina littoralis, Cassinia trinerva and Leucopogan lanceolata. Ground cover species include bracken fern (Pteridium esculentum), tussock grasses (Poa meionectes, Chionochloa pallida), sedge (Ghania radula), creepers (eg. Viola hederacea), and erect forbs (Gonocarpus tetragyna). Many of the ground covers and shrubs tend to be opportunistic colonisers, present in low density until the overstorey is removed by fire or logging, after which they quickly increase in abundance. The overstorey species are also relatively fire resistant with most having thick bark to protect epicormic buds.
2.3 Soil sampling equipment
In both studies, the same types of soil sampling equipment were used, and these are described here for reference.
2.3.1 Penetration resistance
2.3.2 Disturbed bulk density
The term “disturbed” bulk density is used to signify that samples of known volume were obtained for weighing and measurement of bulk density, but that they were not kept in-tact, and were simply pushed out of the sampling ring into a plastic jar for transportation. These cores were obtained using a thin walled steel cylinder, 40 mm long and 56 mm in diameter, driven into the soil in a cast-stainless steel housing (Figure 4A). Samples were sealed and weighed on the day they were collected and again after oven drying at 104ºC to determine water content and bulk density. All samples were passed through a 2-mm sieve.
2.3.3 Undisturbed bulk density and aeration porosity
Undisturbed bulk density cores were, as the name suggests, kept in-tact following sampling so that laboratory measurements could be made on physical properties that are affected by sample disturbance: principally air-filled porosity.
These cores were taken using purpose built equipment consisting of a mild steel, three-legged tubular core guide (Figure 4B), and PVC plastic cylinders that were driven into the soil through the guide by a driving head. After placing the guide on the soil surface, a pedestal slightly large than the core diameter was formed by excavation (Figure 4C). The PVC sampling cylinder was then driven into the pedestal. The purpose of the pedestal was to remove external pressure on the cylinder and, hence, to minimise compaction of the core. The guide was removed and the sampling cylinder containing the soil core carefully lifted off the soil (Figure 4D). The core was then trimmed and contained at both ends by thin plywood, taped and placed in a plastic bag for transport. Weighing was undertaken on the day of collection.
The moisture content at 100 cm suction on sand-substrate suction tables was determined. Using a particle density of 2.51 g cm-3 (measured from samples), the air-filled porosity, or aeration porosity, of the cores was calculated.
A)
B)
C)
D)
E)
Figure 4. Coring equipment used to take A), disturbed cores, and B) undisturbed cores. Undisturbed cores were obtained by excavating a pedestal with the core guide in place (C), driving the sampling ring into the pedestal through the guide (D), clearing excess soil and then removing the intact core for trimming and packing (E).
2.4 Logging Study
2.4.1 Pre-logging measurement
Prior to the commencement of harvesting, soil samples were taken to obtain an independent sample of the soil properties of interest across the site. The main purpose of performing a pre-harvest sampling is to preserve the principal of random sampling: that all sample locations should have an equal probability of being selected. Any undisturbed samples obtained after logging are compromised to some extent by the fact that much of the area has been disturbed, and so not all locations are available for sampling. The sample may include, therefore, inherent or random bias.
The pre-harvest samples were obtained by randomly locating and orienting a grid over the coupe. The grid was sized to yield 45 grid intersects using the equation adapted from Hazard and Geist (1984):
(1)
Where G = grid spacing (m), A = coupe area (ha), and n = number of grid intersects. Due to irregularities in the coupe boundary, we were ultimately able to select 32 sample locations with the calculated grid size of 110 m.
At each grid point intersect, a bulk density sample was obtained from each of the depths 0-10 cm, 10-20 cm and 20-30 cm. The disturbed core method was used at 15 sampling locations, whilst the undisturbed core method was used at 17 locations. Sometimes sampling conditions prevented the full range of depths from being sampled. Figure 5 shows the pre-harvest sampling grid.
n A
Figure 5. Pre-harvest sampling locations, compartment 551.
2.4.2 Logging machine tracking and traffic intensity measurement
The following description of methods for logging machine tracking includes work performed for the studies reported in both Part I (NSW studies) and Part II (Victorian studies, specifically Study C) of this report1. Further details on the GPS equipment and methods are included as Appendix 1.
GPS Tracking Methods
The objective of the GPS tracking was to collect complete travel path data for the skidding machines used during logging. These data were used to explore relationships, if any, between
traffic intensity disturbance and soil physical property change. Detailed mapping of major coupe features such as logged area and transect locations was also undertaken manually by high-precision GPS as part of the tracking study.
Collection of travel path data from skidding machines was achieved using GPS receivers and recorders temporarily mounted in the machine cabs. GPS recording is now common in forestry studies (Thompson 1998, Veal 2001), although there are still caveats in respect to usefulness under tree canopies, or adjacent to tall forest edges (Gandeseca et. al., 2001).
Data Collection
Two types of GPS receiver were used in the experiments. The NSW study relied primarily on a Sokkia Spectrum GPS unit. The Victorian study used a purpose built experimental forest machinery data logger constructed at CSIRO FFP (details in Appendix 1). During the last period of the NSW trial, data were collected using a second CSIRO FFP forest machine data logger because the trained GPS technician was unable to be present to operate the Sokkia unit. With both types of GPS recorder, data were recorded at five-second intervals and data from remote base stations were used to differentially correct the position estimates (the base station was at Canberra for the NSW study and Melbourne for the Victorian study). There were several periods for which differential processing was not possible, due to equipment failure in both the field and at the base stations. For these periods, data accuracy was reduced and traffic patterns had to be analysed manually, as described below.
Importing GPS Data
The GPS data files contained fields for latitude, longitude and height for each point. A typical stream file for a single day of data collection could contain five thousand or more points. There were some “gaps” in the GPS data where the satellite signal was lost due to poor satellite position, too few satellites, or lost signal due to topography and canopy cover. To account for these gaps in the GPS data an ArcView GIS program was used to filter the data during the importing stage. The program flagged missing points and evaluated the distance travelled in each observation interval. Errors such as those induced by multi-path signal reception cause major jumps in reported position. By setting a maximum plausible travel distance for the five-second interval, observations could be processed to identify and flag occurrences of implausible jumps. These were typically followed in the next observation by a return jump to the correct position. Data were corrected after visual inspection, by deleting the erroneous point and assuming the travel path was a straight line between the point before and the point after the jump.
Map Production
Traffic intensity maps were produced in two ways. The preferred method used an automated tool set developed and installed in the ArcView GIS. The back up method relied on visual inspection of the GIS data on screen, counting and manual recording of traffic path. This was used when automated processing was not possible.
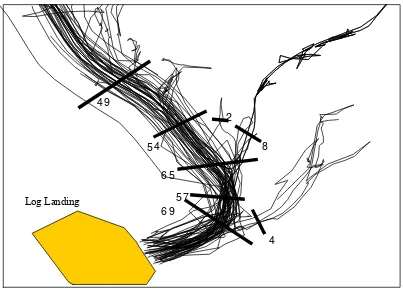
In the automated method, a composite GIS file containing all snig tracks on the site was assembled first. From this, a simplified schematic of the snig track network was drawn as an overlay layer in the GIS, identifying the track sections and junctions. Next, a line was drawn on the overlay layer approximately perpendicular to the direction of the track at each point where a traffic count was desired. These counting lines were usually placed midway between junctions. Figure 6 shows a section of track, associated data and counter bars. The automated computer routine was programmed to count the number of GPS track records that intersect each of these counting lines and report the results.
thirds of the NSW data. Manual processing was undertaken on the Victorian data and the remaining parts of the NSW data.
The statistic evaluated in this study was the number of machine passes along the snig track. At the level of accuracy achieved, it is not possible to have confidence about the accuracy of the actual number of wheel passes over a point. Analysis was, therefore, also undertaken to condense the data to broad traffic classes (eg. 1-10, 11-25, 25+ passes).
49
6 9 6 5
4 8 5 4
5 7
2
Log Landing
Figure 6. A portion of the snig track network with counter bars and number of passes labelled.
2.4.3 Post logging measurement
Disturbance classification and traffic intensity classes
Soil disturbance by the logging operation was quantified by several alternative methods. Two of these represented alternative methods of obtaining essentially the same data for comparative purposes. The line intercept method (Figure 7) used randomly located transects. Their orientation was subjectively chosen to be approximately normal to the dominant direction of snigging (see Appendix 2) and the distance between them chosen to give around ten transects (100 m; eight transects fell within the coupe). Ground condition classes were recorded at 15-m spacings commencing at a randomly selected distance between 0 and 15 m from the transect start.
The grid point-intercept method used a randomly located and oriented grid with randomly oriented 50-m transects arising from each grid intercept. The grid spacing was 100 m, providing 38 grid intersects within the coupe. Ground condition classes were recorded along the 50-m transects as in the line-intercept method, except at a 10 m spacing. The locations of both sets of transects, along with a GPS-mapped layout of the harvested area, are shown in Figure 7.
physically perform surveys across large areas of undisturbed forest. The proportion of the coupe actually surveyed was then used to adjust and the survey data to a whole-coupe basis.
The areas surveyed were slightly different for the two methods. The grid-point intercept transects were re-oriented by 180 degrees if the random bearing resulted in the transect being entirely within non-harvested forest. Hence, adjustments to transect locations could be made in response to irregularities in the harvested area so that transects were primarily located within harvested area. The main exception to this was an non-harvested area within a tongue of filter strip in the south-west corner of the coupe where a transect fell within the non-harvested area and was surveyed (see Figure 7). When the line-intercept transects passed through such irregularities, the non-harvested areas were recorded. The proportion of the coupe surveyed was estimated from GPS data and was used to scale all disturbance category assessments according to the following formula;
100
)
(
)
(
(%)
=
×
+
×
×
A
Au
Pu
As
Ps
P
(2)Where Ps = proportion of category in surveyed area, As = surveyed area (ha), Pu = proportion of category in non-surveyed area, Au = coupe area not surveyed, A = total coupe area. Surveys conducted with GPS provided close estimates of the coupe area surveyed and not surveyed. These were 28 and 27.1 ha for the grid-point intercept survey, and 37.4 and 17.7 ha for the line intercept survey, respectively. Based on field observations, the non-surveyed part of the coupe was regarded as 100% undisturbed.
In both surveys, five types of ground condition were recorded simultaneously using the classification method of Rab (1998) as shown in Table 1. Operational categories are a description of how the land was used or disturbed during logging. The disturbance categories consist of three different descriptor categories: a subjective disturbance severity classifier; type of soil mixing or removal; and dominant horizon exposed, which might also be thought of as a surrogate for depth of disturbance. In the line intercept survey, snig tracks were not placed into sub-categories.
RDD GI S SFN SW August 2001
Coupe Drainage Contours
Disturbed area
Line intercept sampling point Grid-point intercept sampling site
0 100 200 Metres
Table 1. Ground condition classification system used at compartment 551, Coupe 1, Yambulla State Forest (after Rab, 1999).
A: Operational categories:
Unharvested Area (UA) Areas of retained forest or other vegetation Harvested Area (HA) General logging area within which trees are felled
Firebreak (FB) Perimeter boundary (not present at cmpt 551, but used in Victorian operations) Snig Tracks (ST) Tracks created by towing or winching logs to the landing. Further divided into
minor, moderate and major under the grid point-intercept method. Log Landings (LL) Area where logs are snigged for sorting and loaded for transportation Access Roads (AR) Temporary roads used during the harvesting operation
B: Soil disturbance categories:
Degree of soil profiledisturbance Type of mixing/ removal Dominant Horizon Undisturbed (S0) Forest intact (FI)
Understorey intact (UI) Litter layer intact (LI)
O1 O1 O1
Lightly disturbed(S1) Litter layer disturbed (LD) Litter layer partially removed (LR)
O2 O2
Moderately disturbed (S2) Litter completely removed and topsoil exposed (TE)
Litter mixed with topsoil (LM) Topsoil disturbed (TD) 1 Topsoil mixed with subsoil (TM) Topsoil partially removed (TP)
Severely disturbed (S3) Topsoil completely removed and subsoil exposed (SE)
Topsoil mixed with subsoil (SM) Subsoil disturbed (SD) 2
Subsoil mixed with parent material (SC) Subsoil partially removed (SR) Subsoil removed and parent material exposed (PE)
C. Soil and slash piling categories:
Soil piling (SP) Soil piled at a height >0.3 m Soil and slash piling (SS) Soil and slash piled at height >0.3 m Slash and/or bark piling (SB) Slash and/or bark piling at height >0.3 m
1
Topsoil consists of A1, A2 and A3 horizons except where A2 is conspicuously bleached whereby A2 and A3 are regarded as subsoil. 2
Subsoil includes B1 and B2 horizons and conspicuously bleached A2 horizon (and any other A-horizon below the A2).
Note: Fire intensity categories presented in Rab (1998) were not used as this study excluded the effects of post-logging burning.
The GPS machine tracking data were also used as a disturbance classification (number of skidder passes or traffic intensity class). We compared the traffic intensity classes with the visual classification wherever the two types of data could be spatially related.
Soil Sampling
that these classes would have limited spatial extent. If there were likely to be any wide-scale measurable physical property deterioration at depths below 10 cm, then this would be manifest through the three snig track classes and harvested area data.
2.5 Re-grow th Study
2.5.1 Background
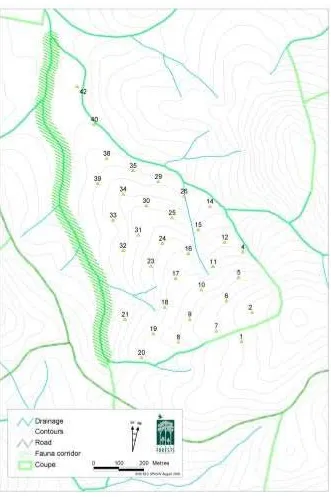
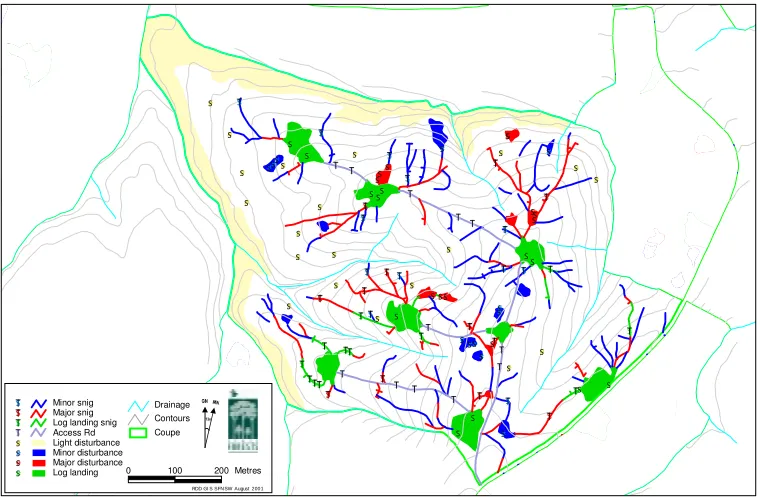
Coupe 5 of Compartment 394 was logged in June 1990. Aerial photographs were taken of the coupe, along with 37 other logged coupes, in November 1991 as part of an earlier study on soil disturbance. These photographs were interpreted by a skilled aerial photograph interpretation (API) technician who delineated several classes of disturbance (Table 2) in a process that also included ground verification of the disturbance categories. The resultant data were digitised and the areas of the different disturbance classes computed by GIS. The disturbance network, as discriminated by API, is shown in Figure 8.
Nothing more was done with the coupe following the aerial photograph interpretation and it was allowed to regenerate naturally after application of standard management practices. Such practices included draining and closing tracks and temporary roads, a post-logging fuel-reduction burn, and ripping of log dumps. These procedures were performed before the photos were taken. No artificial planting was carried out on any part of the coupe. In 1998, the compartment was included in a portion of State Forest that was transferred from State Forest to National Park under New South Wales Crown Land administrative procedures. Management therefore passed to the New South Wales National Parks and Wildlife Service. This did not lead to any differences in management over the intervening years than would have occurred had the coupe remained as State Forest.
When the current study was being developed, it was recognised that the 38 coupes could provide an opportunity to match regeneration characteristics with soil disturbance. We therefore selected a coupe by applying several criteria: the interval between logging and photography was to be as short as possible (for maximum classification accuracy), the terrain was to be not too dissected, and the apparent disturbance pattern was to be relatively uniform. Consequently, compartment 394 was finally selected. The reason for a subjective selection was to minimise sources of existing measurement error (especially through API) or natural variation, as we expected these would be at a relatively high level, even under the best conditions, due to it being a retrospective investigation.
2.5.2 Sampling strategy and plot location
The original API identified logging snig tracks and log access tracks as linear features and identified other types of disturbance such as log dumps and general disturbance as enclosed areas. In GIS terms, these were referred to as arc features or polygon features, or in other words, lines and areas. The disturbance classes for each of these types of features are shown in Table 2.
Table 2. Disturbance classification categories of compartment 394.
Arc/Line Categories Area/polygon categories Access roads Landings
Landing snig tracks Major disturbance
Major snig tracks Minor disturbance Minor snig tracks Light disturbance
We treated all nine classes as being independent – an alternative might have been to treat corresponding arc and polygon classes in common: major snig tracks and major disturbance; minor snig tracks and minor disturbance. We did not combine them because of the potential that different processes may have created the disturbance on tracks (arcs) and areas (polygons).
The primary object of our survey was to measure eucalypts that had regenerated since logging, thus we did not sample the undisturbed class because, by definition, there was no regeneration to sample in these areas. This also presented the situation that there could be no true control. However, since the treatment effect of interest was soil disturbance, the light disturbance class became our de-facto control. This class was identified during the API to have been logged, and essentially have had the tree cover removed, but to have no areas of soil disturbance large enough to be worthy of delineation.
Because of our expectations of high variability, we sought to measure as many plots and obtain as high a value of n per class as possible. To balance this objective against what could physically be achieved in the time available, we somewhat arbitrarily chose to sample twelve plots per class, except the nominal control (light disturbance) to which we allocated 20 plots. We used the ArcView 3.1 GIS program (ESRI, 1996) to randomly select the required number of plot locations in each class. The resultant plot locations are shown in Figure 8.
2.5.3 Vegetation sampling
Separate sampling approaches were developed for the two types of disturbance in recognition of their different characteristics. The area plots needed to be only simple circular plots, as the assumption stemming from the API was that the entire area within the polygon was uniform (even if in reality there was some variation). Hence, 5-m radius circular plots were selected and the five largest trees were measured within each plot. (We had decided that in case of high stem densities, only the dominant tress would be of interest.) The abundance of non-eucalypts and total number of stems of eucalypt trees in two size classes (equal to and above 10 cm DBH and below 10 cm DBH) were recorded in abundance classes as an index of competition. The distances to the three closest residual old growth trees up to a maximum distance of 30 m were also measured – the presence of residual trees may have had a positive effect on regeneration density, but a suppressive effect on growth.
A different plot type was used for the arc/track plots because of their potential for systematic variation across the track from the centre to the margins. We also assumed that there would be a zone of transition between the track-proper, and the adjacent area-proper. We referred to this as the edge zone. Other studies have shown this zone to have a potentially higher productivity, possibly because of favourable soil properties and possibly because of reduced competition for light due to fewer trees on the adjacent track (Pennington et al., 2002). We therefore chose rectangular sample plots 10 m long centered on the centerline of the track at the sample point. The plots were of irregular width because they were defined by identifying three separate zones from the centerline. The first was the centerline to the beginning of what we determined to be the track edge. We refer to this as the track plot. The second was the track edge itself, which was usually only one to 1.5 m in width, and the third was the outer plot, that was defined as 5 m beyond the outer limit of the track edge. Track edges and outer plots were recorded on both sides of the track. A schematic of this sampling pattern is shown in Figure 9.
Both types of sample points were located as accurately as possible based on ground navigation by tape and compass and using an overlay of the sample points on aerial photographs as a map. By this approach, our impression in the field was that we were able to get within 2-5 m of the actual location for track plots; 5-10 m for area plots.
Contours Drainage
Coupe
RDD GI S SFN SW August 2001
Minor snig Major snig Log landing snig Access Rd Light disturbance Minor disturbance Major disturbance
Log landing 0 100 200 Metres
Figure 8. Map of compartment 394 showing API mapped disturbance and randomly located sample plots.
Track
Edge
Outer
5 m
0 m
6 m
x m
y m
Plot peg
2.5.4 Soil penetration strength
Soil penetration resistance was measured in triplicate near the plot centre. In track plots, only the track itself was examined with the edge and outer components disregarded. The triplicate measurements were taken surrounding the plot centre at approximately equal spacing around an approximately 0.5 m radius circle.
2.5.5 Other Factors Influencing Tree Grow th
We believed that there was considerable potential for factors other than disturbance or penetration strength to influence tree size, and attempted to measure those that we could without greatly increasing the scope of the sampling or analysis exercise. During vegetation sampling, we recorded the abundance of non-eucalypt trees and shrubs as well as the total number of eucalypts in size categories above and below 10 cm DBH. Terrain attributes (aspect, soil wetness index, solar radiation, topographic position) were also compiled from data sets derived for use by the Southern CRA (NPWS, 1999) from a 25 by 25 m grid cell-sized digital elevation model.
2.6 Statistical Analysis
Statistical tests for the logging study and regeneration survey primarily involved analysis of variance to compare the means of response variables by various classes (disturbance, depth) using procedures for unequal cell size in SAS (SAS Institute, 1999). Post-hoc comparison of means was performed using Duncan’s multiple range procedure as it is a relatively conservative test (Klockars and Sax, 1986).
For the analysis of the influence of the multiple explanatory variables, we first employed exploratory techniques such as scatter plot matrices and classification and regression tree analysis using S-Plus 2000 (MathSoft, 2000). The two variables concerning the total number of eucalypts in different size classes were not examined against plot volume as these were strongly auto-correlated. They were examined against mean size of the two largest trees, as it is conceivable that tree number may have been negatively correlated with mean size. Generally, any variables independent of the response variable were examined.
Only one variable, aspect, was found to have a significant influence on plot volume. We attempted to linearize aspect with respect to the perceived effect, although this involved some subjective judgement. The linear regression between this new aspect variable and tree volume was significant, so we then used it as a covariate in analysis of variance and examined the least square means.