Impact of the 2002 Canadian Forest
Fires on Particulate Matter
Air Quality in Baltimore City
A M I R S A P K O T A ,† J . M O R E L S Y M O N S ,†
Johns Hopkins University Bloomberg School of Public Health, Johns Hopkins University Whiting School of Engineering, and Johns Hopkins Hospital, Baltimore, Maryland 21205, and University of Maryland, College Park, Maryland 20742
With increasing evidence of adverse health effects
associated with particulate matter (PM), the exposure
impact of natural sources, such as forest fires, has substantial
public health relevance. In addition to the threat to
nearby communities, pollutants released from forest fires
can travel thousands of kilometers to heavily populated urban
areas. There was a dramatic increase in forest fire
activity in the province of Quebec, Canada, during July
2002. The transport of PM released from these forest fires
was examined using a combination of a
moderate-resolution imaging spectroradiometer satellite image,
back-trajectories using a hybrid single-particle Lagrangian
integrated trajectory, and local light detection and ranging
measurements. Time- and size-resolved PM was evaluated
at three ambient and four indoor measurement sites
using a combination of direct reading instruments (laser,
time-of-flight aerosol spectrometer, nephelometer, and an
oscillating microbalance). The transport and monitoring
results consistently identified a forest fire related PM episode
in Baltimore that occurred the first weekend of July
2002 and resulted in as much as a 30-fold increase in
ambient fine PM. On the basis of tapered element oscillating
microbalance measurements, the 24 h PM
2.5concentration
reached 86
µ
g/m
3on July 7, 2002, exceeding the 24 h
national ambient air quality standard. The episode was
primarily comprised of particles less than 2.5
µ
m in
aerodynamic diameter, highlighting the preferential transport
of the fraction of PM that is of greatest health concern.
Penetration of the ambient episode indoors was efficient
(median indoor-to-outdoor ratio 0.91) such that the high
ambient levels were similarly experienced indoors. These
results are significant in demonstrating the impact of a
natural source thousands of kilometers away on ambient
levels of and potential exposures to air pollution within an
urban center. This research highlights the significance
of transboundary air pollution and the need for studies
that assess the public health impacts associated with such
sources and transport processes.
Introduction
Forest fires are a significant source of air pollution. Every year, fires consume millions of hectares of forest in North America, generating vast air pollution emissions that pose significant potential for wide-scale human exposure. Biomass emissions from large-scale forest fires include particulate matter (PM), carbon monoxide (CO), polycyclic aromatic hydrocarbons (PAHs), aldehydes, and semivolatile and volatile organic compounds (VOCs) (1). Plumes of hot gases containing airborne pollutants ascend from forest fires into the mixed layer. These plumes can then detrain from the mixed layer and be advected over long distances in the free troposphere by prevailing winds (2, 3). Transport of air pollutants in the free troposphere is more efficient than in the mixed layer because of fewer loss mechanisms and stronger winds (4). Previous research has shown that this long-range transport can affect pollutant concentrations thousands of kilometers from the source (5-10). Wotawa and Trainer (11) reported that extensive forest fires in Canada during 1995 influenced concentrations of CO and ozone (O3)
in the southeastern United States. Building on these findings, McKeen and colleagues (12) showed that transport of nitrogen oxide (NOx) led to elevated O3levels over eastern U.S. urban
centers. In addition to gaseous pollutants, several investiga-tors (13-15) have reported high concentrations of PM in different areas of Southeast Asia during the Indonesian forest fires of 1997. Though these studies have shown biomass burning to be a major source of ambient PM, to date, there are no published findings that have evaluated the impact on the indoor environment in population centers that are located thousands of kilometers away.
Historic events characterized by unusually high levels of air pollution provide evidence that increased concentrations of airborne pollutants adversely impact human health (16
-18). In considering the health impact of air pollutants such as PM, penetration of particles of outdoor origin into the indoor environment is a key consideration because the indoor environment is the dominant venue for exposures to air pollutants due to the large fraction of time spent indoors (19). Penetration is determined by a combination of particle type and size and building and ventilation characteristics (20).
The current study examines the impact of a significant source event (Canadian forest fires) on the PM levels in an urban center (Baltimore) located thousands of kilometers from the source. The PM exposure continuum is examined including the source, fate, and transport, ambient concen-trations, the size distribution of particles comprising the episode, and the indoor concentrations of PM within homes of susceptible individuals, i.e., asthmatic children. This examination illustrates the global significance of biogenic air pollution sources and the meteorological conditions that determine transport and impact on ambient and indoor environments.
Methods
The impact of the July 2002 Canadian forest fires on PM air quality in Baltimore was assessed across the exposure continuum using an array of methods. Characterization of the source term was based on data available from the
* Corresponding author address: Department of Environmental Health Sciences, Johns Hopkins Bloomberg School of Public Health, 615 N. Wolfe St. (Room E6614), Baltimore, MD 21205; phone: (410)-614-5750; fax: (410)955-9334; e-mail: [email protected].
†Johns Hopkins University Bloomberg School of Public Health. ‡Johns Hopkins University Whiting School of Engineering. §University of Maryland.
|Johns Hopkins Hospital.
Environ. Sci. Technol.2005,39,24-32
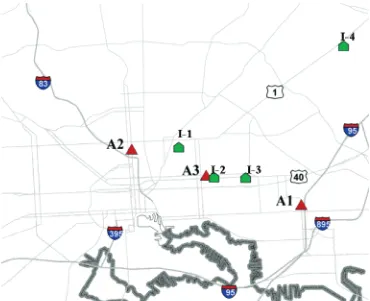
Canadian Ministry of Forestry including reports tracking the number of hectares of forest burned per month. The transport of the smoke plume from the forest fires to Baltimore was illustrated using satellite imagery and hybrid single-particle Lagrangian integrated trajectory (HYSPLIT) modeling. The existence of the smoke plume above Baltimore before the peak of the episode and its reentrainment into the mixed layer during the episode was determined using light detection and ranging (LIDAR). The effect of this long-range transport on the ambient PM air quality in Baltimore was determined using monitors at three locations within the city. Finally, the overall impact of the episode on the indoor environment was assessed by measurement of PM within children’s bedrooms.
The fate and transport of the forest fire plume from Quebec to Baltimore was assessed using back-trajectory calculations from HYSPLIT. This model employs archived Eta data assimilation system (EDAS) weather model outputs to trace the origins of an air parcel at a specific latitude, longitude, and height over the continental United States. This model is well suited and validated for assessing long-range air pollution transport (21-24). Sets of back-trajectories with end points over Baltimore (39.29° N, 76.55° W) were computed every 6 h with end heights of 100, 500, and 1000 m above ground level (AGL). Each trajectory was computed in 1 h increments for a 72 h period. These data were then imported into the software package MATLAB (The Math-Works, Inc., Natick, MA) and plotted over the U.S. carto-graphic boundary files from the 2000 census. The plume’s fate and transport were further assessed qualitatively through publicly available satellite images acquired with a moderate-resolution imaging spectroradiometer (MODIS).
The time-resolved vertical aerosol profile was measured at site A1 (Figure 1) using the Johns Hopkins University miniature elastic backscatter LIDAR (JHU-MEBL) as de-scribed by Pahlow et al. (3). The LIDAR instrument was operated in vertical upward pointing mode on a daily basis during the EPA Baltimore Supersite summer intensive sampling period (see www.jhu.edu/∼ dogee/mbp/super-site2001/for details on the measurements and data visual-ization). A laser emits light pulses at a wavelength of 1.06µm
parallel to the axis of a 26 cm, f/10, Cassegrain telescope. In the lower troposphere, laser light is scattered mainly by aerosols, whose size is on the order of the wavelength of the laser light. During an ideal backscatter event, the laser light is reflected 180°downward and is collected by the telescope. Reflected light passes through an interference filter and a lens that focuses the energy on a 3 mm diameter, IR-enhanced silicon avalanche photodiode. Both the travel time of the light emitted from the laser to its collection and the intensity of the backscatter radiation are digitized. In this way a vertical profile of relative aerosol backscatter is obtained at a vertical resolution of 3.6 m, a range of 6 km, and a time step of 5 s. The strong vertical mixing in the daytime mixed layer (ML) and the weak mixing above the temperature inversion on top of the ML lead to an accumulation of aerosol, heat, and moisture within the ML and a strong drop in these quantities in the free troposphere. Due to this vertical gradient in aerosol backscatter across the ML top, the ML height can be determined with LIDAR.
Time- and size-resolved outdoor PM was measured at two different locations (see Figure 1) using two different methods. In central Baltimore (site A2), 5 min measurements were made with a laser particle counter (Climet CI-500, Climet
Instrument Co., Redlands, CA). The CI-500 was connected to an isokinetic port of a stainless steel sampling manifold. The manifold and Climet were located on the second floor of a three-story row home. The CI-500 registers counts based on light scattered by particles passing through a laser beam. The amount of light scatter is directly proportional to the size of the particle, which is then converted to an electrical pulse by a photodetector. The amplitude of the pulse is compared to a reference voltage, and the particle generating the pulse is assigned to preset size bins of 0.3-0.5, 0.5-1.0, 1.0-2.5, 2.5-5, and 5-10µm, respectively. The instrument
was operated at 2.8 L/min and was factory calibrated within one year of use. The second monitoring site was the Baltimore Supersite (site A1) located approximately 4 mi to the east of the first location on the southeastern edge of the city. Measurements at this location were made using both an aerodynamic particle sizer (APS; TSI, Inc., Shoreview, MN) and tapered element oscillating microbalance (TEOM; Rup-precht & Patashnick Co., Inc., Albany, NY). The APS was programmed to provide integrated particle counts every 5 min over 52 size bins between 0.452 and 20µm. The TEOM
was equipped with a 2.5µm sampling inlet and was operated
at 30°C, providing mass concentration results in 30 min intervals.
PM concentrations were measured in the bedrooms of four children participating in a study of childhood asthma in the urban environment and on the rooftop of a three-story row home (site A3) centrally located in the neighborhood where the children lived. Within each home, PM was measured over 72 h using a portable direct reading nephelometer (MIE pDR1000s, ThermoElectron, Franklin, MA). The four study participants were 6-12 years of age and lived in East Baltimore. Three of the four children were asthmatic. Indoor source activity (e.g., smoking, cooking, and vacuuming) and ventilation (windows, air conditioning) during the monitoring period were obtained from a daily questionnaire completed by an adult respondent within each home. Details of this study and baseline exposure levels of the entire cohort are described elsewhere (25).
The nephelometer uses a pulsed emitting diode producing near-infrared light at 880 nm that is scattered by particles entering the sensing cell. The intensity of light scattered by the passing particles is proportional to the particle concen-tration. The nephelometer’s inlet is designed to passively sample particles ofe10µm. The manufacturer specifies a
measurement range from 0.1 to 10µm; however, it has been
shown that particles in the range of 0.3-2µm are
prefer-entially detected (26,27). The nephelometers were factory
calibrated using SAE Fine (ISO Fine) test dust characterized as having a mass median diameter of 2-3µm, a bulk density
of 2.6-2.65 g/cm3, and a refractive index of 1.54 (Powder
Technology, Inc., Schofield, WI). Before being deployed to the field, the nephelometers were zeroed against clean air obtained using a HEPA filter according to the manufacturer’s operation manual.
Meteorological variables were measured at site A1 using a variety of instruments with sensors positioned on an 11 m tower. In particular, incoming solar radiation was measured with an Eppley Pyranometer at 11 m, the temperature and relative humidity were logged from a Vaisala HMP45AC probe at 4.9 m, rain was collected by a Campbell Scientific TE525MM tipping bucket rain gauge, and the wind speed and turbulence were measured by a Campbell Scientific three-component anemometer-thermometer CSAT3 at 9 m.
Results
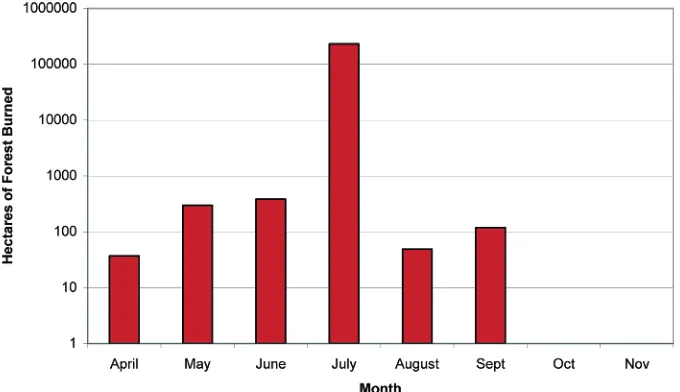
The impact of the Canadian forest fires on Baltimore PM concentrations was assessed by examining the source activity, fate and transport of the plume, resulting ambient PM concentrations, and, ultimately, its infiltration into the homes and bedrooms of asthmatic children. The source activity was evaluated on the basis of the Canadian Forest Service estimate of hectares of forest combusted in the Canadian province of Quebec during the period of interest. For the forest fire season of 2002, there was more than a 100-fold increase in hectares of forest burned during the month of July compared to other months (Figure 2). Specifically, during the first week of July, there were 85 active wildfires reported in the province of Quebec (28).
The transport of the plume across the eastern seaboard was evaluated both qualitatively and quantitatively. A qualitative evaluation was provided by a satellite image (MODIS) taken on July 7 at 1035 EDT showing a coherent smoke plume extending from the forest fires in Quebec to the U.S. northeastern seaboard (Figure 3A).
A quantitative assessment of the plume transport was provided using HYSPLIT. Multiple trajectories were run representing a range of heights (100, 500, and 1000 m) and times (every 6 h); however, the results were consistent in showing air parcels contributing to the pollution episode originated in the Quebec region, whereas those before and after the episode originated elsewhere. For clarity of illustra-tion, a single plot per day, capturing the conditions before, during, and after the episode, is given in Figure 3B. The trajectories shown are for 1300 EDT and represent a height
of 500 m AGL. The selection of the 500 m height is justified because the model is less accurate at lower altitudes due to incomplete resolution of near-surface frictional and turbulent effects. In addition, air pollution transport is better repre-sented at heights above the inversion layer, especially during the summer when strong nocturnal inversions occur (29). The selection of 1300 EDT as an end time for the trajectories is justified because atmospheric mixing is well established. Back-trajectories are shown for the 5 days including and surrounding the PM episode. The back-trajectories clearly show that the air mass arriving in Baltimore on July 6-8 originated from the area of Quebec where the forest fires were burning. In contrast, on July 5 and 9, the arriving air mass originated from western Canada and the U.S. Midwest, respectively.
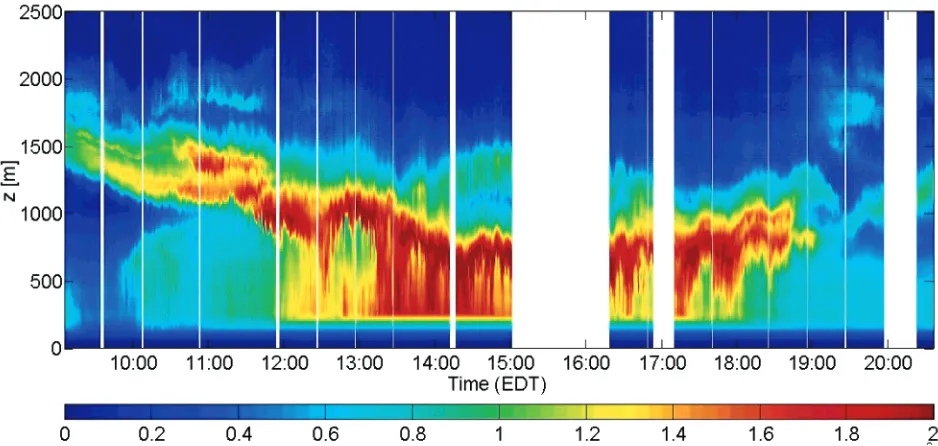
The local plume was observed aloft using LIDAR mea-surements. LIDAR provides the relative aerosol concentration as a function of time and heightzabove ground level (Figure 4). Shortly after 0900 EDT on July 7, the forest fire smoke plume was situated at a height between 1400 and 1800 m. The LIDAR verifies that the smoke cloud shown by MODIS images (recorded at 1035 EDT) existed at heights between 1100 and 1800 m above ground level before entrainment into the mixed layer. The daytime turbulent mixed layer can be identified due to the homogeneous vertical mixing within it. The mixed layer height increased from 600 m at 1000 EDT to approximately 1000 m at 1100 EDT that day. Until that time, the aerosol concentration in the mixed layer was lower than in the smoke layer aloft. Shortly after 1100 EDT, the mixed layer reached the height of the smoke plume. Large
FIGURE 3. (A) MODIS satellite image taken on July 7, 2002, 1035 EDT. The red circles mark areas of high forest fire activity. MODIS satellite image courtesy of the Land Rapid Response Team, NASA/GSFC, Greenbelt, MD. (B) Back-trajectories of air parcels ending at Baltimore, MD, from the HYSPLIT model. The trajectory end times are shown in the legend, and the end height is 500 m AGL. Each segment of the trajectory lines indicates a 12 h interval.
eddies infringed the lower interface of the smoke plume and started to mix the smoke-laden air with surface air beginning at 1130 EDT. This process increased in intensity during the afternoon. Thus, heavily polluted forest fire smoke entered the mixed layer from aloft, resulting in elevated PM levels at ground level. After 1800 EDT the mixing became less intense. The ML height slowly diminished to around 650 m and the forest fire plume moved upward to>1000 m at 2030 EDT. Pahlow et al. (3) and Adam et al. (30) provide further details on the mixed layer dynamics during this event.
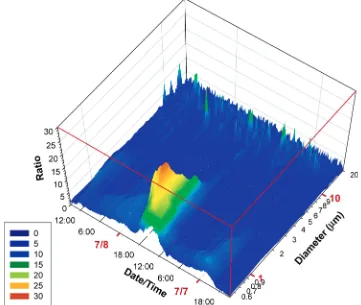
The entrainment of the smoke plume into the mixed layer evident from the LIDAR measurements coincided with a dramatic increase in ground-level PM concentrations at both ambient monitoring sites (sites A1 and A2), clearly defining the forest fire pollution episode. Figure 5 shows the increase in PM concentration (at site A1) across various particle size ranges during the episode compared to the background. The background was estimated by the 4 week average (2 weeks before and after the episode) PM concentration matched by day and time. Consistent with LIDAR observations previously described, the peak of the forest fire episode in Baltimore was observed on July 7 between 1100 and 1800 EDT. Much of the increase in PM concentration was attributable to particles less than 2.5µm in size. During the peak of the
episode, there was as much as a 30-fold increase in PM concentration in the 0.8-0.9µm size range.
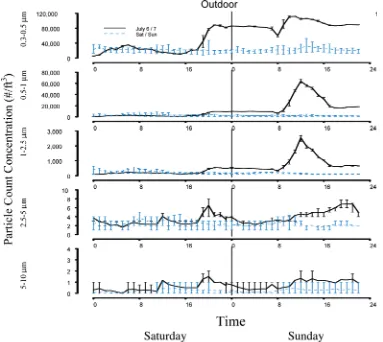
A similar episode-related particle concentration profile was observed at site A2 on the basis of laser particle count measurements. Figure 6 presents the outdoor particle count concentration profiles for July 6 and 7 relative to the average concentrations for all other weekends in June and July 2002. This figure shows a marked increase in the concentration of smaller particles during the peak of the episode with little or no change in PM concentration for particles ofg2.5µm,
similar to that observed at site A1 measured with the APS.
The beginning of the forest fire episode is clearly identified by the elevated levels of PM concentration over the back-ground starting at 1600 EDT on July 6, reaching maximum levels on July 7 between 1100 and 1800 EDT.
An episode-related increase in ambient PM (site A3) was observed within the bedrooms of children (n)4, sites I-1
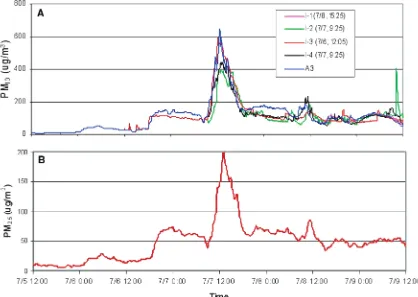
-I-4) participating in a study of asthma and air quality (Figure 7A). Consistent with the ambient measurements, the peak in PM concentrations inside the homes occurred between 1100 and 1800 EDT on July 7, 2002. The indoor measurements show a high level of correspondence to the associated outdoor central site, A3, where PM was measured using the same method. The median indoor-to-outdoor ratio during the episode was 0.91 (quartiles of 0.74 and 1.05), indicating efficient particle penetration. The daily questionnaire re-vealed some smoking activity in two homes during the measurement period (I-1 and I-4) and incense burning in a third home (I-3). Further, all homes reported at least two windows open on July 7. No health data were collected during the period of monitoring. The PM2.5concentration profile at
site A1 measured with a TEOM (Figure 7B) agrees closely with the bedroom and rooftop measurements, but differs in absolute value. The maximum PM concentrations measured at sites A1 (PM2.5TEOM), A3 (PM10MIE), and I-1-I-4 (PM10
MIE) were 199, 645, and 590µg/m3, respectively. On the basis
of the TEOM measurements, the 24 h integrated PM2.5
concentration on July 7 was 86µg/m3, exceeding the 24 h
average national ambient air quality standard (NAAQS; 65
µg/m3). The 24 h PM2.5concentration remained elevated on
July 8 and 9 (56 and 44µg/m3, respectively), before decreasing
to 25µg/m3on July 10.
Meteorology during the episode was characterized by a long period without precipitation (June 28-July 9) and strong northerly winds. Local wind directions oscillated around a northern flow before the episode with average wind speeds
of 4 m/s noted for July 5 and 6. A short period of weak winds (approximately 1 m/s during the night of July 6) coincided with the buildup of PM. Then, wind speeds recovered to previous levels (approximately 3-4 m/s) during the daytime hours of July 7, the day with the strongest impact from the forest fire smoke plume. A strong decrease in solar radiation (a decline of 35% compared to measures from July 5) could be attributed to the local arrival of the smoke cloud from the fires. Temperatures during the episode were lower than the 30 day average. The relative humidity in Baltimore was low during the period from July 5 to July 7, ranging from 30% to 60%. The arrival of a cold front on July 9 brought rains that totaled 2.5 mm from 1900 to 0200 EDT on July 10 when PM2.5
levels decreased to 25µg/m3.
Discussion
Using a combination of satellite images, back-trajectory models, and LIDAR data, we have linked a PM episode observed in Baltimore to forest fires burning in Quebec, Canada. Although the episode was of limited duration, it dramatically increased local PM concentrations. On the basis of TEOM measurements, the 24 h PM2.5 concentration
reached 86µg/m3during the episode, exceeding the 24 h
NAAQS. The peak of the episode occurred at 1300 EDT on July 7, 2002, when ambient PM2.5 reached a maximum
concentration of 199µg/m3, representing an 8-fold increase
over background levels. The high concentrations of PM observed in this study are consistent with elevated levels of gaseous mercury and carbon monoxide (CO) produced by the same fires (31) and CO and ozone produced by earlier fires (11). In addition to the Canadian fires, PM generated
by forest fires in Central America have been reported to reach the southeastern United States (32). Other researchers have described PM episodes in Southeast Asia resulting from Indonesian forest fires that occurred in 1997. During the peak of these events, a PM10concentration in excess of 400
µg/m3 was observed in Kuala Lumpur, Malaysia (14),
Singapore (13), and Darussalam, Brunei (15). The 1997 Indonesian forest fire destroyed as much as 5.2 million ha of forest (33), whereas the total amount of forest destroyed in Quebec during the 2002 fire season was approximately 1 million ha (34) (http://www.nrcan-rncan.gc.ca/cfs-scf/ science/prodserv/firereport/archives/canada_report_2002. pdf). The 2002 Quebec forest fires were the worst in the region during the past ten years and exceeded the mean area burned for the previous nine years (267212 ha) by nearly 4-fold.
Our results illustrate the local effects on ambient and indoor levels of PM due to long-range transport of PM from Canadian forest fires to the densely populated eastern United States. Much of the increase in PM concentration during this episode was primarily observed in the fine fraction (particles of less than 2.5µm). This is consistent with the results of
Gillies et al. (35), who reported transport of particles less than 5µm in size arriving from a source 500 km away. It has
been established that larger particles (those of greater than 10µm) tend to settle closer to their source due to gravitational
settling while ultrafine particles (those of less than 100 nm) tend to coagulate, leading to loss of particles in that size fraction (36, 37). The fine fraction PM is preferentially transported over long distances because these particles are too small to settle by gravity and too large to coagulate (38). Such transport has particular public health relevance because
it is this same fraction that more readily penetrates indoors, where people spend most of their time. Furthermore, particles in the fine fraction are capable of penetrating deeper into the lungs and have been associated with increased mortality and morbidity (38-41).
Concurrent MIE measurements made at the rooftop (site A3) and in children’s bedrooms (sites I-1-I-4) showed comparable concentrations. The median indoor/outdoor ratio of 0.91 measured across all four homes is comparable to the results of Abt et al. (42), who reported penetration efficiencies as high as 0.94 for particles of less than 0.5µm
and 0.53 for particles 0.7-10µm in size, while others (43,44)
have reported a PM10penetration factor close to unity. In
addition to the fine particle size, opening of windows during the episode also potentially enhanced the particle penetration indoors. This observation agrees with the findings by Riely et al. (20), noting that particle penetration indoor is dictated by factors such as particle size, building types, and ventilation characteristics.
Although the outdoor PM2.5 concentrations measured
using the TEOM at site A1 closely tracked the PM10
measure-ments made using MIE inside the bedrooms (I-1-I-4) and on the rooftop (site A3), the absolute values differed. On the basis of the TEOM measurements at site A1 and the MIE measurements at site A3 (both outdoors), we observed a median TEOM to MIE ratio of 0.62. This compares with the results of Wallace et al., who reported a ratio of 0.66 (45). Using the observed ratio, it is estimated that the maximum PM2.5concentration inside the homes of children reached
366µg/m3during the peak of the episode.
The public health significance of the episode is further established by documenting its occurrence within the bedrooms of inner-city children with asthma. The near 1:1 indoor to outdoor concentration ratio during the episode indicates a lack of protection within the indoor environment. Thus, health advisories recommending that susceptible
individuals stay indoors would have been relatively ineffective in reducing exposure. These findings point to a need for a more comprehensive health advisory to alleviate exposures during pollution episodes resulting from long-range trans-port. In addition to staying indoors, factors such as closing windows, running air conditioners in recirculation mode, using air purifiers, and encouraging the use of adequately ventilated community centers need to be appropriately evaluated for the potential to reduce exposures during such episodes.
The phenomenon of long-range transport of pollutants is of significant concern both for regulatory compliance and for public health. Using a suite of time-resolved PM measurements made throughout Baltimore, we show uniform evidence of increased air pollution resulting from the long-range transport of smoke plumes released from Canadian forest fires. The significance of such long-range transport has recently been highlighted by Holloway et al. (4), who recommended a hemispheric-scale treaty to manage the intercontinental transport of pollution. Although the source event discussed in this paper is natural, emissions from man-made sources are likely to get transported in a similar manner. Furthermore, the current study highlights the need and provides the exposure assessment underpinnings for the epidemiological study of short-term high-exposure events.
Acknowledgments
This investigation relied on data and funding support from three separate air pollution studies including the Baltimore Supersite (EPA Grant R82806301), the Baltimore Traffic Study (EPA Grant R827436010), and the Center for Childhood Asthma in the Urban Environment (EPA Grant R826724 and NIEHS Grant PO1ES09606). Additional funding and support were provided by the Johns Hopkins Center for Urban Environmental Health (NIEHS Grant P30 ES 03819). We acknowledge Drs. Alison Geyh and David Harrison for their
role in managing sites A2 and A1, respectively, and Ms. D’Ann Williams for her expert assistance in preparing the Baltimore site map.
Literature Cited
(1) World Health Organization. InHealth Guidelines for Vegetation Fire Events; Schwela D. H., Goldammer J. G., Morawska L. H., Simpson O., Eds.; Institute of Environmental Epidemiology, Ministry of Environment: Singapore, 1999.
(2) Crutzen, P. J.; Andreae, M. O. Biomass burning in the tropics: impact on atmospheric chemistry and biogeochemical cycles. Science1990,2501669-1678.
(3) Pahlow, M.; Kleissl J.; Parlange, M. B.; Ondov, J. M.; Harrison D. Atmospheric boundary layer dynamics as observed during a haze event due to forest fire smoke.Boundary-Layer Meteorol. (in press).
(4) Holloway, T.; Fiore, A.; Hastings, M. G. Intercontinental transport of air pollution: will emerging science lead to a new hemispheric treaty?Environ. Sci. Technol.2003,374535-4542.
(5) Spichtinger N.; Wenig M.; James P.; Wagner T.; Platt U.; Stohl A Satellite detection of a continental-scale plume of nitrogen oxides from boreal forest fires.Geophys. Res. Lett.2001,28(24), 4579-4582.
(6) Forster, C.; Wandinger, U.; Wotawa, G.; James P.; Mattis I.; Althausen D.; Simmonds P.; O’Doherty S.; Jennings I. M.; Kleefeld C.; Schneider J.; Trickl, T.; Kreipl S.; Jager H.; Stohl A. Transport of boreal forest fire emissions from Canada to Europe.J. Geophys. Res.2001,106(D19), 22887-22906.
(7) Kato S.; Pochanart P.; Hirokawa J.; Kajii Y.; Akimoto H.; Ozaki Y.; Obi K.; Katsuno T.; Streets D. G.; Minko N. P. The influence of Siberian forest fires on carbon monoxide concentrations at Happo, Japan.Atmos. Environ.2002,36385-390.
(8) Stohl A.; Trickl, T. A textbook example of long-range transport: Simultaneous observation of ozone maxima of stratospehric and North American origin in the free troposphere over Europe. J. Geophys. Res.1999,104(D23), 30445-30462.
(9) Tanimoto, H.; Kajii Y.; Hirokawa, J.; Akimoto, H.; Minko, N. P. The atmospheric impact of boreal forest fires in far eastern Siberia on the seasonal variation of carbon monoxide: Ob-servations at Rishiri, a northern remote island in Japan.Geophys. Res. Lett.2000,274073-4076.
(10) Peppler, R. A.; Bahrmann, C. P.; Barnard, J. C.; Campbell, J. R.; Cheng, M.; Ferrare, R. A.; Halthore, R. N.; Heilman, L. A.; Halvka, D. L.; Laulainen, N. S.; Lin, C.-L.; Ogren, J. A.; Poellot, M. R.; Remer, L. A.; Sassen, K.; Spinhirne, J. D.; Splitt, M. E.; Turner, D. D. ARM Southern Great Plains site observations of the smoke pall associated with the 1998 Central American Fires.Bull. Am. Meteorol. Soc.2000,812563-2591.
(11) Wotawa, G.; Trainer, M. The influence of Canadian forest fires on pollutant concentrations in the United States.Science2000,
288(5464), 324-328.
(12) McKeen S. A.; Wotawa, G.; Parrish D. D.; Holloway J. S.; Buhr M. P.; Hubler G.; Fehsenfeld F. C.; Meagher J. F. Ozone production from Canadian wildfires during June and July of 1995.J. Geophys. Res.2002,107(D14).
(13) Koe L. C. C.; Arellano A. F.; McGregor J. L. Investigating the haze transport from 1997 biomass burning in Southeast Asia: its impact upon Singapore.Atmos. Environ.2001,352723-2734. (14) Sastry, N. Forest fires, air pollution, and mortality in southeast
Asia.Demography2002,39(1), 1-23.
(15) Radojevic, M.; Hassan, H. Air quality in Brunei Darussalam during the 1998 haze episode.Atmos. Environ.1999,333651
-3658.
(16) Bell, M. L.; Davis, D. L. Reassessment of the lethal London fog of 1952: novel indicators of acute and chronic consequences of acute exposure to air pollution.Environ. Health Perspect.
2001,109(Suppl. 3), 389-394.
(17) Helfand, W. H.; Lazarus, J.; Theerman, P. Donora, Pennsylva-nia: an environmental disaster of the 20th century.Am. J. Public Health2001,91(4), 553.
(18) Nemery, B.; Hoet, P. H.; Nemmar, A. The Meuse Valley fog of 1930: an air pollution disaster.Lancet2001,357(9257), 704
-708.
(19) Klepeis, N. E.; Nelson, W. C.; Ott, W. R.; Robinson, J. P.; Tsang, A. M.; Switzer, P.; Behar, J. V.; Hern, S. C.; Engelmann, W. H. The National Human Activity Pattern Survey (NHAPS): a resource for assessing exposure to environmental pollutants.J. Exposure Anal. Environ. Epidemiol.2001,11(3), 231-252. (20) Riley, W. J.; McKone, T. E.; Lai, A. C.; Nazaroff, W. W. Indoor
particulate matter of outdoor origin: importance of
size-dependent removal mechanisms.Environ. Sci. Technol.2002, 36(2), 200-207.
(21) Draxler, R. R. The Accuracy of Trajectories during ANATEX Calculated Using Dynamic Model Analyses Versus Rawinsonde Observations.J. Appl. Meteorol.1991,30(10), 1446-1464. (22) Draxler, R. R. Evaluation of an ensemble dispersion calculation.
J. Appl. Meteorol.2003,42, 308-317.
(23) Draxler, R. R.; Rolph, G. D. HYSPLIT (HYbrid Single-Particle Lagrangian Integrated Trajectory) Model access via NOAA ARL READY Website. http://www.arl.noaa.gov/ready/hysplit4.html, NOAA Air Resources Laboratory, Silver Spring, MD, 2003. (24) Rolph, G. D. Real-time Environmental Applications and Display
sYstem (READY) Website. http://www.arl.noaa.gov/ready/ hysplit4.html, NOAA Air Resources Laboratory, Silver Spring, MD, 2003.
(25) Eggleston, P. A.; Buckley, T. J.; Brysse P. N.; Wilis-Karp, M.; Kleeberger, S. R.; Jaakkola, J. J. K. The environment and asthma in U.S. inner cities.Environ. Health Perspect.1999,107(3), 439
-450.
(26) Howare-Reed C.; Rea, A. W.; Zufall, M. J.; Burke, J. M.; Williams, R. W.; Suggs, J. C.; Sheldon, L. S.; Walsh, D.; Kwok, R. Use of a continuous nephelometer to measure personal exposure to particles during the US Environmental Protection Agency Baltimore and Fresno Panel studies.J. Air Waste Manage. Assoc.
2003,50(7), 1125-1132.
(27) Liu, L. J.; Slaughter, J. C.; Larson, T. V. Comparison of light scattering devices and impactors for particulate measurements in indoor, outdoor, and personal environments.Environ. Sci. Technol.2002,36(13), 2977-2986.
(28) Natural Resources Canada. http://www.fire.uni-freiburg.de/ current/archive/ca/2002/07/ca_07082002.htm, http://www. nrcan-rncan.gc.ca/cfs-scf/science/prodserv/firereport/archives/ firearchives_e.html, 2003 (accessed Aug 12, 2003).
(29) Chen, L. W.; Chow, J. C.; Doddridge, B. G.; Dickerson, R. R.; Ryan, W. F.; Mueller, P. K. Analysis of a summertime PM2.5 and haze episode in the mid-Atlantic region.J. Air Waste Manage. Assoc.2003,53(8), 946-956.
(30) Adam, M.; Pahlow, M.; Kovalev, V. A.; Ondov, J. M.; Parlange, M. B.; Nair, N. Aerosol optical characterization by nephelometer and lidar: the Baltimore Supersite experiment during the Canadian forest fire smoke intrusion.J. Geophys. Res.(in press). (31) Sigler, J. M.; Lee, X.; Munger, W. Emission and long-range transport of gaseous mercury from a large-scale Canadian boreal forest fire.Environ. Sci. Technol.2003,37, 4343-4347. (32) Tanner R. L.; Parkhurst W. J.; Valente M. L.; Humes K. L.; Jones
K.; Gilbert J. Impact of the 1998 Central American fires on PM2.5 mass and composition in the southestern United States.Atmos. Environ.2001,35, 6539-6547.
(33) Siegert, F.; Ruecker, G.; Hinrichs, A.; Hoffmann, A. A. Increased damage from fires in logged forests during droughts caused by El Nino.Nature2001,414(6862), 437-440.
(34) Johnston T, C. I. F. F. C. Canada Report for 2002 Season. http:// www.nrcan-rncan.gc.ca/cfs-scf/science/prodserv/firereport/ archives/canada_report_2002.pdf, 2003.
(35) Gillies, J. A.; Nickling W. G.; Mctainsh G. H. Dust concentration s and particle-size characteristics of an intense dust haze event: inland delta region, Mali, West Africa.Atmos. Environ.1996,30 (7), 1081-1090.
(36) Hinds, W. C. Aerosol Technology: Properties, Behavior, and Measurement of Airborne Particles; John Wiley & Sons: New York, 1982.
(37) Zhu, Y.; Hinds, W. C.; Kim, S.; Sioutas, C. Concentration and size distribution of ultrafine particles near a major highway.J. Air Waste Manage. Assoc.2002,52(9), 1032-1042.
(38) Wilson R.; Spengler, J.Particles in Our Air: Concentrations and Health Effects; Harvard University Press: Cambridge, MA, 1996. (39) Pope, A.; Burnett, R. T.; Thun, M. J.; Calle, E. E.; Krewski, D.; Ito, K.; Thurston, G. D. Lung Cancer, Cardiopulmonary Mortality and Long-term Exposure to Fine Particulate Air Pollution.JAMA, J. Am. Med. Assoc.2002,287(9), 1132-1141.
(40) Metzger, K. B.; Tolbert, P. E.; Klein, M.; Peel, J. L.; Flanders, W. D.; Todd, K.; Mulholland, J. A.; Ryan, P. B.; Frumkin, H. Ambient air pollution and cardiovascular emergency department visits. Epidemiology2004,15(1), 46-56.
(41) Morris, R. D. Airborne particulates and hospital admissions for cardiovascular disease: a quantitative review of the evidence. Environ. Health Perspect.2001,109(Suppl. 4), 495-500.
(42) Abt E.; Suh, H. H.; Catalano P.; Koutrakis, P. Relative Contribution of Outdoor and Indoor Particle Sources to Indoor Concentra-tions.Environ. Sci. Technol.2000,34(17), 3579-3587. (43) Ozkaynak, H.; Xue, J.; Spengler, J.; Wallace, L.; Pellizzari, E.;
results from the Particle TEAM study in Riverside, California. J. Exposure Anal. Environ. Epidemiol.1996,6(1), 57-78. (44) Thatcher T. L.; Layton D. W. Deposition, resuspension and
penetration of particles within a residence.Atmos. Environ.1995, 291487-1497.
(45) Wallace, L. A.; Mitchell, H.; O’Connor, G. T.; Neas, L.; Lippmann, M.; Kattan, M.; Koenig, J.; Stout, J. W.; Vaughn, B. J.; Wallace, D.; Walter, M.; Adams, K.; Liu, L. J. Particle concentrations in
inner-city homes of children with asthma: the effect of smoking, cooking, and outdoor pollution.Environ. Health Perspect.2003, 111(9), 1265-1272.
Received for review November 25, 2003. Revised manuscript received September 16, 2004. Accepted September 27, 2004.