Published: July 20, 2011
pubs.acs.org/est
Characterization of Residential Wood Combustion Particles Using the
Two-Wavelength Aethalometer
Yungang Wang,
†Philip K. Hopke,*
,†Oliver V. Rattigan,
‡Xiaoyan Xia,
†David C. Chalupa,
§and Mark J. Utell
§†
Center for Air Resource Engineering and Science, Clarkson University, Potsdam, New York 13699-5708, United States
‡
Division of Air Resources, NYS Department of Environmental Conservation, Albany, New York 12233, United States
§
Departments of Medicine and Environmental Medicine, University of Rochester Medical Center, Rochester, New York 14642, United States
b
S Supporting Information1. INTRODUCTION
Residential wood combustion (RWC) refers to the burning of wood infireplaces, woodstoves, and other devices used to heat homes.1 The major substances in the wood smoke are carbon monoxide (CO), organic gases, PM2.5(particulate matter with an
aerodynamic diameter less than or equal to 2.5μm), nitrogen oxides, and sulfur oxides. The particulate fraction is composed of solid or liquid organic compounds, elemental carbon (EC), trace elements (K, S, Cl, etc.), and inorganic ash.2,3
Numerous studies reported adverse health effects from breathing RWC smoke. Zelikoff et al. examined the human and animal studies performed over the last three decades.4They concluded that exposure to RWC smoke, particularly for children, represents a potential health hazard. With regards to adults, prolonged inhalation of wood smoke contributed to chronic pulmonary disease.
RWC particles are emitted both indoors and outdoors. Approximately 70% of wood smoke from chimneys can actually re-enter the home and neighborhood dwellings.5 Considering people spend 60 70% of their time at home,6 RWC smoke poses a substantial human health risk. In the United States, RWC was estimated to account for approximately 7.0% of the national primary PM2.5emissions in 2002.7These emissions are larger
than the contribution of on-road (2.5%) and are similar to the emissions from off-road (7.3%) mobile sources.
RWC is the largest contributor to PM2.5mass in rural areas of
New York State particularly during the heating season.8
Emis-sions contributions from RWC vary across the continent and are known to be higher in the Northeastern U.S.9There were 29 ambient PM2.5monitoring stations in New York State in 2008.
Since regulatory ambient air monitoring is based on population exposure, these monitors were generally concentrated in urban locations (17 of the 29 stations were located in the NYC metropolitan area) resulting in somewhat sparse coverage across large parts of the state.10 Thus, the distribution of RWC particles is currently not well-characterized by regulatory monitoring networks.
Organic components of wood smoke particles such as polycyclic aromatic hydrocarbons (PAHs) have been suggested to enhance ultraviolet absorption at 370 nm relative to 880 nm in two-wavelength aethalometer black carbon (BC) measurements.11
Received: April 23, 2011 Accepted: July 20, 2011 Revised: July 11, 2011 ABSTRACT: In the United States, residential wood combustion (RWC) is
responsible for 7.0% of the national primary PM2.5emissions. Exposure to RWC
smoke represents a potential human health hazard. Organic components of wood smoke particles absorb light at 370 nm more effectively than 880 nm in two-wavelength aethalometer measurements. This enhanced absorption (Delta-C = BC370 nm BC880 nm) can serve as an indicator of RWC particles. In this study,
aethalometer Delta-C data along with measurements of molecular markers and potassium in PM2.5were used to identify the presence of airborne RWC particles
in Rochester, NY. The aethalometer data were corrected for the loading effect. Delta-C was found to strongly correlate with wood smoke markers (levoglucosan and potassium) during the heating season. No statistically significant correlation was found between Delta-C and vehicle exhaust markers. The Delta-C values were substantially higher during winter compared to summer. The winter diurnal
pattern showed an evening peak around 21:00 that was particularly enhanced on weekends. A relationship between Delta-C and PM2.5was found that permits the estimation of the contribution of RWC particles to the PM mass. RWC contributed 17.3% to the
PM2.5concentration during the winter. Exponential decay was a good estimator for predicting Delta-C concentrations at different
Environmental Conservation (NYS DEC) maintains a mon-itoring site in Rochester, NY (43°0804600 N, 77°3205400 W,
Elevation = 137 m, USEPA site code 36-055-1007). The site is adjacent to the intersection (∼300 m) of two major highways (I-490 and I-590) with the annual average daily traffic (AADT) of 224,840 vehicles.15A major SO2emitter in this region, the Eastman
Kodak complex, is located∼6 km northwest of the downtown area. In Monroe County, where the city of Rochester is located, RWC emissions are ranked eighth in PM2.5 contributions
compared with other source types. RWC emissions were estimated to be 215 tons in 2005.16 There were 1867 housing units in Rochester using wood for space heating fuel in 2008.17Figure S1 shows the locations of the monitoring site, the major roadways, and emission sources in the Rochester, NY area.
Measurements of BC concentrations were made using a two-wavelength aethalometer (370 and 880 nm, Model AE-21, Magee Scientific, USA) with a time resolution of 5 min from 06/23/2008 to 02/28/2011 in Rochester, NY. The instrument aspirated the ambient air at aflow rate of 5 L/min from a height of∼5 m above the ground level. A 2.5μm sharp-cut cyclone inlet (BGI model SCC-1.828) excluded particles larger than 2.5 μm from the instrument. The number concentrations of particles in 10 500 nm size range, PM2.5, CO, SO2, O3, and
meteorological variables were recorded on an hourly basis during the same period.15
The number size distribution concentrations of 10 500 nm particles were measured using a scanning mobility particle sizer (SMPS), consisting of a differential mobility analyzer (DMA, model 3071, TSI Inc.), a85Kr aerosol neutralizer (model 3077, TSI Inc.), and a condensation particle counter (CPC, model 3010, TSI Inc.). Trace gas species, CO, SO2, and O3, were measured
using Thermo Environmental instruments, models 48C, 43C, and 49C, respectively. Hourly PM2.5mass was measured using a
Tapered Element Oscillating Microbalance (TEOM) model 1400a (Rupprecht and Patashnick now Thermo Environmental, Waltham, MA). Twenty-four-hour PM2.5integrated molecular
marker samples were collected on quartzfilters at this site every third day from Oct 2009 to Oct 2010. Individual organic com-pounds including levoglucosan,fifteen PAH species (phenathrene, anthracene, 4H-cyclopenta[def]phenanthrene, fluoranthene, pyrene, chrysene+triphenylene, 1-methylnaphthalene, 2,6-di-methylnaphthalene, 2-methylanthracene, 1-methylpyrene, retene, benzo[e]pyrene, benzo[a]pyrene, dibenz[a,h]+[a,c]-anthracene, and benzo[ghi]perylene), and fourteen vehicle exhaust markers (18R(H)22,29,30-trisnorneohopane, 17R (H)-22,29,30-trisnorhopane, 17R(H),21β(H)-29-norhopane, 18R -(H)-29-norneohopane, 22S,17R(H),21β(H)-30-homohopane, 22R,17R(H),21β(H)-30-homohopane, 22S,17R (H),21β(H)-30-bishomohopane, 22R,17R(H),21β(H)-30-bishomohopane,
where ATN is the attenuation,I0 is the light intensity of the
incoming light, andIis the light intensity after passing through thefilter. However, the relationship between ATN change and BC concentration is not linear.20As thefilter gets darker (as ATN increases), the measured BC concentration is underestimated. In this study, the loading effect of aethalometer data was corrected using eq 2
BCcorrected ¼ ð1 þ K3ATNÞ3BCnon corrected ð2Þ
whereKis the correction factor. The value for the factorKwas calculated for eachfilter spot making the data continuous. The correction factor was calculated as follows
Ki ¼
TheKifactor was then used to correct the BC data for both
wavelengths for thefilter spotiin eq 2. In practice, theKifactors were calculated from eq 3 using the average BC0of the last two
measurements fromfilter spotiand thefirst two measurements offilter spoti+1 with 5-min time resolution. This algorithm has been discussed and used in recent studies.21 23
The conditional probability function (CPF) was computed using the Delta-C values coupled with wind speed and wind direction values to identify possible locations of local sources.24 In the analysis, the CPF is defined as
CPFΔθ ¼ mΔθ nΔθ
ð4Þ
wheremΔθis the number of occurrences from wind sectorΔθ
that exceeded the threshold criterion, andnΔθis the total number
of data points that fell within the same wind sector. In this study,
Δθwas set at 30°, and the threshold was set at the upper 10th percentile of the values observed at each site.
3. RESULTS AND DISCUSSION
The Loading Effect Correcting Factor - K. The average
matter was dominated by local sources.20,22 Therefore, the loading effect on the aethalometer data was corrected in further data analysis.
The Seasonal Variations of Delta-C.Figure 1 shows the
monthly average Delta-C values and ambient temperature between Jun 2008 and Feb 2011. As expected, Delta-C is strongly linked to the season, with highest values in the colder, winter months and much lower values during the warmer, summer months. The correlation coefficient be-tween ambient temperature and Delta-C was 0.78. The average Delta-C values were 0.12 μg/m3, 0.06 μg/m3,
0.19 μg/m3, and 0.24 μg/m3 for spring, summer, fall, and winter, respectively (Figure S3). The summertime Delta-C was mostly attributed to remote forest fires events12and holiday firework/biomass burning activities.25 A different seasonal trend for BC measured at both wavelengths is shown in Figure S3. The highest concentrations were observed during fall, while the lowest ones were during spring. The different
seasonal profile between BC and Delta-C suggests different sources contributing to these two species.
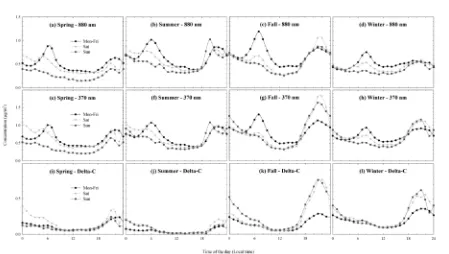
The Diurnal Variations of Delta-C.Figure 2 presents the diurnal pattern of BC and Delta-C on weekdays (Monday-Friday), Saturdays, and Sundays during the four seasons. The Delta-C values were elevated during the evening hours (peak around 21:00 h.) and also higher on weekends (Saturday-Sunday) compared to weekdays in spring, fall, and winter. These times correspond to periods when RWC is likely to occur. There is limited wood-burning during the work-day hours and it increases during the traditional at-home evening hours. In summer, slightly elevated Delta-C values during evening - early morning may suggest the impact of inver-sion-like meteorological conditions. The 880 and 370 nm BC both showed a morning peak (6:00 7:00 h.) on weekdays linked to the traffic emissions. A smaller peak was observed during evenings on both weekdays and weekends that may be due to inversions. Although BC is emitted during wood
Figure 1. Time series plot of the monthly average Delta-C values (gray bars) and ambient temperature (solid circles). The correlation coefficient
between the two variables is shown in the top-right corner.
combustion, it is not a robust or useful marker for RWC particles.
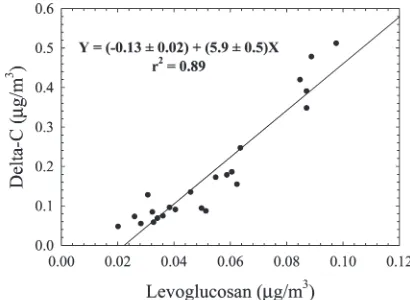
The Correlations between Delta-C and Levoglucosan/ Potassium. To further assess the specificity of Delta-C to identify and quantify RWC PM, Delta-C is compared to the measured concentrations of levoglucosan and potassium that have been used as wood smoke markers3,26,27Seasonal variations of 24-h average levoglucosan, elemental potassium, and potas-sium ion concentrations are shown in Figure S4. Similar to Delta-C, the highest and lowest concentrations of levoglucosan and elemental potassium were found in winter and summer, respec-tively. There was no distinct seasonal trend in the potassium ion concentrations. A statistically significant linear relationship be-tween Delta-C and levoglucosan was observed during winter (r2= 0.89,p< 0.01) as shown in Figure 3. The coefficients of determination (r2) between Delta-C and levoglucosan during spring, summer, and fall shown in Figure S5 were all greater than 0.57 indicating a strong correlation between these two species.
Figure S6 shows the relationship between Delta-C and ele-mental potassium during the four seasons. The winter r2 was 0.63, while the spring and fallr2were 0.43 and 0.47, respectively. The summertime Delta-C and potassium showed no correlation (r2 = 0.03). The weaker correlation between Delta-C and potassium compared to Delta-C and levoglucosan was probably
due to the additional sources of potassium (e.g., crustal materials, meat cooking). The Delta-C to potassium ratio during the winter was 10.1 (Figure 4) useful for further source apportionment analysis.28
The correlation between Delta-C and phenanthrene (a PAH mainly from traffic emissions) was not statistically significant at the 99% confidence level (p= 0.23). The correlation between Delta-C and each of the fourteen species was also calculated. The highest r2 value (0.03) was found between Delta-C and 17R -(H),21β(H)-29-norhopane. Since thep value in the ANOVA test is greater than 0.05, there is no statistically significant relationship between these two variables at the 95% confidence level. Delta-C and the other thirteen vehicle exhaust markers showed no correlation (r2< 0.01,p> 0.05). Therefore, Delta-C is independent of traffic emissions.
The Correlations between Delta-C and Other Pollu-tants.The Pearson correlation coefficients between Delta-C and other measured pollutants are summarized in Table 1. Winter Delta-C correlated well with the 50 100 nm (r= 0.68) and 100 500 nm particles (r= 0.79). It also closely related to BC concentrations during winter. Moderate negative correla-tions were consistently observed between Delta-C and O3.
There was little correlation between Delta-C and SO2during
all four seasons. Wang et al.15 reported that the Eastman Kodak was one of the major SO2sources in Rochester after
May 2008.
Figure 3. The relationship between 24-h average Delta-C and levoglucosan concentrations during winter.
Figure 4. The scatter plot of 24-h average Delta-C versus elemental potassium concentrations during winter. The edge is shown by the black solid line.
aNumber concentrations of particles in 10 50 nm, 50 100 nm, and
100 500 nm size range.
Figure 5. The scatter plot of hourly Delta-C versus PM2.5
A stronger correlation between Delta-C and PM2.5 was
observed during winter (r = 0.51) compared to summer (r= 0.01). For those periods in winter when the hourly average PM2.5 concentration was greater than 15 μg/m3, the average
Delta-C value was 0.48μg/m3(average PM2.5= 19.0μg/m3),
which was twice the winter average Delta-C value. In summer, the average Delta-C was 0.05μg/m3when the hourly average PM2.5exceeded 15μg/m3(average PM2.5= 21.9μg/m3), which
was close to the summertime overall average value (0.06μg/m3).
Therefore, during winter RWC particles were strongly related to the elevated PM2.5 concentrations. The high Delta-C values
during summer were mostly from several discrete events. Figure 5 shows the scatter plot of Delta-C vs PM2.5during
winter. Four data points with Delta-C values greater than 4.0μg/m3 were observed on 1/11/2009. Back-trajectory results indicate that the air parcel traveled from central Canada (Figure S7), where no forestfire activity was detected (Figure S8). The wind direction shifted from the north to the south with wind speed less than 1.0 m/s. The temperature dropped steadily (∼ 7 °C) during the afternoon hours on 1/11/2009 (Figure S9). The RWC smoke would build up and remain at a high level under such likely inversion conditions. Pollutant concentrations started to increase around 16:00 h. and peaked around 21:00 h. CO concentration doubled from 0.4 ppm to 0.8 ppm and PM2.5mass
increased from 8μg/m3to 25μg/m3. As wind direction changed to the southwest and wind speed increased, the inversion lifted and Delta-C decreased substantially to less than 1μg/m3around
midnight. Thus, these extreme high winter evening Delta-C values were attributed to the combination of RWC activities
and an atmospheric inversion. All of the data shown in Figure S9 are summarized in Table S1.
An edge28with PM2.5to Delta-C ratio of 7.5 was observed
in Figure 5. A comparable value of 7.8 was found in multiple locations in Connecticut.29The Rochester RWC contribu-tion to PM2.5 can, therefore, be estimated to be 17.3%. It
increased to 27.2% when the corresponding hourly PM2.5
concentrations were greater than 15 μg/m3. Thus, RWC plays a major role in the winter ambient air pollution at this urban location.
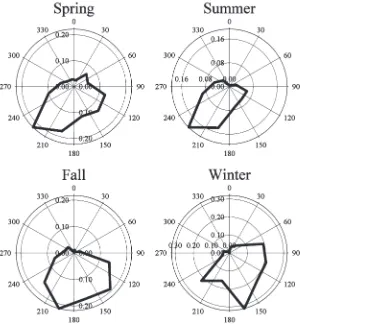
The Locations of Local Delta-C Sources. CPF plots for
Delta-C in spring, summer, fall, and winter are presented in Figure 6. Delta-C values are the highest from the southwest during spring and summer (210°-240°). In fall and winter, high Delta-C values were frequently observed from the south (150° -210°). The highest probability of 0.32 was found when the wind direction was 165°during winter. The plots point toward the residential area south of the monitoring site.
The Effects of Snow Fall and Wind Speed on Delta-C.Snow and ice are known to be efficient scavengers of particles.30,31 Figure S10 shows the relationship between Delta-C and winter snow fall. The data collected during 18:00 5:00 h. in Dec-Feb when the wind speed was smaller than 1 m/s were included to minimize the temporal variation and the wind impact. A strong exponential decay between Delta-C and snow fall was found (r2= 0.99). The Delta-C values decreased∼50% when the snow fall rose from 0.0 to 0.1 cm/h.
Wind speed also affects the BC concentrations.13Figure S11 illustrates the relationship between Delta-C and wind speed.
ment was sensitive to forest fire smoke that has undergone significant transport.12
In this study, another high Delta-C event (>4.0μg/m3) was observed during late afternoon midnight on 11/23/2008 (Figure S12). The HYSPLIT backward trajectories (Figure S13) show that the origin of air parcels was central Canada, where a wide area of forest fires was detected (Figure S14). Local winds were from southwest and averaged 1 m/s during the period. Prior to 16:00 h. on November 23, PM2.5mass was
below 10μg/m3, CO was 0.6 ppm, and BC was around 0.5μg/m3. Thereafter, concentrations increased rapidly over the next few hours with PM2.5mass and CO reaching 28μg/m3and 1.3 ppm,
respectively, around 21:00 h. The large Delta-C enhancement (from 0.2μg/m3to 5.3μg/m3) is indicative of substantial wood smoke combustion PM concentration. BC at 880 nm showed another peak around 9:00 h. on November 24, but Delta-C was only 0.7 μg/m3. This BC peak was attributed to enhanced emissions from nearby roadways during the Monday morning commute. All of the data shown in Figure S12 are summarized in Table S2.
This work illustrates the feasibility of using Delta-C to characterize residential wood combustion particles. Delta-C was found to strongly correlate with classic wood smoke markers (levoglucosan and potassium) during the heating season. No statistically significant correlation was found be-tween Delta-C and vehicle exhaust markers. Delta-C was particularly enhanced during the late evening on winter week-ends. Elevated concentrations during other periods were linked to emissions from remote forest fires. Compared to conven-tional integrated PM2.5sampling and analysis, this method is
simpler, cheaper, more readily accessible, and of higher time resolution for indicating the contribution level of wood smoke to atmospheric pollution. The Delta-C/PM2.5ratio of 7.5 was
useful for further RWC source apportionment work. RWC particles contributed 17.3% to ambient PM2.5 concentrations in
Rochester, NY during winter.
’ASSOCIATED CONTENT
b
S Supporting Information. Tables S1 and S2 and FiguresS1-S14. This material is available free of charge via the Internet at http://pubs.acs.org.
’AUTHOR INFORMATION
Corresponding Author
*Phone: 315-268-3861. Fax: 315-268-4410. E-mail: hopkepk@ clarkson.edu.
not necessarily reflect the views of the Agency and no official endorsement should be inferred. The authors also would like to thank Mr. David C. Chalupa from University of Rochester Medical Center for collecting UFP data and molecular marker samples and Tom Everts from NYSDEC for maintenance of the air monitoring instrumentation. The authors gratefully acknowledge the NOAA Air Resources Laboratory (ARL) for the provision of the HYSPLIT transport and dispersion model and the READY Web site (http://www.arl.noaa.gov/ready.html) used in this work.
’REFERENCES
(1) Health effects of breathing woodsmoke; United States Environ-mental Protection Agency, 2007. http://www.epa.gov/burnwise/pdfs/ woodsmoke_health_effects_jan07.pdf.
(2) Ammann, H. M. Health implications of wood smoke.Proceedings of the International Conference on Residential Wood Combustion. Reno, NV, 1986.
(3) Rau, J. A. Composition and size distribution of residential wood smoke particles.Aerosol Sci. Technol.1989,10, 181–192.
(4) Zelikoff, J. T.; Chen, L. C.; Cohen, M. D.; Schlesinger, R. B. The
toxicology of inhaled woodsmoke.J. Toxicol. Environ. Health, Part B
2002,5, 269–282.
(5) Pierson, W. E.; Koenig, J. Q.; Bardana, E. J. Potential adverse health effects of wood smoke.Western J. Med.1989,151, 339–342.
(6) Sexton, K.; Liu, K. S.; Treitman, R. D.; Spengler, J. D.; Turner, W. J. Characterization of indoor air quality in woodburning residences.
Environ. Int.1986,12, 265–278.
(7) U.S. Environmental Protection Agency, 2002 national emissions inventory data and documentation. www.epa.gov/ttnchie1/net/2002in-ventory.html.
(8) Assessment of carbonaceous PM2.5 for New York and the region; report 08-01; New York State Energy Research and Development Authority (NYSERDA): Albany, NY, 2008. http://www.nyserda.org/ programs/environment/emep/Carbonaceous_PM_2.5_Vol._II.pdf.
(9) Fine, P. M.; Cass, G. R.; Simoneit, B. R. T. Organic compounds in biomass smoke from residential wood combustion: emissions char-acterization at a continental scale.J. Geophys. Res.2002,107, 8349; DOI 10.1029/2001JD000661.
(10) Brauer, M.; Miller, P.; Allen, G. A.; Rector, L. Modeling pollution from residential wood combustion.EM - Air Waste Manage. Assoc.2010,May, 24-28.
(11) Allen, G. A.; Babich, P.; Poirot, R. L. Evaluation of a new approach for real-time assessment of woodsmoke PM. InProceedings of the Regional and Global Perspectives on Haze: Causes, Consequences, and Controversies, Air and Waste Management Association Visibility Specialty Conference, Asheville, NC, 2004, paper #16.
(12) Wang, Y.; Huang, J.; Zananski, T. J.; Hopke, P. K.; Holsen, T. M. Impacts of the Canadian forestfires on atmospheric mercury and
carbonaceous particles in northern New York.Environ. Sci. Technol.
(13) Wang, Y.; Hopke, P. K.; Rattigan, O. V.; Zhu, Y. Characteriza-tion of ambient black carbon and wood burning particles in two urban areas.J. Environ. Monit.2011,13, 1919–1926.
(14) Wang, Y.; Hopke, P. K.; Utell, M. J. Urban-scale spatial-temporal variability of black carbon and winter residential wood combustion particles.Aerosol Air Qual. Res., in press.
(15) Wang, Y.; Hopke, P. K.; Chalupa, D. C.; Utell, M. J. Long-term study of urban ultrafine particles and other pollutants.Atmos. Environ.
2010; DOI 10.1016/j.atmosenv.2010.08.022.
(16) State and county emission summaries. http://www.epa.gov/ cgi-bin/broker?_service=data&_debug=0&_program=dataprog.dw_do_ all_emis_2005.sas&pol=231&stfips=36.
(17) Energy analysis - information, presentations and other reports/ documents; New York State Energy Research and Development Authority (NYSERDA), 2010. http://www.nyserda.org/publications/patterns_ trends_1994-2008.pdf.
(18) Simoneit, B. R. T.; Schauer, J. J.; Nolte, C. G.; Oros, D. R.; Elias, V. O.; Fraser, M. P.; Rogge, W. F.; Cass, G. R. Levoglucosan, a tracer for cellulose in biomass burning and atmospheric particles.Atmos. Environ.
1999,33, 173–182.
(19) Air Quality System (AQS). http://www.epa.gov/ttn/airs/ airsaqs/detaildata/downloadaqsdata.htm.
(20) Weingartner, E.; Saathoff, H.; Schnaiter, M.; Streit, N.; Bitnar,
B.; Baltensperger, U. Absorption of light by soot particles: determination of the absorption coefficient by means of aethalometers.J. Aerosol Sci.
2003,34, 1445–1463.
(21) Park, S. S.; Hansen, A. D. A.; Cho, S. Y. Measurement of real time black carbon for investigation spot loading effects of aethalometer
data.Atmos. Environ.2010,44, 1449–1455.
(22) Turner, J. R.; Hansen, A. D.; Allen, G. A. Methodologies to compensate for optical saturation and scattering in aethalometer black carbon measurements.A&WMA Symposium on Air Quality Measurement Methods and Technology, San Francisco, CA, 2007; paper # 37.
(23) Virkkula, A.; M€akel€a, T.; Hillamo, R.; Yli-Tuomi, T.; Hirsikko, A.; H€ameri, K.; Koponen, I. K. A simple procedure for correcting loading effects of aethalometer data.J. Air Waste Manage. Assoc.2007,57, 1214–
1222.
(24) Kim, E.; Hopke, P. K.; Edgerton, E. S. Source identification of
Atlanta aerosol by positive matrix factorization.J. Air Waste Manage. Assoc.2003,53, 731–739.
(25) Wang, Y.; Hopke, P. K.; Rattigan, O. V. An indicator offirework
emissions during the Independence Day in Rochester, New York. Under peer review.
(26) Jordan, T. B.; Seen, A. J.; Jacobsen, G. E. Levoglucosan as an atmospheric tracer for woodsmoke.Atmos. Environ.2006,40, 5316–5321. (27) Simoneit, B. R. T. Biomass burning - a review of organic tracers for smoke from incomplete combustion.Appl. Geochem.2002,17, 129–162.
(28) Henry, R. C. Multivariate receptor modeling by N-dimensional edge detection.Chemom. Intell. Lab. Syst.2003,65, 179–189.
(29) Evaluation of wood smoke contribution to particle matter in Connecticut; Connecticut Department of Environmental Protection, Bureau of Air Management, 2011.
(30) Lei, Y. D.; Wania, F. Is rain or snow a more efficient scavenger of
organic chemicals?Atmos. Environ.2004,38, 3557–3571.
(31) McLachlan, M. S.; Sellstr€om, U. Precipitation scavenging of particle-bound contaminants a case study of PCDD/Fs.Atmos. Environ.
2009,43, 6084–6090.
’NOTE ADDED AFTER ASAP PUBLICATION