Tiyas Hani Rosyidah, 2016
COMPARING SCIENCE VIRTUAL AND PAPER-BASED TEST TO MEASURE STUDENTS’ CRITICAL THINKING ON LIVING THING AND ENVIRONMENTAL SUSTAINABILITY
Universitas Pendidikan Indonesia | repository.upi.edu | perpustakaan.upi.edu CHAPTER III
RESEARCH METODOLOGY
A. Research Method and Research Design
There must be research method and research design in order to make the research systematic and well arranged. Research method and research design in this research is explained as followed.
1. Research Method
The method used in this research was pre-experiment method specified into weak experiment method where there was only one group used. Pre- experiment method enable the subject to be tested in order to increase the reliability of the test. In detail, this research was using the same subject to be tested twice in order to control the subject to remain stable during the implementation of eac science virtual test and paper- based test. This method was apropriate with the objective of the research which is comparing vitual test and paper-based test to measure student critical thinking on living thing and environmental sustainability.
2. Research Design
The design used in this research was one group post-test only design where the sample is taken only from one class. Those students in one class was given the same test for both science virtual test and paper- based test in range of time. Both of the test was given for post test only because the information required to answer each question has been provided in the test. Thus, it was independently on students’ prior knowledge.
Tiyas Hani Rosyidah, 2016
COMPARING SCIENCE VIRTUAL AND PAPER-BASED TEST TO MEASURE STUDENTS’ CRITICAL THINKING ON LIVING THING AND ENVIRONMENTAL SUSTAINABILITY
Universitas Pendidikan Indonesia | repository.upi.edu | perpustakaan.upi.edu Tabel 3.1 One Group Post-test Design
Sample Group Paper- based Test Post-test
Science Virtual Test Post-test
B. Population and Sample
The location of this research was a Public Junior High School “X” Bandung. The population in this research were all 8th grade students in ten classes at Public Junior High School “X” Bandung. The samples were 8th grade student in one class of International Junior High School “X” Bandung. There are 40 students as the sample (See appendix 11 and 12). The sampling technique was proposive sampling. Fraenkle, Wallen, and Hyun (2011) stated that proposive sampling is one obtained by using group as the sampling unit rather than individuals. In detail, proposive sampling was used by concidering the objective condition of the school where it was quite impossible to re-arrange the samples.
C. Operational Definition
In order to avoid misconception about this research, some operational definitions are explained in this research. Those terminologies are explained below:
(1) Science virtual test is a process in which the product is tested virtually by concidering various characteristics. Science virtual test in this research is conducted in the form of multiple choices questions made by using Adobe flash player 9 software (See appendix 6). Each of test item contain certain information provided in audio-narrative, picture, poster, and video.
Tiyas Hani Rosyidah, 2016
COMPARING SCIENCE VIRTUAL AND PAPER-BASED TEST TO MEASURE STUDENTS’ CRITICAL THINKING ON LIVING THING AND ENVIRONMENTAL SUSTAINABILITY
Universitas Pendidikan Indonesia | repository.upi.edu | perpustakaan.upi.edu
(3) Critical thinking is the intellectually disciplined process of actively and skillfully conceptualizing, applying, analyzing, synthesizing, and/or evaluating information gathered from, or generated by, observation, experience, reflection, reasoning, or communication, as a guide to belief and action. Critical thinking in this research is measured by multiple choices questions made by using Adobe flash player 9 software and printed questions.
(4) Gender difference which is used in this research is students’ gender which then classified into two groups which are male group and female group who are given the same treatment and experience. The data of gender is obtained by students’ identity sheet.
(5) Learning style which is used in this research is VAK (Visual- Auditory-Kinesthetic) model. The data of students’ learning style is obtained through VAK Learning Style Inventory by Victoria Chislett. The questionnaire consists of 30 multiple choice questions with three options which indicates visual, auditory, and kinesthetic.(See appendix 8 and 9).
(6) Student experience which is used in this research is limited into experience on solving questions provided science virtually known as computer-based test. The data of students’ experience on computer-based test is obtained by students’ identity sheet.
D. Assumption
The assumption is elaborated as the foundation of this study. The assumption of this research are explained as follows :
(1) Digital media is available for everybody to be used as a media to learn as this media can be applied for all grade of student without any significant difficulties. But the biggest thing which needs to be underline is the level of test item given to the student.
Tiyas Hani Rosyidah, 2016
COMPARING SCIENCE VIRTUAL AND PAPER-BASED TEST TO MEASURE STUDENTS’ CRITICAL THINKING ON LIVING THING AND ENVIRONMENTAL SUSTAINABILITY
Universitas Pendidikan Indonesia | repository.upi.edu | perpustakaan.upi.edu
(3) There are correlation between personality traits, learning style, satisfaction and educational outcomes in a blended learning scenario that involved game-based learning strategies, flip teaching techniques and video conferencing sessions
(4) Animated pedagogical agents offer great promise for broadening the bandwidth of tutorial communication and increasing learning environments' ability to engage and motivate students.
E. Hypothesis
Hypothesis that is tested in this study are as follow
Ho1 : There is no difference in students’ critical thinking measured by using Science virtual test and Paper-based test
Ho2 : There is no difference in students’ critical thinking measured by using Science virtual test and Paper-based test based on gender
Ho3 : There is no difference in students’ critical thinking measured by using Science virtual test and Paper-based test based on visual-auditory-kinesthetic (VAK) learning style
Ho4 : There is no difference in students’ critical thinking measured by using Science virtual test and Paper-based test based on students’ experience
F. Research Instrument
In this research, instrument is necessary to be used for gaining data. There are three types of instruments used in this research which are objective tests to measure students’ critical thinking provided in form of science virtual and paper-baed test, questions at VAK learning style inventory by Victoria Chislett, and questionnaire about students’ impresion on science virtual test.
1. Objective Test
Tiyas Hani Rosyidah, 2016
COMPARING SCIENCE VIRTUAL AND PAPER-BASED TEST TO MEASURE STUDENTS’ CRITICAL THINKING ON LIVING THING AND ENVIRONMENTAL SUSTAINABILITY
Universitas Pendidikan Indonesia | repository.upi.edu | perpustakaan.upi.edu
the same test score (Murayama, 2009). Objective test is constructed as measuring tools in order to know students’ critical thinking score regarding science topic which specified about “living thing and environmental sustainability”. There are two forms of test item provided in this research, which are science science virtual test and paper-based test. Science virtual test has been constructed and validated in previous research, while paper-based test was constructed by converting science virtual test into black and white printed version. The audio narrative was re-arranged becoming written version.
a. Science Virtual Test
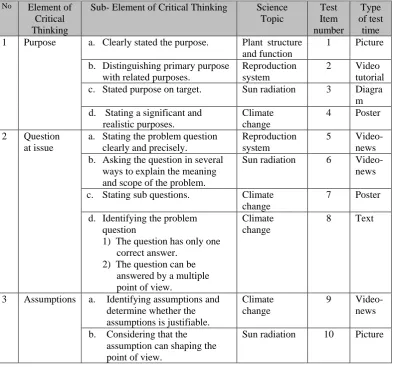
Science virtual test item in this research is conducted in the form of multiple choices questions made by using Adobe flash player 9 software. The set of question is addopted from previous research regarding the “Science Virtual Test as Test Item Development”. There are 26 questions constructed based on eight elements of critical thinking. The question is all about living thing and environmental sustainability, which is specified into five topic for grade VIII taken from kurikulum 2013 document. Those topic are plant structure and function, reproduction system, society development and its effect, sun radiation, and climate change. The lay out about test item construction is explained on Table 3.2.
Tiyas Hani Rosyidah, 2016
COMPARING SCIENCE VIRTUAL AND PAPER-BASED TEST TO MEASURE STUDENTS’ CRITICAL THINKING ON LIVING THING AND ENVIRONMENTAL SUSTAINABILITY
Universitas Pendidikan Indonesia | repository.upi.edu | perpustakaan.upi.edu
This instrument was necessary to be used for obtaining data regarding students’ critical thinking skill. It consists of 28 mutiple choice questions which represent eight elements of critical thinking by Inch (2006) which are generates purpose, raises question at issue, makes assumption, embodies point of view, uses information, utilizes concept, makes interpretation and inferences, and generates implication and concequences. In addition, this instrument was constructed based on “living thing and environmental sustainability” on VIII grade science students, specified into plant structure and function, reproduction system, population growth and its impact, sun radiation, and climate change. For furthur detail was explained on the Table 3.2 and the capture of science virtual test item attached on the appendix.
Table 3.2 Layout of Science Virtual Test Item based on Critical Thinking Element No Element of
Critical Thinking
Sub- Element of Critical Thinking Science Topic 1 Purpose a. Clearly stated the purpose. Plant structure
and function
1 Picture
b. Distinguishing primary purpose with related purposes.
Reproduction system
2 Video
tutorial
c. Stated purpose on target. Sun radiation 3 Diagra
m d. Stating a significant and
realistic purposes.
a. Stating the problem question clearly and precisely.
Reproduction system
5
Video-news b. Asking the question in several
ways to explain the meaning and scope of the problem.
Sun radiation 6 Video-
news
c. Stating sub questions. Climate
change
7 Poster
d. Identifying the problem question
1) The question has only one correct answer.
2) The question can be answered by a multiple point of view.
Climate change
8 Text
3 Assumptions a. Identifying assumptions and determine whether the
b. Considering that the assumption can shaping the point of view.
Tiyas Hani Rosyidah, 2016
COMPARING SCIENCE VIRTUAL AND PAPER-BASED TEST TO MEASURE STUDENTS’ CRITICAL THINKING ON LIVING THING AND ENVIRONMENTAL SUSTAINABILITY
Universitas Pendidikan Indonesia | repository.upi.edu | perpustakaan.upi.edu
No Element of Critical Thinking
Sub- Element of Critical Thinking Science Topic
a. Identify point of view. Plant structure and function
11 Picture
b. Identify the strengths and weaknesses of the point of view.
Reproduction system
12 Video
tutorial
c. Strive to be fair-minded in evaluating all points of view.
Plant structure and function
13 Poster
5 Information a. Expressed support based on the data.
b. Search for information that opposes and supports argument.
Reproduction system
15 Picture
c. Using clear information, accurate and relevant with the question at issue.
Climate change
16
Video-appeal
d. Gather information. Population
growth and its effect
17 Video-
news
6 Concepts a. Identify key concepts and states clearly
Reproduction system
18 Picture
b. Stating alternative concepts or alternative definitions of Concepts
Reproduction system
19 Text
c. Using the concept of carefully and precisely.
a. Infer based on the evidence. Climate change
21 Video-
news b. Checking the consistency of
inferences
Climate change
22
Video-appeal c. Identifying assumptions can
lead to inferences
a. Finding the implications and consequences that follow from reasoning.
Sun radiation 24 Picture
b. Stating positive and negative implications.
Sun radiation 25 Picture
Tiyas Hani Rosyidah, 2016
COMPARING SCIENCE VIRTUAL AND PAPER-BASED TEST TO MEASURE STUDENTS’ CRITICAL THINKING ON LIVING THING AND ENVIRONMENTAL SUSTAINABILITY
Universitas Pendidikan Indonesia | repository.upi.edu | perpustakaan.upi.edu
all about living thing and environmental sustainability, which is specified into five topic for grade VIII taken from kurikulum 2013 document. Those topic are plant structure and function, reproduction system, population growth and its impact, sun radiation, and climate change as it is explained on Table 3.3
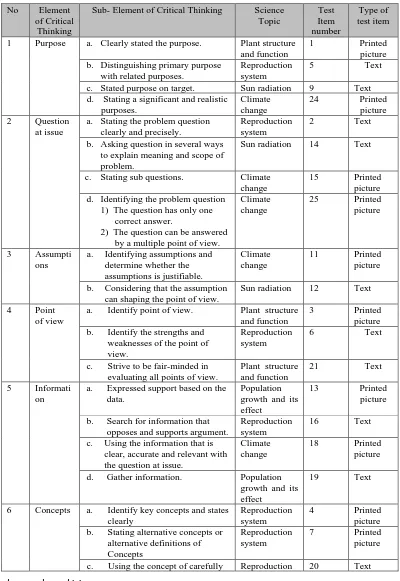
Paper-based test is a convertion of standardized test regarding students’ critical thinking which has been developed by Firman and Rusyati (2015) into printed version. The audio narrative on science virtual test item was converted into text, and the pictures, posters, and diagrams are provided into black and white printed version. It also has been validated through several stages. The processes began the expert judgement where the test items are checked by the expert in side of education which is spesified in critical thinking, biology content, and computer-based media. Then it was followed by the legibility and limited validation tes conducted using Anates version 4.0. After the reliability and validity of test items have been revealed, the acceptance and rejections of each item on the test was identified. After all, the revised, valid, and reliable paper-based test is ready to be used with high reliability (Cronbach’s Alpha 0.610), and moderate difficulty level.
Tiyas Hani Rosyidah, 2016
COMPARING SCIENCE VIRTUAL AND PAPER-BASED TEST TO MEASURE STUDENTS’ CRITICAL THINKING ON LIVING THING AND ENVIRONMENTAL SUSTAINABILITY
Universitas Pendidikan Indonesia | repository.upi.edu | perpustakaan.upi.edu
Table 3.3 Layout of Paper-based Test Item based on Critical Thinking Element
No Element
of Critical Thinking
Sub- Element of Critical Thinking Science
Topic
1 Purpose a. Clearly stated the purpose. Plant structure
and function
1 Printed
picture b. Distinguishing primary purpose
with related purposes.
Reproduction system
5 Text
c. Stated purpose on target. Sun radiation 9 Text
d. Stating a significant and realistic purposes.
a. Stating the problem question clearly and precisely.
Reproduction system
2 Text
b. Asking question in several ways to explain meaning and scope of problem.
Sun radiation 14 Text
c. Stating sub questions. Climate
change
15 Printed
picture d. Identifying the problem question
1) The question has only one correct answer.
2) The question can be answered by a multiple point of view.
Climate
a. Identifying assumptions and determine whether the
b. Considering that the assumption can shaping the point of view.
Sun radiation 12 Text
4 Point
of view
a. Identify point of view. Plant structure
and function
3 Printed
picture b. Identify the strengths and
weaknesses of the point of view.
Reproduction system
6 Text
c. Strive to be fair-minded in evaluating all points of view.
Plant structure and function
21 Text
5 Informati
on
a. Expressed support based on the data.
b. Search for information that opposes and supports argument.
Reproduction system
16 Text
c. Using the information that is clear, accurate and relevant with the question at issue.
Climate change
18 Printed
picture
d. Gather information. Population
growth and its effect
19 Text
6 Concepts a. Identify key concepts and states
clearly
Reproduction system
4 Printed
picture b. Stating alternative concepts or
alternative definitions of
Tiyas Hani Rosyidah, 2016
COMPARING SCIENCE VIRTUAL AND PAPER-BASED TEST TO MEASURE STUDENTS’ CRITICAL THINKING ON LIVING THING AND ENVIRONMENTAL SUSTAINABILITY
Universitas Pendidikan Indonesia | repository.upi.edu | perpustakaan.upi.edu
No Element
of Critical Thinking
Sub- Element of Critical Thinking Science
Topic
and precisely. system
7 Interpreta
tion and inference
a. Infer based on the evidence. Climate
change
8 Text
b. Checking the consistency of inferences
Climate change
10 Printed
picture
c. Identifying assumptions can
lead to inferences
a. Finding the implications and consequences that follow from reasoning.
Sun radiation 22 Text
b. Stating positive and negative implications.
Sun radiation 23 Text
c. Considering all the possible consequence.
Climate change
26 Text
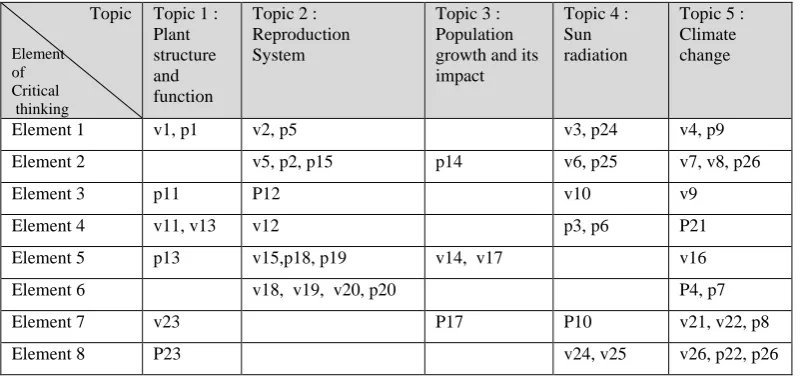
The test item distribution is included those five topics regarding “Living Thing and Environmental Sustainability”. It is distributed based on eight elements of students’ critical thinking. The science virtual test item are coded by “V” while paper-based test are coded by “P as it is explained on Table 3.4.
Table 3.4 Test Item Distribution based on Science Topic
Topic
Tiyas Hani Rosyidah, 2016
COMPARING SCIENCE VIRTUAL AND PAPER-BASED TEST TO MEASURE STUDENTS’ CRITICAL THINKING ON LIVING THING AND ENVIRONMENTAL SUSTAINABILITY
Universitas Pendidikan Indonesia | repository.upi.edu | perpustakaan.upi.edu 2. Visual-Auditory-Kinesthetic (VAK) Learning Style Inventory
Learning style refers to the ability of learners to perceive and process information in learning situations. One of the most important uses of learning styles is that it makes it easy for teachers to incorporate them into their teaching. There are different learning styles (Vaishnav,2013). VAK Learning Style Inventory by Victoria Chislett. and Alan Chapman was used to identify the preferred learning style of students. On the basis of learning style, students were divided in to three groups Visual, Auditory and Kinesthetic.
3. Questionnaire
Questionnaire is constructed by the researcher to find out students’ respond on virtual test. The questionnaire is constructed based on three aspect, which are interest, respond, and expectataion. There are three statement constructed in each aspect in the questionnaire.
G. Data Collection Technique
There are several technique to collect the data required in this research. Those data are obtained in order to know the comparison on students’ critical thinking between science virtual and paper-based test based on gender, learning style, and students’ experience.
1. Data of comparison between science virtual and paper-based test
As it is explained before that test items are provided in the form of science virtual and paper-based. Student is firstly given paper-based test item. Then, there will be about two weeks range before they are given test in the form of virtual. Science virtual test is shown on the LCD projector and suitable audio speaker so that the student will see and hear clearly what is on the test item. Both of test then assesed in the same way as follow.
Tiyas Hani Rosyidah, 2016
COMPARING SCIENCE VIRTUAL AND PAPER-BASED TEST TO MEASURE STUDENTS’ CRITICAL THINKING ON LIVING THING AND ENVIRONMENTAL SUSTAINABILITY
Universitas Pendidikan Indonesia | repository.upi.edu | perpustakaan.upi.edu
2. Data of gender, learning style, and students’ experience classification
The data about gender is simply collected by asking the student to fill it in the answeer sheet. Other than that, data about learning style is collected by asking the student to conduct test about VAK learning style inventory constructed by Victoria Chislett and identify what is the major answer of them, whether it is tend to visual, auditory, or kinesthetic. While students’s experience is simply collected in the sheet of questionnaire about students’ respond on virtual test.
3. Data of students’ respond on virtual test.
Students’ respond on virtual test is collected by giving the student sheet of questionnaire contain 9 question constructed from three aspect, which are interest, respond, and expectation. There are four kind of respond which are strongly agree, agree, disagree, and strongly disagree. The respond then convert into number, 4 for strongly agree, 3 for agree, 2 for disagree, and 1 for strongly disagree. Then, the whole data is sumarized and classified into range of respons which are from 1 to 2 as negative, from 2.1 to 3 as moderate, and from 3.1 to 4 as positive.
H. Data Analysis
Data analysis was necessary to be elaborated in order to figure out how is the data is being analyzed. There are several difference ways to analyze test item used oin this research as it was explained belows.
1. Objectives Test
The objectives used in this research lassified into science virtual test and paper- bansed test. Science virtual test construction has been finished by previous researcher so that there should not be necessary to be validated again. Hence, the convertion of science virtual test becoming paper- based test obligates to be validated. The way of validation was using Anates Version 4.0 specified into some categorized as it was explained belows.
Tiyas Hani Rosyidah, 2016
COMPARING SCIENCE VIRTUAL AND PAPER-BASED TEST TO MEASURE STUDENTS’ CRITICAL THINKING ON LIVING THING AND ENVIRONMENTAL SUSTAINABILITY
Universitas Pendidikan Indonesia | repository.upi.edu | perpustakaan.upi.edu
According to Fraenkel (2011) Validity refers to the appropriateness, meaningful-ness, correctness, and usefulness of the inferences a researcher makes. Validity is the most important idea to consider when preparing or selecting an instrument for use. Researchers want the information they obtain through the use of an instrument to serve their purposes. Validation is the process of collecting and analyzing evidence to support such inference. To determine the validity of the instrument in this study is by using software ANATES
The validity of each test item can be measured by using formula of correlation which was stated by Pearson, which is usually called as correlation formula, as follows:
� = �
⅀
− ⅀
⅀
√[�
⅀
−⅀
][�⅀
−
]
Note:
r : correlation coefficient between x and y variable n : amount of student
x : total score in test item y : total score of student
(Fraenkel, 2011)
b. Reliability
Reliability is the degree in which individuals deviation scores, or z-scores, remain relatively consistent over repeated administration of the saine test or alternative test forms (Fraenkel, 2011). The formula for calculating the reliability of a test. The formula is:
KR20 = r =
−
�2 ⅀ �2
Tiyas Hani Rosyidah, 2016
COMPARING SCIENCE VIRTUAL AND PAPER-BASED TEST TO MEASURE STUDENTS’ CRITICAL THINKING ON LIVING THING AND ENVIRONMENTAL SUSTAINABILITY
Universitas Pendidikan Indonesia | repository.upi.edu | perpustakaan.upi.edu c. Difficulty Level
When an item is dichotomously scored, the mean item score corresponds to the proportion of examinees who answer the item correctly. This proportion for itemiis usually denoted as Piand is called the item difficulty (Jandaghi, 2010). The following formula for calculating the difficulty coefficient
DifCoef question (i) = � � + � �
� ���
(Jandaghi, 2010)
d. Discriminating Power
Discriminating power refers to a way to identify items for which high-scoring examinees have a high probability of answering correctly and low-scoring examinees have a low probability of answering correctly (Crocker and Algina, 2006). The index of discrimination (D) could be calculated by:
D = рu–рi
рu : The proportion in the upper group who answered the item correctly рi : the proportion in the lower group who answered the item correctly.
(Crocker and Algina, 2006) Values of D may range from - 1 .00 to 1 .00. Positive values indicate that the item discriminates in favor of the upper group; negative values indicate that the item is a reverse discriminator, favoring the lower-scoring group.
e. Distractor
Tiyas Hani Rosyidah, 2016
COMPARING SCIENCE VIRTUAL AND PAPER-BASED TEST TO MEASURE STUDENTS’ CRITICAL THINKING ON LIVING THING AND ENVIRONMENTAL SUSTAINABILITY
Universitas Pendidikan Indonesia | repository.upi.edu | perpustakaan.upi.edu
those distractors were selected neither by the top scorer nor the low score. One item clearly indicates a confusing items seeing that one distractor is selected by more students than the correct answer.
2. VAK (Visual-Auditory-Kinehetic) Learning Style Inventory
Learning style which is used in this research is VAK (Visual- Auditory-Kinesthetic) model. The data of students’ learning style is obtained through VAK Learning Style Inventory by Victoria Chislett. The questionnaire consists of 30 multiple choice questions with three options which indicates visual, auditory, and kinesthetic.
Each item in learning style inventory has three options. The option indicates one type of learning style. The way to indicates the students’ learning style was by identify the dominant option choosen by the student in set of questions in learning style inventory sheet.
3. Questionnaire about Students’ Respond on Science Virtual Test
This research was using close ended questionnaire with four types of respond classified into srongly agree, agree, dissagree, and strongly dissagree. The students’ respond then convert into number, 4 for strongly agree, 3 for agree, 2 for disagree, and 1 for strongly disagree. Then, the whole data is sumarized and classified into range of respons which are from 1 to 2 as negative, from 2.1 to 3 as moderate, and from 3.1 to 4 as positive.
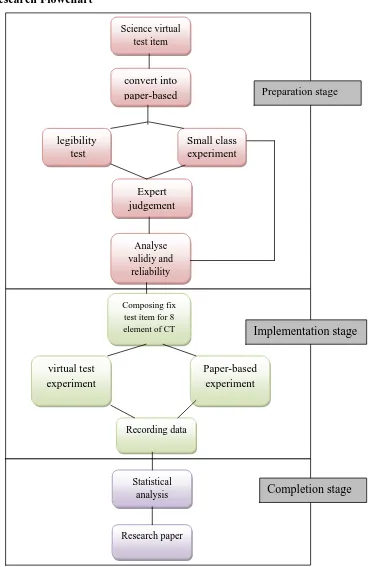
I. Research Procedure
In order to make the reaserch become more systematics and well arranged, research procedure is composed and it is consist of three stages, which are preparation stage, implementation stage, and completion stage as it is explained below.
1. Preparation Stage
Tiyas Hani Rosyidah, 2016
COMPARING SCIENCE VIRTUAL AND PAPER-BASED TEST TO MEASURE STUDENTS’ CRITICAL THINKING ON LIVING THING AND ENVIRONMENTAL SUSTAINABILITY
Universitas Pendidikan Indonesia | repository.upi.edu | perpustakaan.upi.edu
(1) Providing the layout of test item based on the eight element of critical thinking
(2) Making the test item in the form of science virtual test
(3) Converting test item provided in science virtual test into paper-based test (4) Providing answer sheet for the student
(5) Providing form of judgements (6) Readibility test
(7) Expert judgements
(8) Analyzed validity and reliability using software ANATEST version 4.0.2 program
(9) Composing fix test item
(10)Choosing two classes as the experiment classes
1. Implementation Stage
Implementation stage is a research main stage where the data is obtained and collected. The implementation stage of this research is described as follow.
(1) Conducting test in the first class using science virtual test item (2) Conducting test in the second class using paper-based test (3) Recording the data resulted in both classes
2. Completion Stage
Completion stage is a research final stage where the data which has been obtained is analyzed. The completion stage of this research is described as follow. (1) Analyzing the data resulted using statisticl analysis
Tiyas Hani Rosyidah, 2016
COMPARING SCIENCE VIRTUAL AND PAPER-BASED TEST TO MEASURE STUDENTS’ CRITICAL THINKING ON LIVING THING AND ENVIRONMENTAL SUSTAINABILITY
Universitas Pendidikan Indonesia | repository.upi.edu | perpustakaan.upi.edu
J. Research Flowchart
Science virtual test item
convert into paper-based
legibility test
Expert judgement
Composing fix test item for 8 element of CT
Analyse validiy and
reliability
Paper-based experiment virtual test
experiment
Recording data
Statistical analysis
Research paper
Figure 3.1 Research Flowchart
Completion stage
Preparation stage
Implementation stage