CHAPTER III
RESEARCH METHODOLOGY
A. Research Method and Research Design
1. Research Method
The research has a purpose to describe the current condition of
learning environment and cognitive ability of students when discussion is
implemented in teaching learning activities. According to this, then
descriptive method is used to fulfill the aim of research itself. In the
descriptive, the main objective is to give a very accurate portrayal of
characteristics of persons, situations, or groups (Polit & Hungler, 2004).
Thus, in this research, the object of research is not given any treatment
and natural condition is set without any manipulation. It will provide
reasonable answer why something is occured (Arikunto, 2010).
2. Research Design
Non-experimental with natural descriptive design is used in this
research. All of students come from two classes of seventh grade are
given pre-test and post-test. Those score are captured as the data of
cogitive ability of students. After that, Classroom Learning Environment
Survey (CLES) is a questionnaire given to the students after the
instruction is done. The result of this questionnaire is also taken as the
data of learning environment. The last, interview is conducted to clarify
all of results which are gained in this research. Based on those results, the
profile of learning environment and cognitive ability of students could be
identified.
B. Population and Sample
The location of this research is Sekolah Indonesia Kuala Lumpur (SIKL)
Malaysia which uses National Curriculum of 2013. The instruction in classes
The population of this research is all students in SIKL. The sample are
7-1 class which consist of 7-17-1 students and 7-2 class which consist of 7-13
students. So, the number of all students is 24 students. All of students in both
classes experience discussion in learning environmental pollution as it is the
main focus of this research. The subject of this research is defined under
purposed of class which used to implement discussion in teaching learning
activities.
C. Operational Definition
In order to avoid misconception, some operational definitions are
explained in this research. Those terminologies are explained as follow:
a. Learning activity in both classes is discussion which refers to statement
of Discussion is a process whereby two or more people express, clarify
and pool their knowledge, experiences, opinions, and feelings to achieve
their current purposes (Rahman et al., 2011). In this research, students
gather with three until four friends and they try to solve problem about
environmental pollution given by the teacher. Discussion is intended as
the way to look cognitive ability of students. Therefore, post-test is done
in the end of discussion to evaluate this aspect.
b. Cognitive ability of students in this research includes level of
remembering (C1), understanding (C2), applying (C3), analyzing (C4),
and evaluating (C5) based on Anderson et al. (2001). Data of cognitive
ability itself are gained by giving cognitive paper test to students in the
form of multiple choice questions.
c. Classroom learning environment in this research refers to Constructivist
Learning Environment Survey (CLES) which has been developed by
Taylor and Fraser (1991). CLES consists of five aspects such as personal
relevance, uncertainty, critical voice, shared control, and student
by quistionnaire. Data obtained through questionnaire is adjusted with
CLES aspects.
D. Research Instrument
In this research, instrument is necessary to be used for gaining data.
There are three types instruments that are used in this research. Those
instruments are described below:
a. Questionnaire
Questionnaire is an instrument which is distributed to the students to
investigate and describe the classroom learning environment after teacher
conducting instruction. Questionnaire used is based on Classroom
Learning Environment Survey format which was developed by Taylor
and Fraser (1991). This questionnaire results the students’ perception
about how the teaching learning process going on and finally give the
description about classroom learning environment. There are five
indicators which is measured in this questionnaire. Questionnaire consists
of 30 statements, 28 are positive statements while 2 are negative
statements. The blueprint of questionnaire based on CLES is shown
below on Table 3.1.
Table 3.1 Blue Print of Questionnaire Based on CLES
Indicators Question’ number
Personal Relevance 1,2,3,4,5,6
Uncertainty 7,8,9,10,11,12
Critical Voice 13,14,15,16,17,18
Shared Control 19,20,21,22,23,24
Student Negotiation 25,26,27,28,29,30
b. Cognitive Paper Test
Cognitive paper test is conducted to describe cognitive ability of
students in mastering the concept. Cognitive paper test consists of two
sections such as pre-test and post-test. Pre-test is given to students before
the students after teacher conducting instruction in classroom. Pre-test is
intended to know students’ prior knowledge about the concept of
environmental pollution. Post-test is conducted in the end of teaching
learning process. It is intended to know whether the improvement of students’ cognitive is gained after teacher conducting instruction or not. This cognitive paper test is given in the form of multiple choice question.
Multiple choice question consists cognitive domain from C1 until C5
which is about knowledge, comprehension, application, analysis, and
evaluation (Anderson et al., 2001). Cognitive paper test firstly consists of
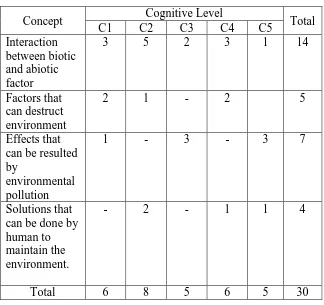
30 questions after passing judgement by expert. It is used to look students’ cognitive starting from C1 until C5. Then, it is distributed to students in grade 8 as a limited test. The blueprint of instrument before
passing instrument analysis step is described in Table 3.2 below.
Table 3.2 Blue Print of Cognitive Paper Test Question
Concept Cognitive Level Total
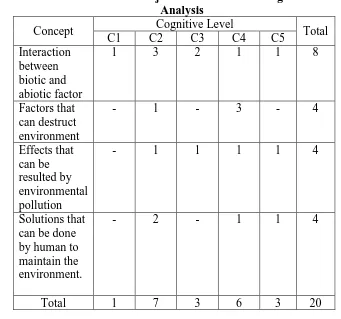
The next step after conducting limited test to 8 grade students is
analyzing this objective test using ANATES. Based on this analysis, 10
questions are used directly and there are 10 questions which are revised.
The new blueprint of objective test is shown below on Table 3.2.
Table 3.3 Blue Print of Objective Test after Passing Instrument Analysis
Concept Cognitive Level Total
C1 C2 C3 C4 C5
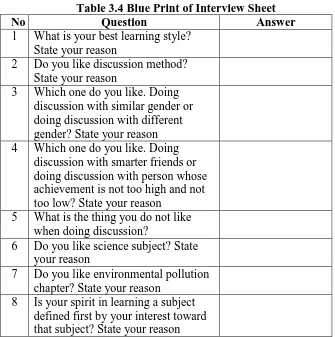
statement about learning activities that have been conducted in
classroom. This interview is given to students after they finish whole
activites starting from pre-test until post-test as the end of learning
activites. Interview sheet consists of students statement how their feeling
was during learning activities. Students are asked about learning style
they like the most, the opinion about discussion, their conformity during
intelligence, and their interest towards science subject. The blueprint of
interview sheet are shown below on Table 3.4.
Table 3.4 Blue Print of Interview Sheet
No Question Answer
1 What is your best learning style? State your reason
2 Do you like discussion method?
State your reason
3 Which one do you like. Doing
discussion with similar gender or doing discussion with different gender? State your reason
4 Which one do you like. Doing
discussion with smarter friends or doing discussion with person whose achievement is not too high and not too low? State your reason
5 What is the thing you do not like when doing discussion?
6 Do you like science subject? State your reason
7 Do you like environmental pollution chapter? State your reason
8 Is your spirit in learning a subject defined first by your interest toward that subject? State your reason
E. Instrument Analysis
Instrument analysis is done by judgement expert and ANATES V4.
Cognitive paper test which is used in limited test firstly is judged by expert.
Then, limited test could be conducted. The results of limited test is analyzed
by ANATES. Aspects which are analyzed such as validation, reliability, level
of difficulty, discriminating power, and distractor which should fulfill the
criteria.
Based on Arikunto (2013), evaluation of instrument must be valid in
order to get a valid result of the activities conducted. Anderson in
Arikunto (2013) said that a test is valid if it measures what it purpose to
measure. The validity which is used is content validity. Content validity
measures a particular purpose which is still relevant with the
material/concept given to the students. The formula to investigate the
number of validity is product moment correlation, shown as follow
rxy : correlation coefficient between X variable and Y variable
The validity interpretation is represented below on Table 3.5.
Table 3.5 Validity Interpretation Correlation Coefficient Validity Criteria
0,00 < r 0,20 Very Low
Reliability is related with trust. A test which has a high level of trust
then usually can give a consistent result in repeated trials. It means that
the reliability of a test will be very related with the consistency of test
results itself (Arikunto, 2013).
The formula which is used to define the reliability of objective test
which is multiple question is alpha formula.
r11 : Instrument reliability
n : Amount of question
i2: Amount of variant score in each item 2i
: Varian total
The reliability interpretation is represented below on Table 3.6.
Table 3.6 Reliability Interpretation Reliability Coefficient Reliability Criteria
0,00 < r 0,20 Very Low
0,20 < r 0,40 Low
0,40 < r 0,60 Satisfactory
0,60 < r 0,80 High
0,80 < r 1,00 Very high
(Arikunto, 2013)
3. Level of Difficulty
According to Arikunto (2013), level of difficulty is a term which
show the level of question, whether it is easy to solve or hard to solve.
Difficulty index is usually used as the number to show the difficulty level
of question. The range of level of difficulty is from 0,00 to 1,00. The
lower the index, then the more difficult the question and vice versa.
The formula that is used to measure the level of difficulty ( difficulty
index), shown as follow.
P : Difficulty index
B : Number of students who answer the question correctly
JS : Number of all students who join the test
The difficulty index interpretation is represented below on Table 3.7.
Table 3.7. Difficulty Index Interpretation Reliability Coefficient Validity Criteria
0,00 < P < 0,30 Difficult
0,30 < P < 0,70 Middle
0,70 < P < 1,00 Easy
(Arikunto, 2013)
4. Discriminating Power
Discriminating power is an ability of question to discriminate
between high-achiever students and low-achiever students (Arikunto,
2013). Number that shows discriminating power is called as discriminant
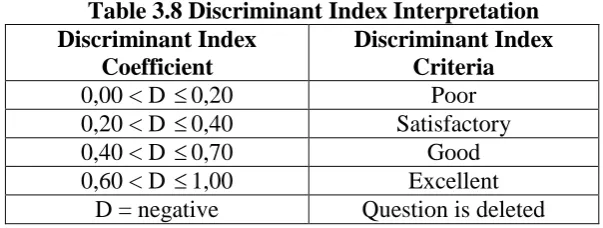
index (D). Discriminant index range is about 0,00 to 1,00. Good
questions will have discriminant index between 0,4 and 0,7 (Arikunto,
2013).
The formula of discriminant index is
D : Discriminating Power (Discriminant Index)
A
P : Proportion of upper group who answer question correctly
B
P : Proportion of lower group who answer question correctly
P is level difficulty
The discriminant index interpretation is represented below on Table
3.8.
Table 3.8 Discriminant Index Interpretation Discriminant Index
D = negative Question is deleted
(Arikunto, 2013)
5. Distractor
A good distractor can be defined when an option is chosen by almost
of students. Students think that the option is the best answer while it is
actually the wrong answer. Distractor which even is not chosen by students is actually bad, because it can not attract student’ mind to consider the option as the best answer (Arikunto, 2013).
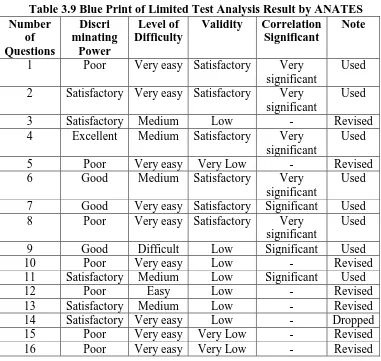
Due to the result of limited test, the reliability of test is 0,81. The
average score is 22,41. The number of question which is used directly in
research is 10 and the number of question which is revised based on
analysis of ANATES is 10. The blue print of limited test analysis result
by ANATES is shown below on Table 3.9.
Table 3.9 Blue Print of Limited Test Analysis Result by ANATES Number
2 Satisfactory Very easy Satisfactory Very
significant
Used
3 Satisfactory Medium Low - Revised
4 Excellent Medium Satisfactory Very
significant
7 Good Very easy Satisfactory Significant Used
8 Poor Very easy Satisfactory Very
significant
Used
9 Good Difficult Low Significant Used
10 Poor Very easy Low - Revised
11 Satisfactory Medium Low Significant Used
12 Poor Easy Low - Revised
13 Satisfactory Medium Low - Revised
14 Satisfactory Very easy Low - Dropped
15 Poor Very easy Very Low - Revised
Number
25 Satisfactory Very easy Satisfactory Very
significant
28 Excellent Medium Satisfactory Very
significant
post-test) and questionnaire based on CLES. The instrument which is used in
written test is multiple choice question while the instrument which is used to
get the profile of classroom learning environment is based on Constructivist
Learning Environment Survey (CLES). The blueprint of data collecting is
shown below on Table 3.10.
Table 3.10 The Blue Print of Collecting Data Dependent
Variable Data Source
discussion in
instruction Students’
Interview
G. Data Analysis Technique
Data analysis is done by calculating the score of pre-test and post-test of
students. The average of pre-test and post-test score is also calculated.
Another aspects that would be described on analysis pre-test and post-test
such as the highest and the lowest score, percentage of students who pass the
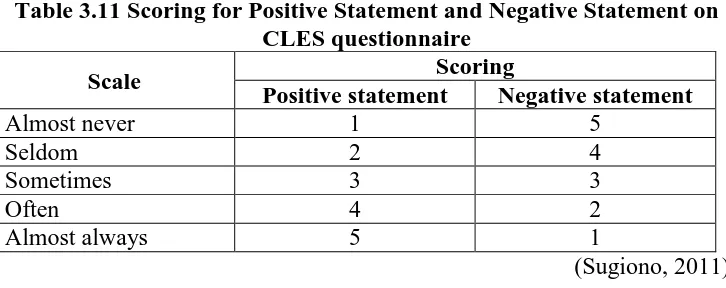
average score and cognitive level achievement that is achieved by students. Furthermore, questionnaire based on CLES’ results is analyzed by using summated rating, which is well-known as Likert Scale. Scoring on each
aspect on CLES is based on positive statement and negative statement stated.
Scoring for positive statement and negative statement is shown below on
Table 3.11.
Table 3.11 Scoring for Positive Statement and Negative Statement on CLES questionnaire
Scale Scoring
Positive statement Negative statement
Almost never 1 5
Seldom 2 4
Sometimes 3 3
Often 4 2
Almost always 5 1
(Sugiono, 2011)
Score of each aspect is gained based on the scoring above and it is
analyzed based on the average score of agreement level. The average score of
agreement level of each student defines the agreement level of each aspect as
a whole in this research. The average of agreement level is based on this scale
on Table 3.12 below.
Table 3.12 The Classification of Agreement Level Average Score Range of
Agreement Level Average
0-1 Almost Never
1,01-2 Seldom
2,01-3 Sometimes
3,01-4 Often
4,01-5 Almost Always
(Taylor and Fraser, 1991)
H. Research Procedure
In order to have a good sequence sistematically in this research, the
research procedure is arranged in three stages that should be done. Those
three stages are preparation stage, implementation stage, and completion
stage.
1. Preparation Stage
Preparation stage of this research includes,
a. Conducting study on characteristic of school, students, teacher, and
teaching method which will be the part of the research later. This is a
very initial step to look for the problem and gain the idea which will
be taken for the research.
b. Conducting literature study. It could be taken from various resources
such as book, journals, artcles, and etc.
c. Defining and analyzing a topic for research including variable.
d. Defining population and sample which will be used in the research.
e. Contacting the school and science teacher to ask the permission
letter for taking data and doing research at that school.
f. Constructing the instruments.
g. Judging all instruments such as objective test, questionnaire, and
interview sheet to the expert.
h. Revising the instruments based on expert’ suggestions.
i. Conducting limited test to 8 grade students.
j. Analyzing the results of limited test by ANATES.
k. Revising the instruments become a valid instrument which will be
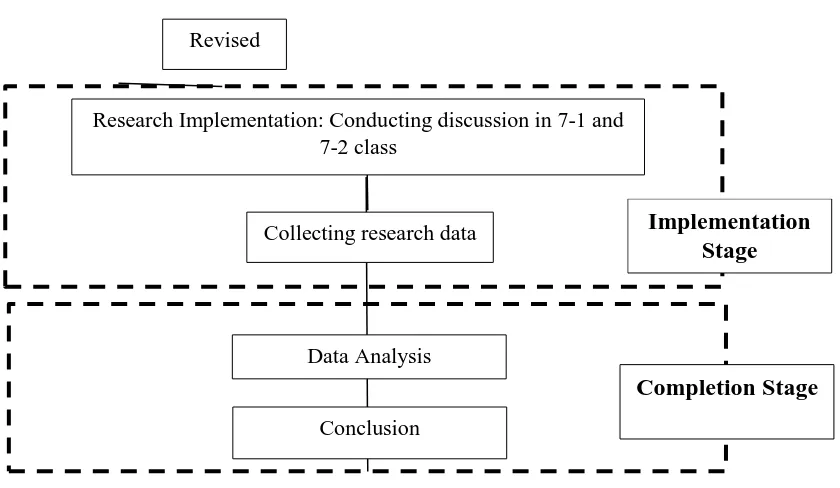
2. Implementation Stage
Implementation stage of this research includes,
a. Conducting research by giving pre-test and post-test after conducting
instruction using discussion method.
b. Recording current situation of classroom as learning environment in
the sample class.
c. Distributing questionnaire of classroom learning environment to the
students.
d. Having interview to students who joined discussion about the
process of discussion itself.
e. Research data is finally taken.
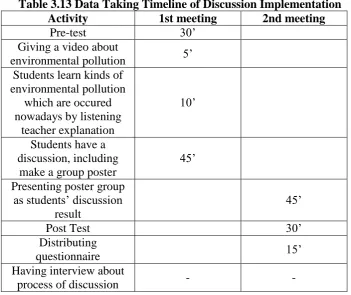
Data taking timeline which show how the research is implemented is
shown below on Table 3.13.
Table 3.13 Data Taking Timeline of Discussion Implementation
Activity 1st meeting 2nd meeting
Pre-test 30’
Giving a video about
environmental pollution 5’
Students learn kinds of environmental pollution
which are occured nowadays by listening
teacher explanation
10’
Students have a discussion, including
make a group poster
45’
Presenting poster group as students’ discussion
result
45’
Post Test 30’
Distributing
questionnaire 15’
Having interview about
3. Completion Stage
Completion stage of this research includes,
a. Analyzing research results such as objective test and questionnaire
result.
b. Discussing the research results based on related theoritical
foundation.
c. Consulting the research result with the lecture regarding to the
finishing of this research paper.
d. Drawing conclusion of research based on the research result,
discussion, and analysis.
e. Research paper is finally constructed.
4. Research Scheme
Preparation Stage
Analysis of 2013 Curriculum
Analysis all variable related
Questionnaire Objective
Test
Limited Test and Validation
Valid Invalid
Figure 3.1 Research Scheme
Revised
Research Implementation: Conducting discussion in 7-1 and 7-2 class
Implementation Stage
Collecting research data
Data Analysis
Conclusion