Dinda Delima Anindi, 2016
CONSTRUCTED INTERACTIVE ANIMATION AS A MEDIA TO MEASURE STUDENTS’ OLLABORATIVE PROBLEM SOLVING SKILLS AND IMPROVE STUDENTS’ UNDERSTANDING IN LEARNING
EARTHQUAKE
Universitas Pendidikan Indonesia | repository.upi.edu|perpustakaan.upi.edu
CHAPTER III
RESEARCH METHODOLOGY
A. Research Method and Research Design 1. Research Method
The research method that was used in this research was mixed method.
Mixed methods involves combining or integration of qualitative and
quantitative research and data in a research study. Qualitative data tends to
be open-ended without predetermined responses while quantitative data
usually includes closed-ended responses such as found on questionnaires
or psychological instruments (Creswell, 2014). This method is appropriate
with the purpose of the research which investigated that interactive animations constructions could measure student’s collaborative problem solving skills and improve students’ understanding in learning earthquake
topic.
2. Research Design
The design that was conducted in this research was pre-test and
post-test design (Creswell, 2012). The researcher assigns intact groups the
experimental, administers a pre-test to the group, conducts experimental
treatment activities with the experimental group only.
Table 3.1 Pre-test and Post-test Design
Select experimental
group
Pre-test Experimental
treatment Post-test
(Source: Creswell, 2012)
3. Population and Sample
The location of this research was in one of Public Junior High School
in Bandung. The population in this research was all 8th grade students at
one of Public Junior High School in Bandung. The samples were 8th grade
Dinda Delima Anindi, 2016
CONSTRUCTED INTERACTIVE ANIMATION AS A MEDIA TO MEASURE STUDENTS’ OLLABORATIVE PROBLEM SOLVING SKILLS AND IMPROVE STUDENTS’ UNDERSTANDING IN LEARNING
EARTHQUAKE
Universitas Pendidikan Indonesia | repository.upi.edu|perpustakaan.upi.edu
Simple Random Sampling with one class. Fraenkel and Wallen (2007)
stated that Simple Random Sampling is one obtained by using groups as
the sampling unit rather than individuals.
4. Operational Definition
a. Interactive animation
By the huge progress of technologies, nowadays multimedia
technology has cooperated well with education field to support educational
activity such as teaching and learning to be more attractive, informative
and interactive. Interactive animation could be made through several
application and software, such as Adobe Flash. Interactive animation
engages students to give feedback also to receive feedback on the
animation itself, through functions and content on the interactive
animation designed by the researcher. In this research, interactive
animation was created using FlashT M with save mode software, means that
the feedback given by students can be saved directly and will be converted into pdf, so that the analysis of students’ works will be easier.
b. Students’ Collaborative Problem Solving Skills.
As the innovative domain for PISA 2015, Collaborative Problem Solving (CPS) is defined in the draft framework as “the capacity of an individual to effectively engage in a process whereby two or more agents
attempt to solve a problem by sharing the understanding. The framework
identifies three core collaborative competences includes, 1) Establishing
and maintaining a shared understanding, 2) Taking appropriate action to
Dinda Delima Anindi, 2016
CONSTRUCTED INTERACTIVE ANIMATION AS A MEDIA TO MEASURE STUDENTS’ OLLABORATIVE PROBLEM SOLVING SKILLS AND IMPROVE STUDENTS’ UNDERSTANDING IN LEARNING
EARTHQUAKE
Universitas Pendidikan Indonesia | repository.upi.edu|perpustakaan.upi.edu
group during the process of playing interactive animation. Observation
sheet was also constructed based on the lesson plan and collaborative
problem solving syntax.
c. Students’ Understanding.
Anderson and Krathwohl, (2001) stated that understanding is defined
as Construct meaning from instructional messages, including oral, written,
and graphic communication.
Students’ understanding is indicated in the cognitive domain of knowledge, there are six cognitive domain based on Revised Bloom’s
Taxonomy such as C1 (Recalling), C2 (Understanding), C3 (Applying),
C4 (Analyzing), C5 (Evaluating), and C6 (Creating). In this research there
are four cognitive domain that will be assessed in the test instrument, they
are C1 (Recalling), C2 (Understanding), C3 (Applying), and C4
(Analyzing).
C1. Remembering : Retrieving relevant knowledge from long-
term memory.
C2. Understanding : Determining the meaning of instructional
messages, including oral, written, and graphic
communication.
C3. Applying : Carrying out or using a procedure in a given
situation.
C4. Analyzing : Breaking material into its constituent parts
and detecting how the parts relate to one
Dinda Delima Anindi, 2016
CONSTRUCTED INTERACTIVE ANIMATION AS A MEDIA TO MEASURE STUDENTS’ OLLABORATIVE PROBLEM SOLVING SKILLS AND IMPROVE STUDENTS’ UNDERSTANDING IN LEARNING
EARTHQUAKE
Universitas Pendidikan Indonesia | repository.upi.edu|perpustakaan.upi.edu
The improvement of students’ understanding was identified by T-test
instruments. There are 24 questions in the form of multiple choice with the
number of four options constructed related to earthquake topics were given
to the samples. Comparing the mean of Post-test scores with national
academic standard achievement (KKM) was done to investigate the students’ understanding improvements.
5. Assumption
a. Constructed interactive animation can measure students’
collaborative problem solving by facilitating a room to share students’ understanding within a group.
b. Employing constructed interactive animation can improve students’ understanding since it increases students’ enthusiasm in learning earthquake topic.
6. Hypothesis
H0: Constructed interactive animation cannot improve students’
understanding compared to academic standard achievement
(KKM) in learning earthquake.
H1: Constructed interactive animation can improve students’
understanding compared to academic standard achievement
(KKM) in learning earthquake.
7. Research Instrument
In this research, instrument is necessary to be used for gaining data. There are five types’ instruments that are used in this research which are constructed interactive animations, objective test (Pre-test
and Post-test Instrument), observation sheet, questionnaire, and
Collaborative Problem Solving Skills rubric form.
Dinda Delima Anindi, 2016
CONSTRUCTED INTERACTIVE ANIMATION AS A MEDIA TO MEASURE STUDENTS’ OLLABORATIVE PROBLEM SOLVING SKILLS AND IMPROVE STUDENTS’ UNDERSTANDING IN LEARNING
EARTHQUAKE
Universitas Pendidikan Indonesia | repository.upi.edu|perpustakaan.upi.edu
The objective test instrument is purposed to measure cognitive
process dimension based on Revised Bloom’s Taxonomy. Objective
test instrument consisted of 24 questions in the form of multiple
choice related to the earthquake phenomenon topic that contained 4
options of answers.
b. Objective Test Item Analysis
1) Validity
According to Fraenkel (2011) Validity refers to the
appropriateness, meaningful-ness, correctness, and usefulness of the
inferences a researcher makes. Validity is the most important idea to
consider when preparing or selecting an instrument for use.
Researchers want the information they obtain through the use of an
instrument to serve their purposes. Validation is the process of
collecting and analyzing evidence to support such inference.
To determine the validity of the instrument in this study is by
using software ANATES
The validity of each test item can be measured by using formula of
correlation which was stated by Pearson, which is usually called as
correlation formula, as follows:
√
Note:
r : correlation coefficient between x and y variable
n : amount of student
x : total score in test item
y : total score of student
Dinda Delima Anindi, 2016
CONSTRUCTED INTERACTIVE ANIMATION AS A MEDIA TO MEASURE STUDENTS’ OLLABORATIVE PROBLEM SOLVING SKILLS AND IMPROVE STUDENTS’ UNDERSTANDING IN LEARNING
EARTHQUAKE
Universitas Pendidikan Indonesia | repository.upi.edu|perpustakaan.upi.edu D =
рu –
рi
2) ReliabilityThe degree to which individuals’ deviation scores, or z-scores, remain relatively consistent over repeated administration of the same
test or alternate test forms.
The formula for calculating the reliability of a test. The formula is:
KR20 = r =
3) Difficulty level
According to Jandaghi (2010), when an item is dichotomously
scored, the mean item score corresponds to the proportion of
examinees who answer the item correctly. This proportion for item I is
usually denoted as Pi and is called the item difficulty.
The following formula for calculating the difficulty coefficient
(DifCo).
DifCoef question (i) =
(Jandaghi, 2010)
4) Discriminating Power
An index of how effectively the item discriminates between
examinees who are relatively high on the criterion of interest and those
who are relatively low. The index of discrimination (D) could be
Dinda Delima Anindi, 2016
CONSTRUCTED INTERACTIVE ANIMATION AS A MEDIA TO MEASURE STUDENTS’ OLLABORATIVE PROBLEM SOLVING SKILLS AND IMPROVE STUDENTS’ UNDERSTANDING IN LEARNING
EARTHQUAKE
Universitas Pendidikan Indonesia | repository.upi.edu|perpustakaan.upi.edu
D : Discriminating power
рu : The proportion in the upper group who answered the item correctly
рi : the proportion in the lower group who answered the item correctly.
Values of D may range from – 1 .00 to 1 .00. Positive values
indicate that the item discriminates in favor of the upper group;
negative values indicate that the item is a reverse discriminator,
favoring the lower-scoring group.
(Crocker and Algina, 2006)
5) Distractor
Distractor are incorrect alternative on a multiple choice item. A
distractor analysis allows to examine how many students in the top and
bottom groups selected each option on a multiple choice item. Based
on Sabri (2013), a distractor analysis assist in distinguishing plausible
distractors from implausible ones. A high percentage of 70% from the
total distractors were regarded as implausible due to the fact that those
distractors were selected neither by the top scorer nor the low score.
One item clearly indicates a confusing items seeing that one distractor
is selected by more students than the correct answer.
(Sabri, 2013)
In this study, the objective test instrument validity was measured
using Anates version 4.0 that was developed by Drs. Karnoto ,M.Pd
and Yudhi Wibisono, S.T. On Anatest version 4.0 all the formula or
coefficient required in the instrument validity and has been
automatically applied, so the user does not need to enter the formula
Dinda Delima Anindi, 2016
CONSTRUCTED INTERACTIVE ANIMATION AS A MEDIA TO MEASURE STUDENTS’ OLLABORATIVE PROBLEM SOLVING SKILLS AND IMPROVE STUDENTS’ UNDERSTANDING IN LEARNING
EARTHQUAKE
Universitas Pendidikan Indonesia | repository.upi.edu|perpustakaan.upi.edu
After obtaining the result of pre-test and post-test, the improvement of students’ understanding is analyzed by calculating the value of N -Gain. The way to calculate the value of N-Gain is using Normalized
Gain Equation. Based on Hake (1999) stated that score of Pre-test and
Post-test could be computed in the equation below:
<g> =
The value of N-Gain itself has a scale to be interpreted into criteria
started from Low to High, as table 3.2 below:
Table 3.2. Criteria of Normalized Gain
<g> Criteria
<g> ≥ 0.7 High
0.3 ≤ <g> < 0.7 Moderate
<g> < 0.3 Low
c. Observation Sheet
There were two forms of observation sheet, there are for students’
activities and teacher’s activities, this instrument is arranged based on
research lesson plan and the syntax of Collaborative problem solving.
1) Students Observation Sheet
The observation sheet which is shown in the table 3.2 contained the sequence of students’ activities based on research lesson plan which has been validated through judgment by experts in relevant field.
Students’ activities were planned in accordance with collaborative
Dinda Delima Anindi, 2016
CONSTRUCTED INTERACTIVE ANIMATION AS A MEDIA TO MEASURE STUDENTS’ OLLABORATIVE PROBLEM SOLVING SKILLS AND IMPROVE STUDENTS’ UNDERSTANDING IN LEARNING
EARTHQUAKE
Universitas Pendidikan Indonesia | repository.upi.edu|perpustakaan.upi.edu
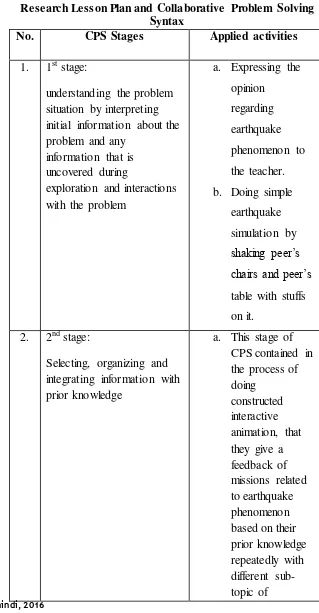
Table 3.3 Students’ Observation Sheet Instrument based on Research Lesson Plan and Collaborative Problem Solving
Syntax
No. CPS Stages Applied activities
1. 1st stage:
understanding the problem situation by interpreting initial information about the problem and any
information that is uncovered during
exploration and interactions with the problem
Dinda Delima Anindi, 2016
CONSTRUCTED INTERACTIVE ANIMATION AS A MEDIA TO MEASURE STUDENTS’ OLLABORATIVE PROBLEM SOLVING SKILLS AND IMPROVE STUDENTS’ UNDERSTANDING IN LEARNING
EARTHQUAKE
Universitas Pendidikan Indonesia | repository.upi.edu|perpustakaan.upi.edu
No. CPS Stages Applied activities
missions. reflecting on possible solutions and critical assumptions
a. Giving attention to the teacher’s
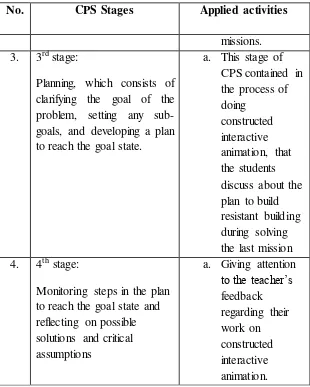
2) Teacher Observation Sheet
The researcher who acted as the facilitator should give a
systematical instruction and guidance toward the students which was
observed and evaluated using the observation sheet shown in Table 3.4
as follow:
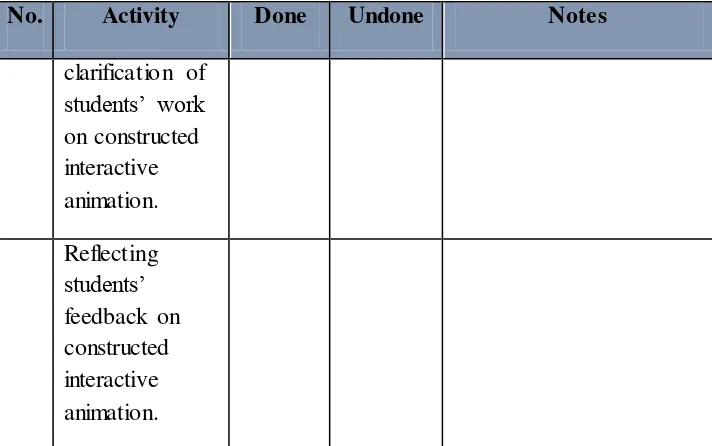
Table 3.4 Teacher’s Observation Sheet based on Research Lesson Plan
No. Activity Done Undone Notes
Dinda Delima Anindi, 2016
CONSTRUCTED INTERACTIVE ANIMATION AS A MEDIA TO MEASURE STUDENTS’ OLLABORATIVE PROBLEM SOLVING SKILLS AND IMPROVE STUDENTS’ UNDERSTANDING IN LEARNING
EARTHQUAKE
Universitas Pendidikan Indonesia | repository.upi.edu|perpustakaan.upi.edu
No. Activity Done Undone Notes
for students.
2 Gaining students’ attention by asking about their opinion and experience of earthquake phenomena.
3 Guiding the students to open-ended questions about the frequent problems found in earthquake phenomena.
5 Controlling and guiding the students to finish the constructed interactive animation.
6 Evaluating students’ collaborative problem solving skills using valid CPS skills indicator.
Dinda Delima Anindi, 2016
CONSTRUCTED INTERACTIVE ANIMATION AS A MEDIA TO MEASURE STUDENTS’ OLLABORATIVE PROBLEM SOLVING SKILLS AND IMPROVE STUDENTS’ UNDERSTANDING IN LEARNING
EARTHQUAKE
Universitas Pendidikan Indonesia | repository.upi.edu|perpustakaan.upi.edu
No. Activity Done Undone Notes
3) Collaborative Problem Solving Skills Indicators
This research aimed to carry out students’ collaborative problem solving skills through constructed interactive animation in learning
earthquake. Therefore, a valid collaborative problem solving skills
indicators are important to be involved in measuring students’
collaborative problem solving skills which is shown in the Table 3.5
below:
Table 3.5. Collaborative problem solving skills Indicators according to Program for International Student Assessment
(2015) abilities of team members
Dinda Delima Anindi, 2016
CONSTRUCTED INTERACTIVE ANIMATION AS A MEDIA TO MEASURE STUDENTS’ OLLABORATIVE PROBLEM SOLVING SKILLS AND IMPROVE STUDENTS’ UNDERSTANDING IN LEARNING
EARTHQUAKE
Universitas Pendidikan Indonesia | repository.upi.edu|perpustakaan.upi.edu
(1) Establishing
(B2) Identifying and
describing tasks to be
completed
(B3) Describing roles and team
(C2) Enacting plans (C3) Following rules of engagement
(D) Monitoring
and Reflecting
(D1) Monitoring and
repairing the shared understanding
(D2) Monitoring results of actions and evaluating success in solving the problem
(D3) Monitoring, providing feedback and adapting the team organization and roles
(PISA, 2015)
8. Research Procedure a. Preparation Stage
1) Finding students learning problem in certain topic;
2) Investigating students learning problem;
3) Determine the specific topics to do the experiment;
4) Conducting literature review regarding independent and
dependent variable of experiment;
5) Determining possible school and classes for choosing
population and sample;
6) Formulating hypothesis of experiment;
7) Designing research instrument for pre-test, post-test,
Implementation and assessment;
8) Conducting proposal research revision after receiving
Dinda Delima Anindi, 2016
CONSTRUCTED INTERACTIVE ANIMATION AS A MEDIA TO MEASURE STUDENTS’ OLLABORATIVE PROBLEM SOLVING SKILLS AND IMPROVE STUDENTS’ UNDERSTANDING IN LEARNING
EARTHQUAKE
Universitas Pendidikan Indonesia | repository.upi.edu|perpustakaan.upi.edu
9) Constructing Research Instrument tools such as flash
animation, lesson plan, observation sheet, collaborative
problem solving skills indicator, and objective test;
10) Revising research instruments after receiving suggestions from
supervisors.
11)Validity, reliability, difficulty level, discriminating power,
distractor test of objective test Instrument using Ana test
version 4.0 and expert judgment.
12)Validity test of flash animation, lesson plan, observation sheet,
collaborative problem solving skills indicator through expert
judgment.
13)Revising research instruments after receiving suggestions from
the experts.
b. Implementation Stage
1) Conducting Pre-test of earth topic both in control and
experimental group/ class
2) Giving an introduction to earthquake phenomena in
experimental class by giving the students experience of earth
quake simulation in class.
3) Experiment treatment (Implementing animations constructions
through scientific problem in learning earthquake).
4) Recording the data of experiment
5) Conducting Post-test of earth topic in experimental group/
class.
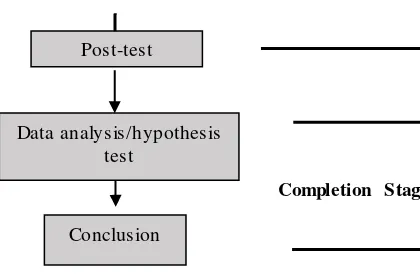
c. Completion Stage
1) Analyzing the data of experiment statistically
2) Constructing table of result
3) Conducting test of hypothesis
Dinda Delima Anindi, 2016
CONSTRUCTED INTERACTIVE ANIMATION AS A MEDIA TO MEASURE STUDENTS’ OLLABORATIVE PROBLEM SOLVING SKILLS AND IMPROVE STUDENTS’ UNDERSTANDING IN LEARNING
EARTHQUAKE
Universitas Pendidikan Indonesia | repository.upi.edu|perpustakaan.upi.edu 5) Constructing conclusion of experiment.
Investigating Learning
problems and educational skill needs
Determining the earthquake phenomena topic
Determining Media and Variables
Literature review of Interactive Animation, Collaborative
Problem Solving, and understanding
Pre-test
Interactive animations constructions to measure CPS in learning
earthquake. Determining sample and
population
Designing hypothesis
Constructing research instrument
Implementati on Stage Preparation stage
Experimental Group
Test item analysis/Instrumen
Dinda Delima Anindi, 2016
CONSTRUCTED INTERACTIVE ANIMATION AS A MEDIA TO MEASURE STUDENTS’ OLLABORATIVE PROBLEM SOLVING SKILLS AND IMPROVE STUDENTS’ UNDERSTANDING IN LEARNING
EARTHQUAKE
Universitas Pendidikan Indonesia | repository.upi.edu|perpustakaan.upi.edu
Figure 3.1 Research Flowchart. Post-test
Data analysis/hypothesis test
Conclusion