CHAPTER III
METHODOLOGY
This chapter consists of research method and design, population and sample,
operational definition, research instrument, instrument validation result, data analysis,
and research procedure.
1. Research Method and Design
The research method that is used is an Experimental Method. The
experimental method involves manipulating one variable to determine if changes
in one variable cause changes in another variable. This method relies on
controlled methods, random assignment and the manipulation of variable to test a
hypothesis
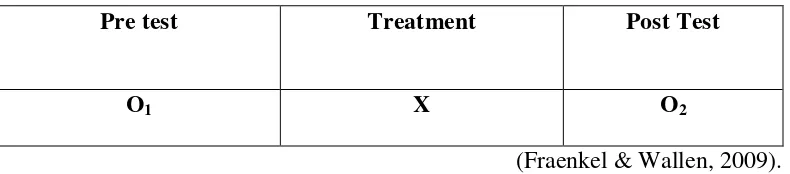
One group post-test pre-test design defined as a single group that is measured
or observed not only after being exposed to a treatment of some sort, but also
before (Fraenkel & Wallen, 2009). A diagram of this design is as follows:
Table 3.1 One-group post-test pre-test Design
Pre test Treatment Post Test
O1 X O2
(Fraenkel & Wallen, 2009).
O1 is a test before learning activity and O2 is a test after learning. X is a form of
learning that treatments using models Problem based Learning with multiple
representations approach.
2. Location and Sample
The location of this research at National Junior High School in Bandung
which is one of National Secondary High School in Bandung, West Java.
The school uses bilingual as the main language in the teaching learning
process.
2. Population of Research
The population was taken is class of Secondary I Ibnu Rusyd, at that
National School. The sampling technique that was a purposive sampling
because Secondary I Ibnu Rusyd is despite it is the only class that available
to be intake in the research. It was due to the class has a high focus on
learning. There are 26 students as a sample of this research.
3. Assumption
The assumption as the foundation of this study as follow:
1. Problem based learning model with multiple representation approach enables
student to learn diverse representations to solve the physics problem
2. Problem based learning model with multiple representation helps student to
used to multiple representation in learning process. In this case, teacher train
and trigger students to learn various multiple representations.
3. Problem based learning model with multiple representation will become
precious assessment to enhance scientific consistency because using this
treatment, teacher know well students’ capability in teaching learning process
as well verbally, picture, and mathematically.
4. Hypothesis
Hypothesis that is tested in this study are as follow:
1. H0 : There is no difference of students’ scientific consistency in learning heat
transfer concept using problem based learning model with multiple
2. H1 : There is difference of students’ scientific consistency in learning heat
transfer concept using problem based learning model with multiple
representations approach
1. Operational Definition
In order to avoid misconception about this research, so some operational
definitions are explained in this research. Those terminologies are explained as
follows:
1. Problem Based Learning model with multiple representation approach means
learning to solve the problem with diverse .The application use of this model,
expected to be investigating students’ scientific consistency. By learning
activities PBM performed consists of five phases, namely: 1) Provide an
orientation about the problem to the learners, 2) Organize learners to research,
3) Helping the investigation independently and groups, 4) Develop and
present their work and 5) Analyze and evaluate the process of overcoming the
problem. At each phase is done multiple representation approach.
2. Scientific Consistency is the consistency of students' ability to answer
correctly scientifically on the same concept, in the form of different
representations. Multiple representation based scientific consistency identified
through students' answers during the test multiple representations. Students
categorized scientific consistency if the three inputs (verbal, mathematical and
picture) are in the category of understanding the concept. Category understand
the concept of meaning, the student answered correctly on a given third
representative, Then the pretest and posttest data results expressed with the
normalize gain, to identify the enhancement of students’ scientific
1. Research Instrument
In this research, instrument is necessary to be used for gaining data. There is
one type instrument that is used in this research; it is multiple representations
test in multiple choice forms. The instrument is described below.
1. Multiple representation test
Multiple representation test to measure scientific consistency
understanding of students, carried out by giving 45 about multiple
representation (verbal, picture, and mathematical) test that consists of five
concepts such as conduction, convection, radiation, sea breeze, and land
breeze. The multiple representation test is formed in multiple choice
questions. This test aims to analyze the scientific consistency student.
Instruments for research, tested in advance to students who have earned a
heat transfer material. Instruments test of scientific consistency with multi
representations made only once trial
The multiple representations test is formed in multiple choice questions.
This instrument is tested through several statistical test which common use
to test the research instrument.
The statistical test have to be tested consist of in terms of validity,
reliability, difficulty level, discriminating power, and distractor. It will be
explained as follows.
1. Validity
Validity is defined as the extent to which the instrument measures what
is designed to measure that emphasizes not on the test itself, but on the result
(Arikunto, 2013). Construct Validity is considered to be used in this study
since the questions will be formulated based on the level cognitive of
Taxonomy Bloom. Arikunto (2013) stated that construct validity measures
cognitive dimension. The formula to determine the validity is below
(Arikunto, 2013).
rxy=
√ ………. (1)
Where:
rxy = coefficientcorrelation or item validity
ƩX = sum of total score of all students for each question item ƩY = sum of total score of all students for whole test
N = total number of students
X = score of each student for each question item
Y = total score of each student
The validity interpretation is represented in the table below.
Table 3.2 Interpretation of Validity
observation or any measurement procedure produces the same results on
repeated trials. In short, it is the stability or consistency of scores over
time or across raters (Arikunto, 2013). The split-half method using KR 20
equation is used to calculate reliability of the test by giving score one
point for correct answer and zero point for wrong answer. The formula of
reliability is described below (Arikunto, 2013).
Where:
r11 = instrument reliability
k = the amount of test item
Ʃpq = multiplication result of p and q s = deviation standard
The reliability interpretation is represented in the table below.
Table 3.3 Interpretation of Reliability
No. Reliability Coefficient Criteria
1 0.00 r 0.20 Very Low
questions, since easy questions will not stimulate students to spend more
effort in answering as well as difficult questions will make the students
desperate and have no motivation to solve it (Arikunto, 2013).
Consideration of difficulty level is based on proportion of problem
categories such as easy, medium, and difficult. The formula to determine
the difficulty level is described below (Arikunto, 2013).
P = ………. (3)
Where:
P = difficulty level
B = number of students who answer correctly
N = total number of students
The classification of difficulty level is represented in the table
Table 3.4 Interpretation of Difficulty Level
No. Difficulty Value Criteria
1 0.00 – 0.30 Difficult
2 0.30 – 0.70 Medium
3 0.70 – 1.00 Easy
(Arikunto, 2013)
4. Discriminating Power
Discriminating power is defined as the ability of particular question
to distinguish students who are classified as higher achievement and
lower achievement. The amount of higher achievement students who can
answer more particular questions compared to lower achievement means
that those questions have positive discriminating power index (Arikunto,
2013). Discriminating power index shows the scale from minus one until
positive one. The negative one represents lower discriminating power
index, and vice versa. The formula to determine the discriminating power
is described below (Rustaman in Maulidah, 2015).
DP = ……… (4)
Where:
DP = Discriminating Power
U = the number of upper group that answer correctly
T = total number of students in upper and lower group
L = the number of lower group that answer correctly
The Interpretation of discriminating power is represented in the
Table 3.5 Interpretation of Discriminating Power
No. Discriminating Power Value Criteria
1 Negative-0.00 Very Poor
determine the distractor of each item of multiple choice which is not work
well to distract the students from answering the questions correctly. The
distractor is considered as a good distractor when it can attract the attention of unwell prepared students’ in the test to be chosen, it is chosen by at least 5% of the students. Meanwhile, a distractor is considered as a
bad distractor when it is not chosen by any student, it means the
distractor is clearly wrong. Hence, even the students who are not
mastering the concept will believe that the distractor is totally wrong
choice. A distractor can be treated with three ways i.e. accepted, rejected,
and rewrite (Arikunto, 2013).
1. Instrument Validation Result
Before using the objective test as the instrument in the research, it needs to
be tested in terms of validity, reliability, discriminating power, and difficulty
level as explained before. To obtain the data for testing those aspects, limited test
need to be done. The test was given to 20 students which have learned about the
chapter that will be learned for the research. The limited test consists of 45
from the limited test was analyzed by Software Anatest 4.0. The content
validation is very good that analyzed from expert judgement. The reliability of
the test item is 0.63 with the interpretation high.
On multiple representations test instrument consists of 45 questions
consisting of five concept of heat transfer. All matter in the form of multiple
representations consisting of verbal, images and mathematically. Although some
questions were on the validity and distinguishing low, matter is not disposed. It is
due to the questions required for the purposes of research and has sufficient
validity questions.
The instrument from limited test that should be revised is not totally
changes the questions. The reason the instrument will be used is not only based
on anatest but also from judger recommendations.
2. Data Analysis of Scientific Consistency
Researcher adapted the technical scoring of scientific inquiry from Nieminen
(2010), he made the categorize of scientific consistency which students’ answer
in a given theme were graded in the following way on Table 2.3
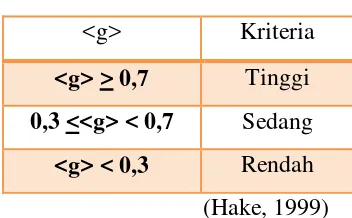
After that, calculated the enhancement of scientific consistency in pretest and
posttest results using normalized gain equation. Based on Hake (1999) stated the
score of pre-test and post test could be computed in the equation bellow
<g>=
Then interpreted into a normalized gain of criteria such as the table 3.7
Table 3.6 Criteria of Normalized Gain
<g> Kriteria
<g> > 0,7 Tinggi
0,3 <<g> < 0,7 Sedang
<g> < 0,3 Rendah
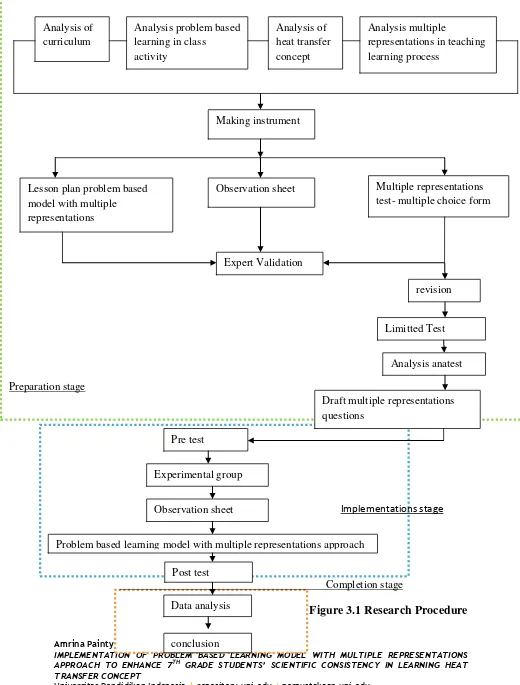
3. Research Procedure
1. Preparation Stage
The preparation stage of this study consist of analysis every variable
related to this study and instrument making. For analysis variables related to
this study consists of:
1. 2013 Curriculum as National Curriculum of Indonesia
2. multiple representations in teaching learning process
3. Problem Based Learning when teaching learning activity
4. Concept of heat transfer
For instrument making, this study will use several kinds of
instruments i.e. draft of multiple representations in multiple choice form,
lesson plan of Problem Based Learning with Multiple Representations
Approach, and worksheet, observation sheet
A draft of multiple representations in multiple choice form will be
acquired through the process of expert validation, revision, limited test, and
analysis by anatest. Meanwhile a draft of lesson plan, worksheet, and
observation sheet will be acquired through the process of consult to expert
judgement then revision.
5. Implementation Stage
The implementation stage of this study will be described as follows.
1. Giving the pre test
2. Conducting the learning process using problem based learning with
multiple representations approach
4. Completion Stage
The completion stage of this study consists of data analysis and
drawing the conclusion. Analyze the improvement of scientific consistency
of the students in problem solving then conclude the result of the study ;there
Preparation stage
Implementations stage
Completion stage
Figure 3.1 Research Procedure
activity concept learning process
Making instrument
Lesson plan problem based model with multiple representations
Multiple representations test- multiple choice form Observation sheet
Expert Validation
revision
Limitted Test
Analysis anatest
Draft multiple representations questions
Pre test
Experimental group
Problem based learning model with multiple representations approach
Post test