SCIENTIFIC PLANNING AND SUPPORT INITIATIVE FOR
LABORATORY INTENSIVE BUILDING: A CASE STUDY IN SINGAPORE
LAMANO, Adrian1*, ZHOU Jian1, SESHADRI, Bharath2, BABU, Sushanth1, PAWAR, Priya1, WU, Xiaoying3
1 Energy Research Institute @ Nanyang Technological University (ERI@N), 1
CleanTech Loop, #06-04, CleanTech One, Singapore 637141
2Institute of Technology in Architecture, ETH Zurich, Switzerland 3School of Architecture, Tsinghua University, Beijing, P.R. China
*Corresponding author: [email protected]
ABSTRACT
This paper presents a case study of new multi-tenanted laboratory intensive building in Singapore with the target of energy savings at least 40% better than equivalent code-compliant building and surpasses Building Construction and Authority‟s Green Mark Platinum building rating system. Scientific Planning and Support initiative was applied to this building to explore energy efficient strategies. Design charrette was conducted during initial stage to identify feasible, potential and cost-effective measures. Building stakeholders were actively involved throughout the design process, construction and operation to ensure the target can be achieved. Detailed modelling and simulation were performed throughout the design process to verify the proposed strategies. In addition, metering studies were carried out to benchmark office and lab plug load, while measurement study was conducted to verify energy savings through actual implementation device. The total building energy consumption is expected to reduce 44% compared to a code-compliant building on a yearly basis, being the first case study to demonstrate more than 40% energy savings in Singapore. This approach is proven to be the most effective solution to design and build a high performance lab building. It is hoped that the approach and energy efficient measures from this study could be replicable for other high performance building.
Keywords: Building rating system; building simulation; energy savings; high performance building; laboratory intensive
building.
INTRODUCTION
In Singapore, building sectors consumes nearly 31% of total electricity use (Chua et al., 2013). This makes it necessitates improving the energy
effi-ciency of the nation‟s built environment by reducing
their electricity consumption. The building and design communities in Singapore have responded to this issue by going towards sustainable-energy buildings. Nanyang Technological University (NTU) campus, being the largest university campus grounds in Singapore, also strongly supports this movement by emphasizing sustainability and energy efficient efforts throughout the entire campus.
Research universities have large carbon foot-prints because laboratories are energy-intensive space that typically constitutes two-thirds of the utilities consumed by such institutions (Gomez & Sun, 2013). Laboratory consumes 3 to 4 times more energy per floor area compared to office buildings on a square meter basis (Hopkinson et al., 2011). In some laboratories, such as clean rooms and labs with large process loads, they can consume as much as 100 times the energy of a similarly sized institutional or commercial structure (Labs21, 2008). This huge energy consumption is due to the use of 100 percent
outside air ventilation with no recirculation of return air (Gomez & Sun, 2013) and high air change rate between 8 and 10 ACH in order to meet the aggressive exhaust requirements of fume hoods (Labs21, 2008). Given these facts, energy efficiency was defined as a primary goal when designing NTU‟s
new laboratory intensive building. NTU‟s Office of
Development and Facilities Management (ODFM) as the building owner decided to engage researcher team at Energy Research Institute at NTU (ERIAN) to explore and analyse energy efficient strategies to meet the energy savings target of at least 40% better than equivalent code-compliant building. This building also envisioned to achieve above and beyond
Building Construction and Authority‟s (BCA) Green
Mark (GM) Platinum building rating system based on GM Criteria for Non-Residential Buildings Version 4.1.
NORTH SPINE ACADEMIC BUILDING (NSAB): THE CASE STUDY
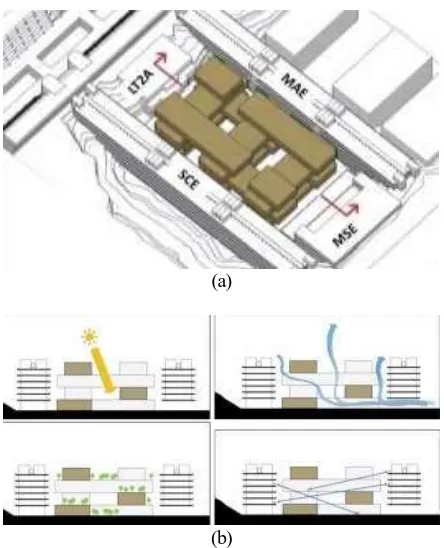
environment, which integrates a new built form into the existing environment with a strong focus on environmental sustainability. NSAB consists of seven-story academic buildings with 70% of the occupied spaces allocated for research laboratories and the remaining allocated for office spaces. The main research activities are laboratory in fields such as biology, chemistry, biochemistry, and physical teaching. NSAB is being closely surrounded by 4 existing buildings, as shown in Fig. 1 (a). The key design considerations of NSAB include harnessing and optimizing natural lighting and ventilation through the manipulation of building mass and improving connectivity on both macro and micro scales, resulting in a porous building with lush green internal courtyards, as shown in Fig. 1 (b).
(a)
(b)
Fig. 1. (a) NSAB surrounded in between the 4 existing
blocks of NTU; (b) „Porous‟ building design in NSAB
Scientific Planning and Support Initiative for NSAB
Sustainable building design can most effectively be achieved through an integrated design process. This process is a multidisciplinary strategy that integrates all aspects of site development, building design, construction, and operations and maintenance to minimize a building‟s resource consumption and environmental impact while improving the comfort, health, and productivity of building occupants (ERIAN, 2013).
Scientific Planning and Support (SPS) initiative is an integrated design process that facilitates better communication, collaboration and planning amongst all building stakeholders with scientific studies and reviews to support technology selection and system decisions in design, and rigorous simulation and analysis to assess the benefits and performance implications of the decisions. In this project, the objective of SPS is to define, develop and validate a highly innovative energy, water and waste management concept for NSAB to surpass GM Platinum building rating system. This approach is also hoped to save money in upfront capital cost, energy and operating costs, cut down on expensive repairs over the lifetime of the building, and reduce tenant turnover (ERIAN, 2013).
The methodology of SPS can be described below:
Establish Key Performance Indicators (KPIs) by
reviewing the building‟s energy parameters and
compare performances of other landmark green buildings. The targets of these KPIs are to surpass the BCA Green Mark Platinum Plus standard and translate them into the design brief.
Determine optimal combination of passive tech-nologies (e.g. building façade techtech-nologies, shading, natural ventilation) and active techno-logies (e.g. innovative cooling and ventilation systems, building information management and intelligent building control application, building integrated renewable sources of energy).
Employ accurate building modeling practices using thorough data screening and collection (e .g. building geometry, weather data, construction materials, internal loads and operational sche-dules) in combination with Accurate Air-Conditioning and Mechanical Ventilation (ACMV) system modeling (e.g. cooling, de- humidification, ventilation, control and energy management).
Employ accurate building simulation to predict annual energy consumption with the help of energy simulation software, in combination with accurate day lighting and shading simulation, airflow simulation for natural ventilation using Computational Fluid Dynamics (CFD), and life cycle analyses for the applied technologies and systems.
SPS relied on extensive planning, modeling and
simulation practices, to minimize a building‟s
resource consumption and its environmental impact
without compromising the user‟s safety. This
approach shall be an iterative process throughout the project to optimize building design until design strategies is being finalized. The overall SPS applied in this project can be illustrated by Fig. 2.
Fig. 2. SPS initiative for NSAB
Design Charrette
The design process starts with a design charrette by engaging a diverse set of stakeholders, relevant experts, and users of the facility to develop key project values and recommendations of energy efficient design strategies. Approximately 44 individuals were involved in this charrette as shown in Figure 3.The main goal of this charrette was to identify feasible, potential, and cost-effective sustainable measures that NSAB could implement The charrette provides an effective means to engage a wide diversity of participants in an intensive and focused brainstorming
session to achieve the goals of a “high performance, innovative and iconic living lab” building (ERIAN,
2013).
Fig. 3. The charrette involved about 44 individuals
participated from various backgrounds and fields.
This charrette resulted in good communication among project team members and the development of unified design and construction goals and values for everyone to work toward. It was a common consent that for a sustainable building project, the project team must consider how the building design and interior
function can affect the building‟s overall energy
consumption and have a positive environmental impact in the long run. Through the follow up discussions during charrette, the stakeholders of NSAB have agreed on the recommended energy efficient strategies as summarized in Table 1 and also defined the list of action items and timeline for next steps such as modeling and simulation.
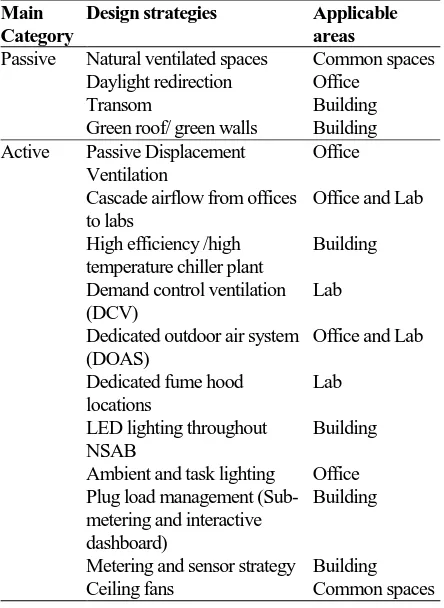
Table 1. Main Strategies from Design Charrette (Zhou et
al, 2015)
Main Category
Design strategies Applicable areas
Passive Natural ventilated spaces Common spaces Daylight redirection Office
Transom Building
Green roof/ green walls Building Active Passive Displacement
Ventilation
Office
Cascade airflow from offices to labs
Office and Lab
High efficiency /high temperature chiller plant
Building
Demand control ventilation (DCV)
Lab
Dedicated outdoor air system (DOAS)
Office and Lab
Dedicated fume hood locations
Lab
LED lighting throughout NSAB
Building
Ambient and task lighting Office Plug load management (Sub-metering and interactive dashboard)
Building
Metering and sensor strategy Building Ceiling fans Common spaces
Design development
In this stage, the SPS team has been working closely with various building stakeholders to review strategies for the NSAB building while meeting the
goals of KPI‟s as well as surpasses GM Platinum
Standard.
Modeling and Simulation
modell-ing and simulation practices usmodell-ing suggested design scenarios from the design charrette to assess their innovative technology/system performances and verify their energy savings potential. These iterative processes were started at the initial stages of the design phase with analysis results provided to all the building stakeholders throughout the design process, include Computational Fluid Dynamic (CFD) simula-tion, solar/daylighting simulation and energy model-ing.
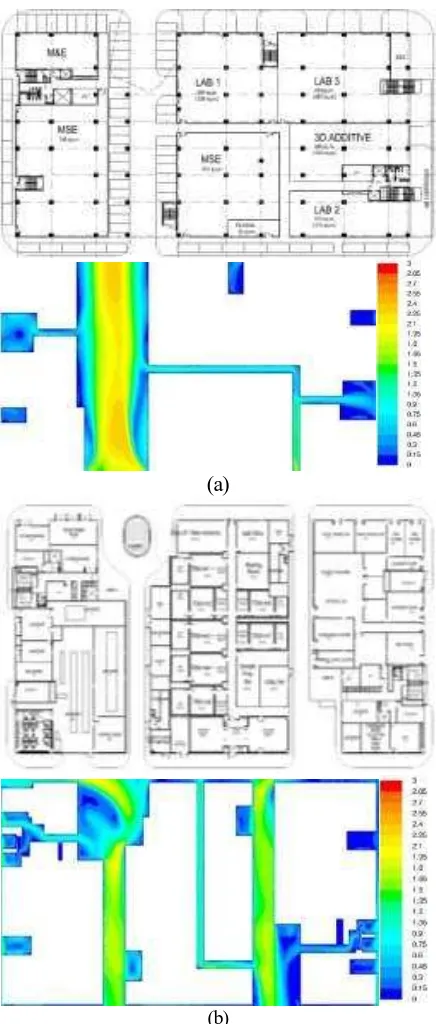
Introducing more natural ventilation was one of the main strategies from design charrette with aim to reduce the cooling load and associated energy consumption. ANSYS Fluent and Gambit were used to study the natural ventilation in the common spaces. This simulation helped to identify the most effective building layout to satisfy thermal comfort requirement in common spaces area. The analysis resulted in a recommendation to redesign the initial B4 block layout (Fig. 4 (a)) for better natural ventilation. As shown in Fig. 4 (b), the natural ventilation on the shaded corridors, staircases, toilets, and other com-mon spaces was improved from this recommendation.
Autodesk ECOTECT 2011 and Desktop Radiance 1.0 were used to perform solar and daylighting analysis. The analysis result showed a very small daylight harvest opportunities for the indoor spaces as a result of low WWR imple-mentation to minimize ETTV in NSAB. The atrium, internal corridors and staircase area benefit immen-sely from the porous building and receive adequate level of daylight through the specified period of operational schedule of the building. In shaded corridor spaces, luminance sensors are implemented to activate electrical lighting systems to supplement daylight. The analysis also resulted in recommen-dation of photovoltaic canopy to mitigate to direct solar radiation in atrium area while generating solar energy for the building.
Energy Plus 8.0 simulation was used to predict the annual building energy consumption under different scenarios and furthermore optimize building system performance. Two whole-building models were developed, including a code-compliant building (BCA Green Mark Version 4.1., 2012) (SS 530, 2006) (SS 553 (2009), serves as baseline model and energy efficiency measures were applied to the proposed design to determine energy savings com-pared to the baseline. The simulation results can help to facilitate the decision making process and giving quantitative results for the other building stakeholders to consider. The building cooling demand was exported from the EnergyPlus 8.0 simulation and as a
result the chiller plant‟s cooling efficiency and overall
performance were calculated. 3x550RT chillers and 2x275RT chillers are used to provide chilled water to NSAB and two other buildings in NTU campus (Seshadri et al, 2015).
The chiller plant system was simulated in TRNSYS 17 to understand the energy efficiency performance and the ability of the plant to match the load demands of NSAB and the remaining buildings. Fig. 5 shows modelling schematic of the chiller plant which shows the chilled and condenser water loops.
(a)
(b)
Fig. 4. (a) Initial block design-level B4 and its velocity
Fig. 5. Chiller plant energy modelling file in TRNSYS.
Measurement and Verification
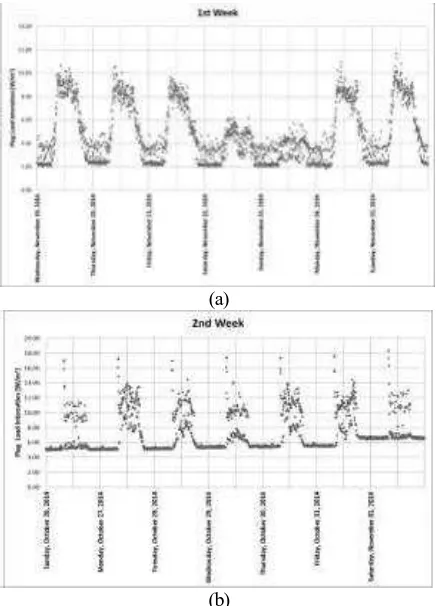
Metering studies were carried out to benchmark office and lab plug load, while measurement study was conducted to verify energy savings through actual implementation device. The heat gain (and the corresponding building cooling demand) from plug load directly impacts the cooling system design, sizing and costs (Wilkins and Hosni, 2011). 5-minute sampling interval data was collected for ten typical general offices and research offices in NTU campus over a 6 month period to measure the plug load intensities. Fig. 6 (a) and (b) shows one-week plug load profile in a typical general office and a typical research office. Except from outliers, peak plug load intensities in all metered offices range from 7.19 to 10.17 W/m2 and 11 W/m2 could be proposed to benchmark the peak plug load intensities for offices on NTU campus (ERIAN, 2015). This value is well below common design assumptions of peak plug load intensity of 16 W/m2 for general office areas recommended by BCA (BCA Green Mark Version 4.1., 2012), yet still complies well with ASHRAE standard of 10.8 W/m2 for medium load density office (ASHRAE, 2009) and other international standards.
Designers are often overestimated equipment loads in laboratories assuming its high demand. This result in oversized HVAC systems, increased initial construction costs, and increased energy use due to inefficiencies at low part-load operation. The value of 250 W/m2 was often used to represent lab plug load in Singapore, yet this value is still greater than other benchmarking study (Labs21, 2015). Lab plug load benchmarking study was conducted on plug loads in typical lab spaces in NTU campus to validate appropriate values to use in NSAB. SPS team
collected data 3 chemical labs and equipment inventory was gathered from 2 MSE labs and 1 computer labs in NTU campus. Fig. 7 shows the measured data compared over Labs21 benchmarking. The results shows that laboratory plug load intensity varies across different lab types and 75 W/m2 could be proposed to benchmark the peak plug load intensities for lab on NTU campus simulation.
Fume hoods are high energy consumers in laboratories due to its high ventilation rate require-ment (Marian JS, 2009). An occupancy-based sash device for fume hood was installed in a test lab at
NTU‟s campus to verify its energy saving.
(a)
(b)
Fig. 6. (a) Plug load profile for a typical general office; (b)
typical research office.
Fig. 7. Laboratory plug load intensity benchmarking for
This device will automatically lower the fume cupboard sash when not in use hence it can reduce on the volume of laboratory air that needs to be cooled, and reduces the amount of energy used by the air extraction systems. Metering studies were conducted on the fume hoods for 1 month with and without the control device. Fig. 8 shows one-week metering data with the results of 28.5% of fan energy savings due to implementation of automatic sash control device.
Fig. 8. Fan energy use of fume hood with and without
automatic sash control device (Seshadri et al, 2015)
SPS team has worked closely with all building stakeholders to help building owner make right decisions based on a thorough understanding of system performance, implementation, cost and maintenance. These simulation results have helped
the building owner to confirm and validate the energy performance targets to determine the final design strategies.
RESULT
Energy-efficient Features
Passive Design Features
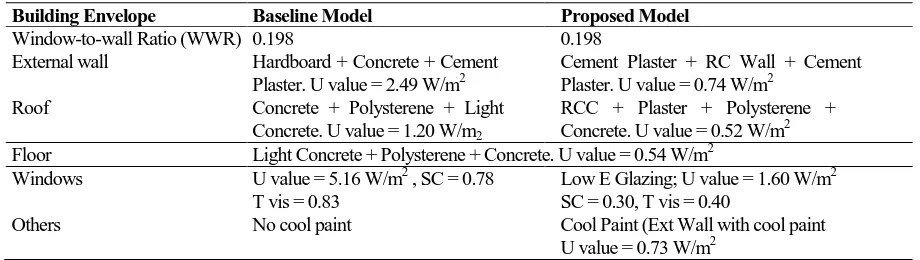
SPS team proposed to reduce building external cooling load by using excellent insulation materials and optimum wall material. Another strategy is to minimize overall window-to-wall ratio (WWR) with Double Glazed Unit (DGU) window, for this is a lab-intensive building and less desire for daylighting. With the proposed design strategies shown in Table 2, energy simulation result shows lower energy con-sumption with lower Envelope Thermal Transfer Value (ETTV). The final ETTV of NSAB can achieve 18.33 W/m2, while the baseline model remains 50 W/m2as per Green Mark‟s requirement. High albedo paint has been applied to the external facade of the building to reduce the indirect heat gain into the building that further down reduce U-value of the wall. Extensive greenery has been implemented to this building, resulting in GnPR value of 3.82. This inclusion of greenery shall reduce solar and heat gain in NSAB.
Table 2. Comparison of building construction of baseline and proposed model (Pawar et al, 2016)
Building Envelope Baseline Model Proposed Model
Window-to-wall Ratio (WWR) 0.198 0.198 External wall Hardboard + Concrete + Cement
Plaster. U value = 2.49 W/m2
Cement Plaster + RC Wall + Cement Plaster. U value = 0.74 W/m2
Roof Concrete + Polysterene + Light Concrete. U value = 1.20 W/m2
RCC + Plaster + Polysterene + Concrete. U value = 0.52 W/m2 Floor Light Concrete + Polysterene + Concrete. U value = 0.54 W/m2
Windows U value = 5.16 W/m2 , SC = 0.78 T vis = 0.83
Low E Glazing; U value = 1.60 W/m2 SC = 0.30, T vis = 0.40
Others No cool paint Cool Paint (Ext Wall with cool paint U value = 0.73 W/m2
Table 3. Fan efficiency improvement
Equipment Type
As-built specification Allowable nameplate motor power SS553
(W/CMH)
Power required by the motor at design condition
(W/CMH) Total Air
Flow (CMH)
Nameplate motor power (W)
AHUs (VAV) ≥ 4kW 0 0 0.00 0.00
AHUs (VAV) < 4kW 77,250 28,947 0.69 0.37
FCUs Lab 38,855 3,623 0.17 0.09
FCUs IT Rack Room 12,713 1,445 0.17 0.11
Active Design Features
High fan efficiency in NSAB. Table 3 shows the improvement in fan efficiency, resulting in impro-vement of 45% over the baseline case.
LED lighting usage throughout the building. Daylighting simulation shows insufficient daylighting in this building due to low WWR. The SPS team proposed to implement highly efficient lighting fixtures and optimized lighting layout throughout the building.
Ambient and task lighting for office spaces. Separation of ambient and task lighting in office spaces will achieve 300 lux and 200 lux respectively.
High Chiller-plant efficiency & Chiller plant control optimization. The SPS team recommended high-efficiency chiller plant types based on their simulated performances for the total cooling loads. Furthermore, automated ACMV system selection, sizing, sequencing and control methodology was implemented to solve incorrect sizing and inaccurate
controls in NSAB. The chiller plant‟s cooling effici
-ency and overall performance were calculated through TRNSYS simulation, resulting in annual chiller plant efficiency value of 0.571 kW/RT.
„Pre-conditioned‟ Dedicated Outdoor Air Sys
-tem (DOAS) with Heat pipes. A De-Humidification Air Handling Unit (DAHU) would cool and dry the fresh air, while a passive displacement ventilation/fan-coil unit (FCU) would satisfy the sensible demand of the room. As such, DOAS system supplies fresh air to most laboratory spaces and offices using DAHU with heat pipes for temperature and humidity control. FCUs are used for zonal temperature and humidity control of laboratory spaces. Passive Displacement Cooling systems are used for zonal temperature and humidity control of fitted offices.
Passive displacement cooling (PDC) system for office spaces. PDC will be implemented in office spaces as the whole cycle of air movement fully depends on the principle of air stratification and no mechanical fan required. The benefit from this system are better occupant comfort due to the relatively low velocity of the supply air and better IAQ, less noise due to the absence mechanical fans and cooling load reduction due to the stratification of tempera-ture within the room that lead to energy saving.
Control Features
Demand Control Ventilation (DCV) for lab spaces. Laboratory ventilation rate is driven by dilution requirements of laboratories. NTU typically operates chemical and some physical laboratories at 8
ACH. As such, the energy required dehumidifying and cool fresh air is immense. DCV system will be applied in lab spaces wherein the amount of outside air delivered within a building is varied based on the occupancy level of a given area by deploying a large number of individual sensors (TVOC, CO2, etc.) throughout the building and integrating the feedback with the building control system. When the particulate count is detected to be lower than the set -point, outside air may be reduced until the building ventilation requirement is met. To balance the safety requirements of laboratories and the energy efficiency of the building, an IAQ dashboard will be installed to monitor the air -quality levels of labs and alert safety officers, facility managers, and lab users in the case of a chemical spill or hazardous air quality. This reduction in conditioned airflow directly translates to energy savings and lab pollutant reduction at NSAB.
Automatic control device for fume hood. This system is a sash lowering mechanism to reduce airflow consumption on Variable Air Volume (VAV) fume cupboards when the operator is not in front of the fume cupboard. This reduces laboratory expenses by saving on the volume of laboratory air that needs to be heated or cooled, and reduces the amount of energy used by the air extraction systems. For labs, using automated fume hood control and demand control ventilation helps to close the sash automatically when not in use and reduce the air change rate without compromising on user safety, respectively. These strategies go a long way in laboratory intensive buildings to give energy savings in mechanical ventilation.
Lighting sensors and controls. From the daylight simulation results, SPS team recommended to equip shaded corridors spaces with luminance sensors which activated electrical lighting systems to supplement daylighting. SPS team also introduced daylight motion and occupancy sensors in the common spaces. The linking of electric lighting system with motion sensors in lab spaces should be able to reduce the ambient lighting by 50% for lab spaces.
In addition, NSAB includes 121.4 kW of rooftop and canopy PV panels in the plaza area. These PV panels were mounted on the canopy to generate solar energy considering the high incident solar radiation this canopy receives without compromising the daylight efficiency of the space.
management. For this project, this also forms a part of the knowledge sharing with the users, tenants and general public visiting the building in order to inculcate a sense of sustainability in them.
Overall Building Performance
The total building energy consumption is expected to reduce 42.1% compared to a code-compliant building on a yearly basis. Adding with the renewable energy generated on site, it would lead to 44.12% total of energy savings. The breakdown of these energy saving measures is shown in Table 4. These energy-saving measures have been analysed via energy simulation to provide scientific basis and justification for predicted energy consumption.
Fig. 10. Overall Energy Savings in NSAB
Fig. 10 shows the main energy savings are from lighting system, followed by air system fans and air-conditioned plant. Significant energy savings were achieved from LED fittings coupled with motion sensors and photocell sensors also by decoupling of the task and ambient lighting in office spaces. High efficiency chiller and optimizing the chiller
sequencing to get the most optimum performance and introducing a heat-pipe for passive reheating and humidity control can also avoid excess energy use. PDC system also helps in increasing the savings on the air side. For labs, using automated control device for fume hood and DCV helps to close the sash automatically when not in use and reduce the air change rate without compromising on user safety, respectively
CONCLUSION AND FUTURE WORKS
SPS is proven to be the most effective solution to design and build this high performance lab building. With the proposed strategies, the total building energy consumption is expected to reduce 44.12 % compared to a code - compliant building on a yearly basis, being the first case study to demon-strate at more than 40% energy savings in Singapore. The simulation tools played an essential role to understand the performance of systems and to determine the final design strategies. The bench-marking and measurement practices can also provide solid evidence for simulation model input that helped push for a greater energy savings. It is hoped that the energy efficient measures and approach from this study could be replicable for other high performance lab intensive building. As future works, comprehen-sive whole-building commissioning shall be per-formed by a third party commissioning agent to ensure that all the building equipment, component, and system are working and meeting performance expectations. Continuous control and monitoring equipment also shall be measured through the Building Management System (BMS) to monitor and manage overall energy demand in NSAB. This is to ensure that the energy savings target can be achieved throughout the life of the building.
Table 4. Energy Savings Calculation
End Use Energy Consumption (kWh) Energy Savings (%) Baseline Model Proposed Model
Lighting- (AC) 946,664.62 428,939.76 54.69%
Lighting- (NON AC) 401,524.91 110,697.62 72.43%
Air-Conditioned Plant 2,358,982.92 1,364,854.94 42.14%
Air System Fans 576,990.60 305,235.53 47.10%
Heat Pipe (baseline: Heat Pump) 865,129.36 0.00 NA Mechanical Ventilation Fans 84,883.91 62,716.12 26.12%
Lift 57,064.80 46,222.49 19.00%
Receptacle Equipment 1,767,075.04 1,767,075.04 0.00%
Domestic Water Systems 9,984.00 9,984.00 0.00%
Total Building Energy Consumption 7,068,300.16 4,095,725.50 42.06%
PV 0 -145,728.00 NA
Total Building Energy Consumption including Renewable Energy Sources
Acknowledgements
We would like to acknowledge BCA for fund-ing this project and for their valuable commen ts during design stage. We would like to acknowledge ODFM as building owner for their great support and their assistance to conduct measurement and veri-fication exercises in NTU campus. We also would like to acknowledge researcher team for NSAB at ERIAN including Mr. SARVAIYA Jatin Narotam and Mr. WU Xiangyu for their assistance on this study. We would like to acknowledge Mr. SAPAR Majid Bin Haji for his guidance and valuable feedback during energy modeling phase. Finally we would like to acknowledge ADPP Architects LLP and Squire Mech Pte Ltd for their support and assistance throughout the design process in order to make achieve the energy performance targets.
REFERENCES
ASHRAE (2009). ASHRAE Handbook– Fundamen-tals. Atlanta, GA: American Society of Heating, Refrigerating and Air-Conditioning Engineers. BCA Green Mark Version 4.1 (2012). Certification
Standards for New Buildings. Building and Construction Authority. Singapore.
Seshadri, B., Zhou, J., Lamano, A., Pawar, P., Partenay,V. (2015). Achieving high-performance building design in the tropics through modelling and simulation: a case study in Singapore. Building Simulation Applications BSA 2015 - Proceedings of 2nd IBPSA-Italy Conference.
Chua, K. J., Chou, S. K., Yang, W. M. & Yan, J. (2013). Achieving better energy-efficient air conditioning. A review of technologies and strategies. Applied Energy, 104, p.87-104.
ERIAN (2013). Design Charrette Report for North Spine Academic Building at NTU.
ERIAN (2015). Office Plug Load Metering Study on NTU Campus. http://ecocampus.ntu.edu.sg/ Pages/CampusBenchmarking.aspx
Factors Affecting Fume Hood Energy Consumption, http://www.i2sl.org/elibrary/documents/marian_ whitepaper.pdf
Gomez, M. & Sun, D. (2013). Smart Labs: Reducing Laboratory Energy Consumption. Journal of Chemical Health and Safety, 20(3), p.41. Hopkinson L., James P., Lenegan N., McGrath T., &
Tait M. (2011). Energy Consumption of Univer-sity Laboratories: Detailed Results from
S-Lab Audits, http://www.goodcampus.org Labs21 (2015). Right-sizing Laboratory Equipment
Loads. http://www.i2sl.org/documents/toolkit/ bp_rightsizing_508.pdf
Laboratories for the 21st Century: An Introduction to Low-Energy Design (2008). http:// http://www. i2sl.org/Marian J. S. (2009).
Pawar, P., Wu, X., Babu, S., (2016). Passive design integration in high performance lab intensive building in the tropics. 15th International Conference on Sustainable Energy Technologies (SET 2016), Singapore.
SS 530 (2006). Code of practice for energy efficiency standard for building services and equipment. Singapore.
SS 553 (2009). Code of practice for air-conditioning and mechanical ventilation in buildings. Singa-pore.
Wilkins, C.K. & M.H. Hosni (2011). Plug Load Design Factors. ASHRAE Journal, May 2011. Zhou, J., Majid Haji Sapar, Pawar, P., Seshadri, B.,