INDOOR THERMAL COMFORT ASSESSMENT OF NATURALLY
VENTILATED ATRIUMS IN SINGAPORE
Wong Nyuk Hien1, Osrithalita Gabriela2*, Erna Tan3, Steve Kardinal Jusuf4
1,2,3 Department of Building, School of Design and Environment, National University of Singapore, 4 Architecture Drive, Singapore 117566
4
Engineering Cluster Sustainable Infrastructural Engineering, Singapore Institute of Technology, 10 Dover Drive, Singapore 138683
*Corresponding author; Email: [email protected]/[email protected]
ABSTRACT
This research looks into the aspect of Thermal Comfort (TC) in naturally ventilated (NV) buildings, in this case NV atriums. Compared to fully air-conditioned buildings, NV buildings tend to have better indoor air quality (IAQ), but worse TC. Therefore, this research investigates the range of acceptable temperature and wind speed in order to achieve thermal comfort for naturally ventilated atriums. Data was collected through field survey in three different buildings of NV atriums and were used to develop and validate the TC model. The data collected from field survey represent visitors’ TC perception in atrium environment, and in-situ environmental measurement also records the characteristics of NV atrium in each area, such as solar radiation, air temperature, relative humidity, and intermittent wind. At the same time with the indoor field survey, a weather station was installed on the roof of the building to measure the micro-meteorological condition. Thermal comfort prediction model was developed from the statistical analysis of the field survey data. The acceptable range to achieve thermal comfort for NV atrium was analyzed. The air temperature of 31°C was determined as the boundary condition. Based on the result of Predicted Mean Vote (PMV) formula, PMV 1 is the highest acceptable value with wind speed required is 0.51 m/s and PMV 0.8 is recommended to achieve the best thermal comfort with wind speed required is 0.78 m/s.
Keywords: Atrium; naturally ventilated; thermal comfort; thermal sensation.
INTRODUCTION
Throughout the years of assessment and evalua-tion process of Green Mark (GM) scheme standard from 2005 set by Building and Construction Autho-rity (BCA), it is found that the criteria used for Residential Buildings (RB) have been adopted for Non-Residential Buildings (NRB), and the passing
criteria of area weighted wind velocity of ≥ 0.6 m/s
(BCA, 2013) for developments with higher GM rating is deemed to be not sufficient to assess the natural ventilation (NV) design for NRB.
There is a paradigm shift from heat balance-based thermal comfort models toward adaptive comfort modeling over the last 20 years (de Dear et al, 2014). All adaptive models show implicitly that occupants of NV buildings achieve thermal comfort across a wider range of indoor temperatures than occupants of air-conditioned buildings. In NV buil-dings, human comfort is more prevalent and needs more attention compared with air-conditioned dings. The dominant characteristics of tropical buil-dings are openness to provide efficient ventilation, and shading to provide protection from the sun, rain and insects. Due to the tropical climate condition, buildings are found to be uncomfortably hot and humid at certain times, and higher velocity of wind
flow over the human body is required to increase the efficiency of sweat evaporation (Yeang, 1987).
Atrium is a common feature in commercial buildings, mainly as a social function space such as events or gathering. There are several references that talked about the history of atrium/atria. In modern architecture, atrium is an expansive open space that is often several floors high and is covered by a glass roof, big windows, or both (Moosavi et al, 2014).
This research looks into the aspect of Thermal Comfort (TC) in NV buildings, in this case NV atriums. It investigates the range of acceptable tem-perature and wind speed in order to achieve thermal comfort for naturally ventilated atriums.
This study will help BCA to further ensure sustained building performance, which key strategy would be to minimize energy consumption through the optimization of design.
The research aims to establish alternative evalua-tion methods and criteria to demonstrate good natural ventilation in NRB buildings. The objectives of this study are as follows:
1. To develop thermal comfort model, analysis and validation; and
METHODOLOGY
Objective and Subjective Measurement
Data was collected through field survey and used to develop and to validate the TC model. Field
survey allows “first-hand” data that help to capture
occupants’ TC perception in their actual daily envi
-ronment. The in-situ environmental measurement also records the characteristics of NV buildings, which are dynamic and unpredictable. These NV characteristics such as intermittent wind, solar radiation and high humidity cannot be simulated easily by mechanical means in a chamber thus field survey is considered as the best method for the data collection.
The measurement protocol for the field survey followed Class II protocol of thermal comfort field research (Brager & De Dear, 1998). There are two groups of data required, i.e. objective and subjective measurement data. Since the human perception is not
as simple as “stimulus-response” (cause-effect)
phe-nomenon, the field survey attempted to observe and collect data to comprehend better the complex human perception, behaviour and background. Different physical parameters affect physiological reactions to the environment. All parameters such as air tempera-ture, radiant temperatempera-ture, surface temperatempera-ture, air velocity and humidity are the basis for defining criteria for an acceptable thermal environment (Kalz & Pfafferott, 2014).
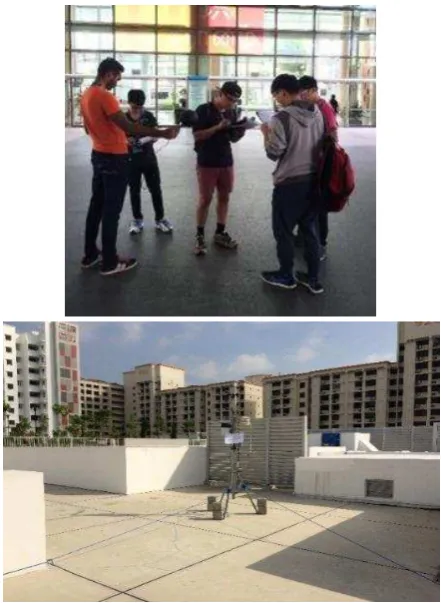
The objective measurement measured the air temperature, wind speed, relative humidity and globe temperature near each occupant (respondent), and noted the activity and the clothing level of the respondent while the respondent did the subjective assessment. The objective measurement was conduct-ed at around 0.8 – 1m high from the floor. The measurement was conducted using handheld equip-ment of Testo 445 as shown in Fig.
1
(left). During the indoor field survey, a weather station was installed on the roof of the building to measure the micro-meteorological condition. Fig.1
(right) shows the HOBO weather station. The monitored environmental parameters included ambient temperature, wind speed and wind direction, relative humidity, and solar radiation.The subjective assessment was formulated into questionnaire form. Some standard questionnaires (response scales) for TC studies are widely used such as ASHRAE and Bedford scales (Chrenko & Bedford, 1974; McIntyre, 1980). Seven scale of ASHRAE thermal sensation vote and seven scale of Bedford thermal comfort vote are used. By using both scales, the consistency of response between thermal sensation (hot to cold) and perception (uncomfor-table-comfortable warm or cold) can be further verified.
Fig. 1. Handheld Equipment Testo 445 and Weather Station
HOBO (Source: author and gayeontech.co).
Thermal Comfort Survey
For each building, the survey was conducted in different sessions daily, based on the activity of the building i.e. in between 10am to 12pm (morning session) and in between 1.30pm to 4pm (afternoon session), and 5pm to 7.30pm (evening session) if there is any activity in the evening. The study tried to cover different session in order to capture the thermal perception of different parts of the day. The data collected from the field survey was compared bet-ween external and internal environment. Observations were made on the measured data such as clothing level and metabolic rate as well as the sensation and perception data.
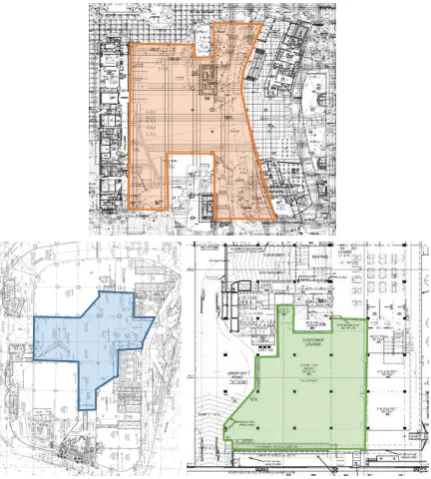
The surveys were conducted on the visitors in the atrium area of three different buildings with NV atriums in Singapore (see Fig.
2
).The TC surveys at building A were conducted on 14, 15, 18, and 20 January 2016. Each survey was conducted for 3 sessions: morning session (10am – 12pm), afternoon session (2pm – 4pm), and evening session (6pm – 8pm). A HOBO weather station was installed on the roof top with no obstruction. Total number of respondent from the survey was 234.
The TC survey at building B was conducted on 5 April 2016 when the weather condition was bright all day. The survey was conducted continuously from 10am until 3.30pm, which covered morning and afternoon sessions. There was no evening session because it is an office building where most of the activities end after 5pm. A total number of 120 respondents participated in the TC survey.
The TC surveys at building C were conducted on 18 and 19 July 2016 when the weather condition was bright – partly cloudy. The surveys were conducted for 2 sessions: morning session (10am – 12pm) and afternoon session (1.30pm – 3.30pm). A HOBO weather station was installed on the roof top with no obstruction. A total of 110 respondents agreed to participate in the survey at building C.
Figure 3 (left) shows the typical TC survey in NV atriums and Figure 3 (right) shows the typical installation of weather station on the roof top with no obstruction.
RESULT AND DISCUSSION
Field Measurement Data
In total, a total of 464 respondents participated the thermal comfort surveys. Table 1 shows the data sampling distribution on all buildings.
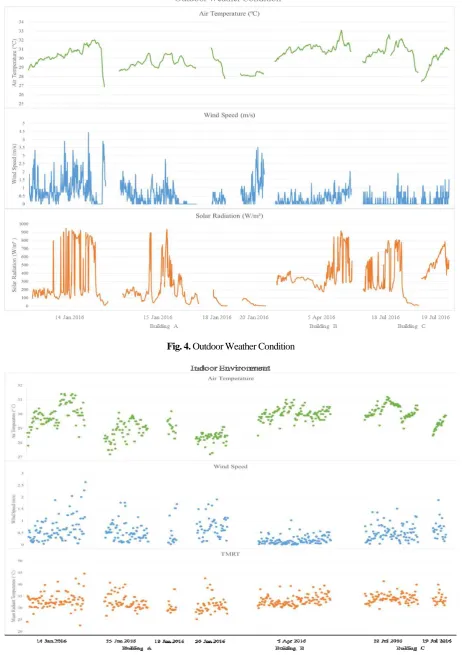
The first two-day survey in building A was on a bright day in the morning and then the weather changed drastically into a cloudy condition in the afternoon and subsequently it was raining in the
evening with solar radiation less than 200 W/m2 and air temperature less than 29°C. The survey in building B was during the hottest weather condition among all sites with solar radiation reaching 920 W/m2 and air temperature ranged 29.7-33.1°C. The surveys in building C were during bright to partly cloudy weather condition with solar radiation reaching 800 W/m2 and air temperature ranged 27.4-32.6°C.
Error! Reference source not found. shows the
measured outdoor weather condition during the time of the TC survey.
Fig. 3. The Typical Indoor Field Survey (left) and the
Typical Installation of Weather Station (right)
Table 1. Data Sampling Distribution on all Sites
Building A Building B Building C
Weather Bright Partly
Date of survey 14-Jan-16 15-Jan-16
Fig. 4. Outdoor Weather Condition
Figure 5 shows the measured data and the summary of air temperature (°C), mean radiant temperature (°C) and wind speed (m/s) of all res-pondents respectively. Generally, the trend of the measured indoor air temperature follows the trend of the outdoor air temperature. Indoor air temperature increases when outdoor air temperature increases.
The survey at building A was conducted on bright condition that turned into cloudy and rain in the afternoon. TC survey at building B was conducted during bright day. The indoor environment in build-ing C almost have the same pattern with buildbuild-ing B. The indoor wind speed was measured mostly at the range of 0.2-0.7 m/s, while mean radiant temperature was at the range of 31-34°C.
Fig. 6. Thermal Acceptability Graph
Thermal Comfort Model Development and Validation
The thermal comfort survey data is divided into two groups, i.e. one set for model development (371 data) and one set for model validation (93 data). Weighted estimation was made to determine the number of respondents selected from each site and each session for validation purpose.
The computation of the statistical analysis used SPSS® Version 23 software. Multiple Regression Analysis is the most common statistical tools used by many TC researchers to develop TC indices (Webb, 1959; Sharma & Ali, 1986), it was employed to find the best correlation between the Predicted Mean Vote (PMV) as dependent variable, and the set of environ-mental variables as independent variables. Clothing was included because in during the survey, the respondents wore different clothes.
Using the data set for model development, corre-lation between the dependent variable PMV and independent variables are depicted in Table 2.
Correlations and linear regressions were con-ducted. Through the Pearson Correlation, DBT, WIND, and RH are found to be significant as high-lighted in Table 2. A trend analysis was done to explain the variables by examining the independent
variables’ regression coefficient values (B) and their
correlations with the dependent variable using Pear-son correlation (r). Correlation significance level was also examined based on p < 0.05.
Table 2. Inter-Correlation between Independent Variables and PMV
PMV DBT RH WIND TMRT CLO MET
PMV Pearson Correlation 1 .246 -.253 -.256 .002 -.018 -.044
Sig. at 0.05 level (2-tailed) .000 .000 .000 .973 .726 .397
DBT Pearson Correlation .246 1 -.412 -.158 .027 -.149 -.097
Sig. at 0.05 level (2-tailed) .000 .000 .002 .598 .004 .061
RH Pearson Correlation -.253 -.412 1 .223 -.134 -.088 .040
Sig. at 0.05 level (2-tailed) .000 .000 .000 .010 .090 .448
WIND Pearson Correlation -.256 -.158 .223 1 .387 -.061 .079
Sig. at 0.05 level (2-tailed) .000 .002 .000 .000 .240 .130
TMRT Pearson Correlation .002 .027 -.134 .387 1 -.024 .067
Sig. at 0.05 level (2-tailed) .973 .598 .010 .000 .644 .198
CLO Pearson Correlation -.018 -.149 -.088 -.061 -.024 1 -.048
Sig. at 0.05 level (2-tailed) .726 .004 .090 .240 .644 .357
MET Pearson Correlation -.044 -.097 .040 .079 .067 -.048 1
Sig. at 0.05 level (2-tailed) .397 .061 .448 .130 .198 .357
Table 3. Combinations of Environmental Variables
Variables in equation
No Combinations DBT RH WIND Constant R2 Adjusted R2 Residual Mean Square
1 DBT WIND 0.343 - -0.747 -9.252 0.109 0.104 1.822
In the statistical analysis process, it was found that DBT, RH, and WIND were the significant inde-pendent variables. From all combinations in the multiple regression analysis, the combinations that all independent variables combined are significant, as shown in Table 3. Since people are adapted to hot humid condition and in order to standardized PMV models for different building types, Combination 1 is considered for the thermal comfort model.
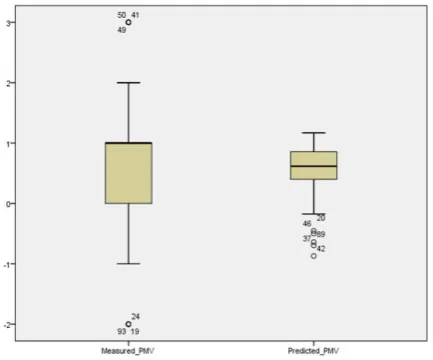
The equation based on Combination 1 can be overall, 80% of the predicted PMV value is within the interquartile range (central tendency) of the measured PMV.
Fig. 7. Comparison of Measured PMV and Predicted PMV
for Model Validation
Table 4. Descriptive Data of Boxplot Graph
Min. Max. Median Interquartile Range
Measured PMV -2 3 1 0-1
Predicted PMV -0.9 1.4 0.63 0.3-0.9
Boundary Condition
The PMV equations have two components, i.e. DBT and WIND. For WIND, indoor wind speed with or without fans shall be derived from CFD simulation. For DBT, Changi meteorological weather station air temperature (dry bulb temperature) of 32 years was analyzed.
Since the atriums are inside commercial/public buildings that generally operate at around 9am to 6pm daily, the analysis was also conducted for this period. There were two approaches being looked into. The first approach was by daily averaging the DBT at 9am to 6pm, and the second approach was by grouping the hourly DBT from the weather station data directly into the DBT bins without daily averaging. From this analysis, the most frequently occurred DBT from both approaches is 30°C.
Most of the atriums used for the thermal comfort survey did not use skylight and hence, the effect of solar radiation on ambient air temperature might not be shown in the analysis. The survey also only managed to get thermal perception from passerby rather than from participants of event held in atriums.
Therefore, DBT as boundary condition for NV atriums is raised to 31°C from 30°C. The reasons are: 1. To factor in the effect of solar radiation on
ambient air temperature because atriums may use skylight; and
2. To factor in the heat load from people gathering during event held in the atrium.
Sensitivity Analysis
Table 5 shows the various wind speed required based on air temperature of 31°C to achieve various PMV values, and the various air temperature required based on wind speed of 0.6 m/s to achieve various PMV values respectively. The air temperature of 31°C was determined as the boundary condition.
Table 5. Various Wind Speed Required to Achieved
PMV model for naturally-ventilated atrium is; PMV = 0.343 DBT - 0.747 WIND - 9.252 (2)
Which DBT is indoor air temperature (°C) with baseline at 31°C and WIND is indoor wind speed (m/s).
below the value of 0.8, the high wind speed might be too drafty (See Table 5), and it is not recommended.
ACKNOWLEDGMENT
This paper is part of the research project
“Development of Computation Fluid Dynamic (CFD)
Simulation Methodology and Evaluation parameters, Thermal Comfort Model & Simulation Methodology for Wind Driven Rain in Natural Ventilated Building for Non-Residential Buildings (NRB) BCA Green
Mark Criteria” funded by Building and Construction
Authority (BCA) Research & Innovation Fund grant number 1.51.602.22153.00, and managed by Institute of High Performance Computing (IHPC). The authors would like to thank National Library Board Singapore for the technical support during one of the surveys.
REFERENCES
Building and Construction Authority. (2013). BCA Green Mark for New Non-Residential Buildings Version NRB/4.1.
De Dear, R.J. et al. (2013). Review Article: Progress in Thermal Comfort Research over the Last Twenty Years. Indoor Air, 23, pp.442-461. Jhon Wiley & Sons Ltd.
Yeang, K. (1987). Tropical Urban Regionalism: Building in South-east Asian City. Concept Media. Singapore.
Moosavi, L. et al. (2014). Renewable and sustainable energy reviews, pp. 654-670.
Brager, G.S. & De Dear, R.J. (1998). Thermal Adaptation in the Built Environment: A Literature Review. Energy and Buildings, 27, pp. 83-96. Elsevier.
Kalz, E.D. & Pfafferott, J. (2014). Thermal Comfort and Energy-Efficient Cooling of Nonresidential Buildings. SpringerBriefs in Applied Sciences and Technology.
Chrenko, F.A. & Bedford. (1974). Bedford’s Basic Principles of Ventilation and Heating. HK Lewis and co. London.
McIntyre, D.A. (1980). Indoor Climate. Applied Science Publishers. London.
Webb, C.G. (1959). An Analysis of Some Obser-vations of Thermal Comfort in an Equatorial Climate. British Journal of Industrial Medicine,
16, pp. 297-310.