THERMAL COMFORT STUDY OF AN AIR-CONDITIONED DESIGN
STUDIO IN TROPICAL SURABAYA
Agus Dwi Hariyanto
Lecturer Faculty of Civil and Planning Engineering, Architecture Department, Petra Christian University
e-mail: [email protected]
ABSTRACT
This paper evaluates the current thermal comfort condition in an air-conditioned design studio using objective measurement and subjective assessment. Objective measurement is mainly to quantify the air temperature, MRT, relative humidity, and air velocity. Subjective assessment is conducted using a questionnaire to determine the occupants thermal comfort sensations and investigate their perception of the thermal comfort level. A design studio in an academic institution in Surabaya was chosen for the study. Results show that more than 80% of the occupants accepted the indoor thermal conditions even though both the environmental and comfort indices exceeded the limit of the standard (ASHRAE Standard 55 and ISO 7730). In addition, non-uniformity of spatial temperature was present in this studio. Some practical recommendations were made to improve the thermal comfort in the design studio.
Keywords: Thermal comfort, PMV, neutral temperature.
INTRODUCTION
Thermal comfort is one of the most important parameters to measure in relation to the performance of buildings. It is a physical condition of indoor environment which has great influence on people’s health and productivity in workplace. The acceptable thermal environment which is defined in ASHRAE Standard 55 (2004) as an environment with at least 80% of the occupants are thermally acceptable, is a general parameter of thermal quality in a space. The need for acceptable indoor thermal condition in a modern society is increasing in developing country such as Indonesia. In order to satisfied the occupant’s thermal needs, many academic institution buildings are installed with split air conditioning system units to provide better thermal environment to the occupants. This type of system is low in capital, installation, and maintenance costs. It can be installed easily and quickly in selected space without the need for extensive central ducting systems. Split units offer easier installation, since they do not require any major structural changes to the internal space. Hence, this system is commonly installed in buildings which were formerly natural ventilated. Split units are usually small in cooling capacity since they are only used for small spaces (Santamouris and Asimakopolous, 1996). However, it is sometimes installed in large space, such as in lecture theatre, design studio and multipurpose hall in academic institution to provide thermally acceptable environment. Hence, the risk of unacceptable thermal environment might take place in such spaces.
Design studio is a place where architecture students spend most of their time during their course
of the study. They spend at least 4 hours daily in the design studio. The characteristics of the design studio in the School of Architecture are also very unique with a highly interactive learning or teaching environment. It does not merely accommodate drawing activity but also team work discussion, tutorial, critic (evaluation), and presentation. The design studio becomes a very important place for architecture students. Thus there is a need to investigate on both thermal environment indices and sensation of the occupants in the design studio. The design studio in the School of Architecture at Petra Christian University, Surabaya, Indonesia, is used as a premise for this study. In the past, the design studio was naturally ventilated but it has been converted to an air conditioned space served by split air-conditioning units.
The primary objectives of this study are:
- To evaluate the thermal comfort level in the
design studio based on environmental indices, comfort indices, and subjective response of the occupants
- To determine the comfort (neutral) temperature
for human occupancy in the design studio
LITERATURE REVIEW
Thermal Comfort Model (PMV and PPD)
Fanger (1970) is based on the seven scale which ranged from cold (-3), through neutral (0) to hot (+3). PMV is a measure of thermal sensation that the mean of occupants feels in indoor environment. Actually, it has a complex mathematical expression of environmental variable (air temperature, mean radiant temperature, relative humidity, and air velocity) and personal variable (clothing and metabolic rate). Furthermore, it is mathematically expressed by:
These complicated equations are more conveniently solved using a computer program.
Fanger (1970) correlated the percentage ratio of the people who were dissatisfied with the thermal environment with the Predicted Mean Vote (PMV). This ratio was called the Predicted Percentage Dissatisfied (PPD). The correlation is shown in Figure 2.2 which has a symmetrical curve with minimum value of 5% corresponding to the lowest PPD. The PPD is represented by the expression:
PPD = 100 – 95exp - {0.03353 (PMV)4 + 0.2179
(PMV)2}
PMV and PPD are widely used but still have some limitation (Awbi, 2003). Standard condition of sedentary activity and light clothing is required for obtaining accurate result. Thus it is less accurate at more extreme condition of activity and heavy clothing. Moreover, the PMV index is derived from environmental chamber which fully controlled therefore it is also less accurate for less well-controlled environments, such as natural ventilated building.
The Adaptive Model
The premise that building occupants has an active role in creating their own thermal preferences was the trigger of development on the adaptive model of thermal comfort. In addition, the previous standard such as ASHRAE Standard 55 – 1992 might be inadequate since they prescribe a narrow range of temperature to be applied uniformly through space and time (de Dear and Brager, 1998). Briefly mentioned by Parsons (2003), people adapt to preserve comfort because they are not passive receptors of discomfort. However, occupants are able
to create appropriate thermal adaptation to achieve satisfaction of indoor thermal environment.
Humphreys and Auliciems derived an adaptive model which is widely used to predict the comfort temperature (Humphreys and Nicol, 1998). For heated and cooled buildings, Humphreys’ equation is as follows:
Tc = 23.9 + 0.295 (To–22) exp (–[(To–22)/(24√2)]2) (˚C).
Auliciems’ equation is applied for all buildings:
Tc = 0.48 Ti + 0.14 To + 9.22 (˚C)
Tc is stand for comfort temperature, To for monthly
mean outdoor temperature, and Ti for indoor mean
temperature.
The latest edition of ASHRAE Standard 55 (ASHRAE, 2004) includes the Adaptive Comfort Standard (ACS). Unfortunately, the scope of ACS is limited to NV buildings in which thermal conditions of the indoor environment may be influenced by the occupants (de Dear, 2004). The ACS can be applied to NV building which has operable windows. Hence, the requirement is that the occupants should be able to control the ventilation, primarily by opening of windows. The acceptable operative temperature ranges for naturally conditioned space is also presented in this edition of the standard.
Therma Comfort Study In AC Buildings In The Tropics
The two studies in Singapore showed that the indoor thermal condition in both office buildings (de Dear et al, 1991) and lecture theatre (Cheong et al, 2003) were within the threshold of the standard (ASHRAE Standard 55 and ISO 7730). It is observed that the result of the comfort votes in those studies indicated that the buildings were overcooled thus giving the cool and slightly cool experience to the occupants respectively. Kwok observed that less than 25% of Hawaii’s classroom thermal conditions were within the ASHRAE Standard 55 summer comfort zone (Kwok, 1998). Researcher such as Karyono (1995) found that Fanger’s PMV predicts higher than the workers’ Actual Mean Vote (AMV). This means that the occupants accepted the indoor temperatures, however, it was predicted ‘too warm’ by the PMV. Study in Darwin, Brisbane, and Melbourne found that heat balance model (PMV) and neutrality calculations derived by Fanger was less accurate compared with the adaptive model (Auliciems model). Hence, Auliciems and de Dear (1986) suggested that set point temperature in AC building should be continuously adjusted in accordance with thermal neutrality of adaptive model (indoor and outdoor) to meet the occupants’ thermal need and reduce the excessive cooling.
RESEARCH METHODOLOGY
The study was conducted in a design studio in the School of Architecture, Petra Christian Univer-sity, Surabaya – Indonesia. The design studio, 32.8 m (L) x 14.5 m (W) x 3.2 m (H), is located on the 8th storey of a 9-storey building. The clear glass windows are placed on the west and south perimeter walls. These windows are installed at 1.2 m above the floor. The studio has a seating capacity for 160 occupants.
Figure 1. Axonometric of the design studio
The design studio was designed for natural ventilation. However, it has been air conditioned using the split air conditioning units. The studio is served by four split air conditioning units suspended on the ceiling near the perimeter wall as shown in Figure 1. There was no fresh air provision in this studio.
Field Measurements
Field measurement protocol conforms to the specification in the Standards. ASHRAE Standard 55 (ASHRAE, 2004) and ISO 7726 (ISO, 1998) are the Standards which specify the minimum characteristics of equipments for measuring as well as the methods for measuring the physical parameters such as air temperature, humidity, mean radiant temperature as well as air velocity.
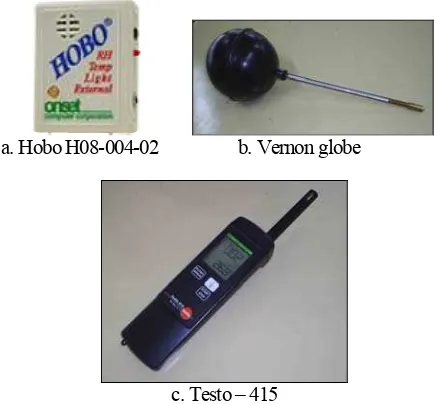
a. Hobo H08-004-02 b. Vernon globe
c. Testo – 415
Figure 2. Equipments for field measurement
In this study, the equipment for the field measurement was Hobo data logger, digital hot wire anemometer, and globe temperature. Figure 2a shows Hobo H08-004-02 for measuring air temperature and relative humidity. It has an accuracy of ±0.7°C and ±5% for temperature and humidity respectively. Figure 2b shows the 150 mm diameter black painted globe thermometer (Vernon globe) for measuring globe temperature with an accuracy of ± 0.25°C. Finally Figure 2c shows the digital hot wire anemometer Testo – 415 for measuring air velocity
with an accuracy of ± 0.05 ms-1. Mean radiant
temperature is calculated based on the conversion of globe temperature measured using the 150 mm diameter black painted globe thermometer (Vernon globe). The equipment has been calibrated before used to assure reliable and accurate readings during the measurement.
1 5 9 13
2 6 10 14
3 7 11 15
4 8 12 16
Split AC unit Split AC unit Split AC unit 1 5 9 13
2 6 10 14
3 7 11 15
4 8 12 16 Split AC unit
Split AC unit Split AC unit
Figure 3. Location of measuring points
A total of 16 locations were set up in the occupied zone to measure the physical parameters. The parameters were measured only at 1.1 m height above the floor due to the limited numbers of equipment. It complies with the standard of head level for sedentary occupants at sitting positions (ISO, 1998). Measurements of air temperature and relative humidity were carried out continuously on a particular day. The equipments were set up to record the data starting at 08.00 AM to 05.00 PM. Measurement of either globe temperature or air velocity were conducted instantaneously in the morning and afternoon on that day. These protocols are repeated for four days.
Personal Parameters
The method for estimating the personal parameters was based on the International Standard (ISO) and ASHRAE Standard 55. ISO 9920 (ISO, 1995) presents the procedures for estimating thermal insulation for a clothing ensemble. Three approaches of determining the metabolic rate are presented in ISO 8996 (ISO, 1990). ASHRAE Standard 55 provides the table on metabolic rate for different kind of activities.
Observations were made on the type of clothing worn by the occupants before determining the clothing ensemble of both male and female students. The thermal insulation of each individual garment can be found in Annex B of ISO 9920 (ISO, 1995). The insulation for the entire clothing (Icl, in m2.˚C/W or clo) was estimated using the empirical equation (Icl = ∑ Iclu where Iclu is the thermal insulation of various individual garments making up the ensemble).
Since the activities of the occupants in the design studio have already been known, the approach of Level IIB in ISO 8996 (ISO, 1990) was applied to determine the metabolic rate. This approach utilizes an estimation tables for specific activity. The standard specifies that the approach has accuracy of ±15%. The occupants’ activity in the studio can be classified as sedentary activity (laboratory, school). Therefore the occupants’ metabolic rate was 1.2 met or 69.8 W/m2 (refer to ASHRAE Standard 55, 2004).
Subjective Assessment
A questionnaire survey was conducted during the period of the objective measurements. The questionnaire used in this study was adopted from Cheong et al. (2003) but with some modification to exclude the questions about the lighting, acoustics, and ergonomics. They were eliminated since this study primarily focuses on the issue of human’s thermal comfort. The subjective assessment was based on the occupants’ vote on the thermal preference, thermal sensation, humidity and air movement in the studio. The scales that were used are Preference scale, ASHRAE scale, humidity scale, freshness scale, and airflow scale. The Bedford scale was not used in this thermal comfort evaluation as it is found to be semantically similar to the thermal sensation scale (Kwok, 1997). The survey was conducted in both the morning and afternoon sessions over the four days of objective measurements. Two sessions are necessary to capture the condition at different time of the day.
RESULT AND DISCUSSION
Respondents
The four days subjective study in the design studio was carried out during the dry season in May 2004 with a total of 208 respondents. All the respondents are within the age group of 18 – 20 years old. Data collection divided into 2 time slots: morning and afternoon. The data sample consisted of 121 (58.2%) male respondents and 87 (41.8%) female respondents. It is observed from the data collection that there are 79.3% respondents in the morning compared to 20.7% in the afternoon. Respondents were briefed for 30 minutes after they entered into the design studio.
Environmental Parameters
The data were collected at 16 locations in the design studio on the four days in May 2004. The sensors of measuring instruments were fixed at 1.1 m above floor level, whilst students completed the questionnaire. The thermal measurement basically captured four parameters which required computing thermal indices such as Operative Temperature (top) and Predicted Mean Vote (PMV).
maximum standard deviation was 0.67. It is also observed that the lowest average temperature was
24.8˚C with a standard deviation of 0.37 and the
highest was 28.1˚C with a standard deviation of 0.54. They were found at locations 5 and 8 respectively. Location 5 is located inside or near the throw of the split air-conditioning unit. A short interview with the Mechanical and Electrical engineer of the building found that the set point of the air temperature in this studio is 26˚C as required by the University Board. In general, the air temperature was varying between 23.6˚C and 29.50˚C with 87.5% of the design studio exceeded the limit set by the University Board.
23
Mean MRT Min MRT Max MRT
Figure 4. Air temperature and MRT at the
occupied zone
Mean radiant temperatures (tr), which were
computed based on the alteration of globe
temperature readings, were within 27.2˚C and
32.4˚C. The lowest average mean radiant
tempe-rature was 28.6˚C were found at locations 6 and 13. The highest average of mean radiant temperature was
31.3˚C at location 4 with a standard deviation of
about 1.09. This location is very near to the window. Operative temperature (top) is estimated from the
measured air temperature (ta) and mean radiant
temperature (tr) by the relation top = A ta + (1 – A) tr where the weighting factor (A) depends on the air velocity (ASHRAE, 2004). The weighting factors of 0.5 and 0.6 for air velocity < 0.2 m/s and 0.2 – 0.6 m/s respectively. Based on the data of Tables 4.1 and 4.2, the mean operative temperature throughout the
occupied zones was 28.2˚C with a maximum mean
value of 28.5˚C and minimum mean value of 27.1˚C. Operative temperature was found to be the highest at location 12 and the lowest at location 5. The requirement of the operative temperature shall be between 23˚C and 26˚C for sedentary activity during summer conditions (ISO 7730, 1995). However, the
operative temperature in the studio exceeded the limit of 26˚C specified by the Standards.
30
Figure 5. Relative humidity at the occupied zone
Figure 5 presents the relative humidity and air velocity at all the 16 locations in the design studio. Relative humidity was found to be within 35.1% and 67.9%. The lowest mean relative humidity was measured at point 8 with 41.2% and a standard deviation of 2.78. The highest relative humidity was measured at location 4 with 52.3% and a standard deviation of 4.78. It was observed that there was significant variation of relative humidity in the space since the values of standard deviation at these locations were between 2.60 and 5.09. The relative humidity meets the standard (ISO 7730, 1995) for sedentary activity during summer condition since the specification of relative humidity by the Standards in indoor thermal condition shall be between 30% and 70%.
Figure 6. Air velocity at the occupied zone
Air velocity was relatively low in most locations except at location 4 with mean air velocity of 0.28 ms-1 and standard deviation of 0.21. Higher air movement was observed at locations 5, 9, and 16 as they are nearer to the diffuser of the split air-conditioning unit (see Figure 3). Location 4 could be in the path of the throw of air from the split air-conditioning unit. In general, the measured air velocities in the studio did not exceed the threshold
sedentary activity but further analysis is needed at the zone which has potential draft risk.
Clothing And Metabolic Factors
Clothing and metabolic rate were computed based on the observation made during the survey. It was observed that generally the occupants’ clothing ensemble consisted of short sleeve shirt and jeans/straight trousers for male whilst female wore light blouse or ¾ sleeves shirt and a-line skirt or jeans. Based on the list of clothing stated in ISO 9920 (ISO, 1995), the average clothing insulation value was 0.51 clo. Actually, there was a bit variation of clothing ensemble with a standard deviation of 0.03 and 0.06 for male and female respectively. The chair insulation was not taken into consideration in the estimation of the clothing value because the studio uses the wooden and metal chairs. This kind of chairs has 0 clothing value (ASHRAE, 2004). Kwok (1998) commented that the additional chair insulation may have been unnecessary since students do not sit for as long a period as compared to the office workers. It may contribute to the overestimation of PMV in occupied zones. Table 1 presents the summary of clothing value.
Table 1. Summary of clothing value
Clothing value (clo) Gender
Mean SD Min Max
Male 0.50 0.03 0.46 0.53
Female 0.52 0.06 0.44 0.58
Metabolic rate was estimated to be 1.2 met (69.8 W/m2) which corresponds to sedentary activity (office, dwelling, lab, school) in the ASHRAE Standard 55 (ASHRAE, 2004). The activities of architecture students in the studio were drawing and discussion at seated position. Occasionally, the students were involved in group presentation with one group standing and presenting their designs while the tutor and the rest of the students gave feedback to their designs.
Predicted Mean Vote (PMV)
Based on the result of objective measurements, the PMV values were computed using ASHRAE Thermal Comfort Program version 1.0 derived by Fountain and Huizenga (1994). The distribution of PMV values in 16 locations of occupied zone can be found in Figure 7.
Figure 7. PMV distributions in occupied zone
It is observed that the distribution of PMV for most locations was above 0.90 which corresponds to PPD > 20%. The average PMV in the occupied zone was 0.97 which corresponds to a PPD of 24.85%. Lower PMV values of 0.58 and 0.52 were found at locations 4 and 5 respectively. The PMV at location 4 corresponds to a PPD 12.9% while location 5 corresponds to a PPD 11.5%. Thermal comfort standards required that the PPD to be less than 10% to correspond the PMV between -0.5 and +0.5 (ISO 7730, 1995; ASHRAE, 2004). Hence, the PMV in occupied zones of the design studio exceeded the recommended thermal comfort requirements. But the PMV at locations 4 and 5 were slightly higher than the Standards.
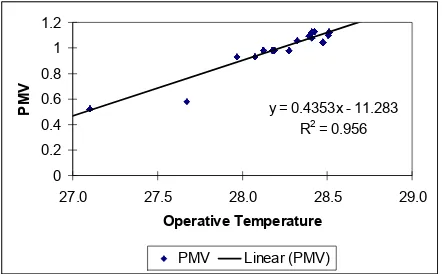
y = 0.4353x - 11.283 R2 = 0.956
0 0.2 0.4 0.6 0.8 1 1.2
27.0 27.5 28.0 28.5 29.0
Operative Temperature
PM
V
PMV Linear (PMV)
Figure 8. Correlation PMV and operative tem-perature
Further analysis is proposed to establish the correlation between PMV and operative temperature (top). Figure 8 depicts the correlation using the linear regression analysis. The gradient of 0.4353 and the positive correlation indicate that every increase of about 0.5˚C operative temperature (top) responds to 0.2 scale unit of PMV. It is also observed that the regression line of PMV are fitted well to the indoor operative temperature (top) with a high correlation coefficient (R2 = 0.956). Therefore, in order to meet the standard: -0.5 < PMV < +0.5 (ISO 7730, 1995;
ASHRAE, 2004), the operative temperature (top) in
Subjective Assessments
This section presents the results of the questionnaire survey of thermal comfort condition in the design studio. This includes thermal sensation, thermal preference, assessment of humidity, assessment of air movement and overall thermal comfort.
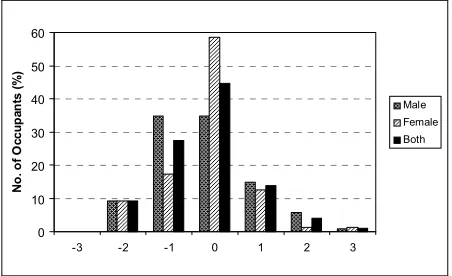
Figure 9. Distribution of subjective response on thermal sensation
The subjective scale used for thermal sensation, -3 (cold), -2 (cool), -1 (slightly cool), 0 (neutral), 1 (slightly warm), 2 (warm) and 3 (hot), adopted the ASHRAE scale. The result of subjective responses to temperature (thermal sensation) is presented in Figure 9. It shows that majority of the respondents voted neutral sensation (44.7%) followed by slightly cool (27.4%). The mean vote of thermal sensation was -0.21 and this is between neutral and slightly cool. The ASHRAE Standard 55 (ASHRAE, 2004) specified an acceptable thermal environment with 80% of occupants vote for the central three categories (-1, 0, 1). It was found that 86.1% of respondents accept their thermal environmental condition. Hence it is deemed to satisfy the Standard. In addition, it was observed that majority of the female occupants were in neutral sensation. 34.7% of male voted for neutral and slightly cools sensations.
0
Figure 10. Distribution of subjective response on thermal preference
The subjective scale used for preference refers to McIntyre scale (McIntyre, 1980): -1 (warmer), 0 (no change) and 1 (cooler). The percentage of respondents who wanted to be cooler in their environment was 48.1% but only 6.3% of them wanted their environment to be warmer (see Figure 10). The mean vote was 0.42 and this is between no change and cooler. Votes of 0 (‘no change’) scale is able to represent an assumption of acceptability thermal environment. Hence, the percentage of ‘no change’ votes (45.7%) is far below the standard’s 80% satisfaction criterion. The votes of ‘want to be cooler’ were slightly higher (48.1%) than ‘no change’. In the previous section, the thermal acceptability of thermal sensation votes (ASHRAE scale) was found to be more than 80%. Therefore, it shows that the largest occupants preferred to be cooler even though they still accept the existing indoor condition. The indoor condition has mean operative temperature of 28.2˚C.
0
Figure 11. Distribution of subjective response on humidity
0
Figure 12. Distribution of subjective response on air movement
The subjective scale used for air movement was on a 7-point scale: -3 (very still), -2 (moderately still), -1 (slightly still), 0 (acceptable), 1 (slightly draughty), 2 (moderately draughty), 3 (very draughty). About 60% of the respondents accept the air movement in their design studio as shown in Figure 12. The mean air movement vote is within the slightly still category of -0.1. About 23.6% of the respondents claimed that the air flow in the design studio was slightly still to very still, whilst 15.9% claimed slightly draughty to very draughty. These respondents may be seated in the throw path of the split air-conditioning unit. Total percentage of three central category (-1, 0, 1) was 90.9%. Therefore, it shows that most occupants accept the air movement in the studio.
0
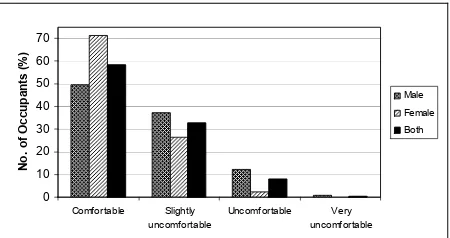
Figure 13. Distribution of subjective response on overall thermal comfort
A four-point scale was used to measure subjective respond on the overall thermal comfort in the design studio. Figure 13 shows that about 58.7% of the respondents voted comfortable and 32.7% was slightly uncomfortable. Only 10% of the respondents voted in the uncomfortable and very uncomfortable. The mean overall thermal comfort was within the comfortable and slightly uncomfortable category. In other words, thermal comfort conditions in the design studio are acceptable to majority of the respondents.
Thermal Sensation Versus Thermal Preference The thermal sensation vote (TSV) distribution is plotted against thermal preference vote to analyze how the respondents interpreted and voted in two different subjective scales (Feriadi, 2003). The data in the Table 2 presents the actual preference vote frequencies in each scale.
Table 2. Thermal sensation and preference
ASHRA
It is observed that almost a half of total respondents (48.1%) wanted the indoor environment to be cooler, but most of them (89%) accepted the thermal environment as shown at TSV (-1, 0, 1). Moreover, about 36% of them wanted to be cooler, voted for neutral (0). It is also observed here that the percentage of the respondents wanted to be warmer is much lower (6.3%) than no change and cooler. However, it should be noted that 45.7% of respondents accepted the indoor thermal condition whereas 58.9% and 24.2% of them feel neutral and slightly cool respectively. About 44.7% of the total respondents felt neutral but 38.7% of them wanted their environment to be cooler.
The observation firstly indicates that in such design studio, occupants who feel neutral were not always satisfied with the condition and wanted their environment to be cooler. The ones who are satisfied (prefer ‘no change’) with their environment, were not 100% having neutral sensation. Finally, the indoor thermal environment served by the split air-conditioning units might not be able to satisfy the occupants.
NEUTRAL TEMPERATURE
Observed Neutral Temperature
y = 0.7362x - 21.001
26.5 27.0 27.5 28.0 28.5 29.0
Operative Temperature
Figure 14. Neutral temperature analyses
The intercept of regression line shows that the neutral temperature in such design studio was found to be 28.5˚C. The slope gradient of 0.7362 indicates
that every increase of about 1.36˚C of operative
temperature (top) correlates with 1 scale unit of TSV. It means that the occupants in this design studio will experience 1 unit change of thermal state for every 1.36˚C increase in operative temperature. However, it should be noted that the prediction is less accurate since the correlation coefficient of the regression line of TSV is quite low (R2 = 0.074).
Adaptive Model
The comfort temperature (neutral temperature) of adaptive model is calculated using equation derived by Humphreys and Auliciems (Humphreys and Nicol, 1998). Both models are used to predict the comfort temperature in the design studio in term of adaptive model which correlates the indoor and outdoor monthly mean temperatures.
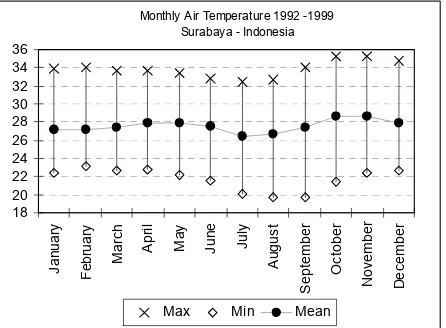
Monthly Air Temperature 1992 -1999 Surabaya - Indonesia
Source: Juanda Airport Met. Service – Surabaya
Figure 15. Mean monthly air temperature 1992-1999 in Surabaya – Indonesia
The weather data was obtained from Juanda Airport Meteorological Service in Surabaya- Indonesia. The data shown in Figure 15 represented
the minimum, maximum and mean monthly air temperatures collected from 1992 – 1999 weather data. The range 26.5˚ – 28.7˚C represented the mean monthly air temperature. The ranges 19.7˚ – 23.1˚C
and 32.5˚ – 35.2˚C represented the minimum and
maximum respectively with monthly fluctuation of about 10.9˚ – 14.4˚C. The survey was conducted in May which has an average air temperature of 27.9˚C.
The mean indoor temperature of 27.4˚C was
calculated based on the average air temperature of the design studio measured during the survey. Both the values are used to resolve the adaptive equations.
The comfort (neutral) temperature of 25.6˚C and
26.3˚C are predicted by Humphreys and Auliciems
model. Both of them are lower than the observed neutral temperature calculated using linear regression (see Figure 4.9). In fact, the Auliciems model predicted closer to observed neutral temperature (∆t = -2.2˚C) than Humphreys model (∆t = -2.9˚C). Hence, a better agreement was obtained when comparing the comfort temperature predicted by the
Auliciems model (26.3˚C) to the air temperature
level required by the University Board (26˚C).
CONCLUSION AND RECOMMENDATION
The most significant conclusion which can be drawn from this study was more than 80% of the occupants accepted the thermal indoor condition even though both the environmental and comfort indices exceeded the limit of the Standards (ASHRAE Standard 55 and ISO 7730). Other conclusions drawn from this study are:
- The distribution of top in the design studio
exceeded the threshold stipulated by the Standards (ASHRAE Standard 55 and ISO 7730) for sedentary activity in typical indoor clothing during summer conditions. In addition, the air temperature distribution in 87.5% of the occupied zone failed to meet the level as required by the university board.
- Occupants who felt neutral were not always
satisfied with the condition and wanted their environment to be cooler. The ones who were satisfied (prefer ‘no change’) with their environment, were not 100% having neutral sensation.
- Using linear regression analysis, observed neutral temperature was found to be 28.5˚C in operative temperature (top).
- Auliciems’ adaptive model has better prediction
model (26.3˚C) to the air temperature level required by the University Board (26˚C).
- The average PMV in the occupied zone was 0.97
which corresponds to a PPD of 24.9%. The lowest PMV of 0.58 and 0.52 can be found in occupied zones 4 and 5 respectively. Using linear regression, it was concluded that every increase of
about 0.5˚C of operative temperature (top)
correlates with 0.2 scale unit of PMV. Therefore it can be predicted that to meet the standard: -0.5 < PMV < +0.5 (ISO 7730, 1995), the operative temperature (top) range in such indoor condition should be: 24.8˚C – 27.1˚C.
This study shows that the occupants in the tropics may have a higher heat tolerance since they accepted the thermal condition which exceeded the Standards. In addition, the result of neutral temperature was higher than the upper comfort range predicted by the PMV model. However, there was an agreement with previous research in Jakarta – Indonesia done by Karyono (1998) where occupants accepted the indoor temperatures although it was predicted ‘too warm’ by the PMV.
The study recommends adjusting the room temperature to meet the comfort temperature predicted by Auliciems model, since this comfort prediction was in good correlation with the air temperature suggested by the University Board. The prediction of neutral temperature using regression line of TSV and top is not recommended to be used as a way for adjusting the temperature of the design studio because the prediction is less accurate in this study. The finding on occupants in air-conditioned building in the tropics may have high heat tolerance should be validated with further studies. This can be useful for the future planning and design of air-conditioned environment in the tropics. A monitoring study on the concentration of CO2 (carbon dioxide) should be carried out in the design studio served by split air-conditioning unit with no fresh air provision. There might be implication on the indoor air quality.
REFERENCES
ASHRAE, ASHRAE–Standard 55, Thermal
Envi-ronmental Conditions for Human Occupancy.
Atlanta: ASHRAE, Inc. 2004.
Auliciems, A. and de Dear, R. Air-conditioning in Australia I – Human thermal factors.
Architectural Science Review, 29, 1986. pp. 67-75
Awbi, H.B. Ventilation of Buildings (2nd ed.).
London: Spon Press. 2003.
Cheong, K.W.D., Djunaedy, E., Chua, Y.L., Tham, K.W., Sekhar, S.C., Wong, N.H., Ullah, M.B. Thermal comfort study of an air-conditioned
lecture theatre in the tropics. Building and
Environment, 38, 2003. pp. 63-73.
De Dear, R.J., Leow, K.G., and Foo, S.C. Thermal comfort in the humid tropics: Field experiments in air conditioned and naturally
ventilated buildings in Singapore.
Interna-tional Journal Biometeorology, 34, 1991. pp. 259-265.
De Dear, R.J. and Fountain, M.E. Field experiments on occupant comfort and office thermal environments in a hot-humid climate.
ASHRAE Transaction, 100, part 2, 1994. pp. 457-475
De Dear, R.J. and Brager, G.S. Developing an adaptive model of thermal comfort and
preference. ASHRAE Transaction, 104, 1998.
pp. 145-167.
De Dear, R.J. Thermal comfort in practice. Indoor
Air, 14 (Suppl. 7), 2004. pp. 32-39
Fanger, P.O. Thermal Comfort: analysis and
applications in environmental engineering. New York: McGraw-Hill. 1970.
Feriadi, H. Thermal comfort for naturally ventilated residential buildings in the tropical climate. Unpublished doctoral thesis. Singapore: National University of Singapore. 2003.
Fountain, M. and Huizenga, C. ASHRAE Thermal
Comfort Program version 1.0. Berkeley: University of California Berkeley. 1994.
Humphreys, M.A. and Nicol, J.F. Understanding the adaptive approach to thermal comfort.
ASHRAE Transaction, 1998. pp 991-1004.
ISO, ISO 8996: Ergonomics – Determination of
metabolic heat production. International Standards Organisation. 1990.
ISO, ISO 7730: Moderate thermal environments –
Determination of the PMV and PPD indices and specification of the conditions fro thermal comfort. International Standards Organisation. 1995.
ISO. ISO 9920: Ergonomics of the thermal
ISO. ISO 7726: Ergonomics of the thermal environment–Instruments for measuring phy-sical quantities. International Standards Organisation. 1998.
Karyono, T.H. Higher PMV causes higher energy consumption in air-conditioned buildings: a case study in Jakarta-Indonesia. In Nicol, F. et
al. (Ed.), Standards for thermal comfort:
indoor air temperature standards for the 21st century (pp.219-226). London: E & FN Spon. 1995.
Karyono, T.H. Report on thermal comfort and building energy studies in Jakarta-Indonesia.
Building and Environment, 35, 77-90.
Pergamon. 1998.
Kwok, A.G. Thermal comfort in naturally ventilated and air-conditioned classrooms in the tropics.
Unpublished doctoral thesis. Berkeley: University of California. 1997.
Kwok, A.G. Thermal comfort in tropical classrooms.
ASHRAE Transaction, 1998. pp. 1031-1047.
McIntyre, D.A. Indoor Climate. London: Applied
Science Publishers. 1980.
Parsons, K.C. Human thermal environments: the
effects of hot, moderate, and cold environments on human health, comfort and performance (2nd ed.) London: Taylor & Francis. 2003.
Santamouris, M., and Asimakopoulos, D. Passive