VEGETATION MONITORING OF MASHHAD USING AN OBJECT-ORIENTED POST
CLASSIFICATION COMPARISON METHOD
N. Khalili Moghadam a , M. R. Delavar b, *, A. Forati a
a MSc. Graduate, GIS Dept., School of Surveying and Geospatial Eng., College of Eng., University of Tehran, Tehran, Iran –
(n_khalili, forati )@alumni.ut.ac.ir
b Centre of Excellence in Geomatic Eng. in Disaster Management, School of Surveying and Geospatial Eng., College of Eng.,
University of Tehran, Tehran, Iran - [email protected]
KEY WORDS: Vegetation Reduction, Urban Development, Mashhad, Landsat Satellite Images, Object-Oriented Post Classification Comparison
ABSTRACT:
By and large, todays mega cities are confronting considerable urban development in which many new buildings are being constructed in fringe areas of these cities. This remarkable urban development will probably end in vegetation reduction even though each mega city requires adequate areas of vegetation, which is considered to be crucial and helpful for these cities from a wide variety of perspectives such as air pollution reduction, soil erosion prevention, and eco system as well as environmental protection. One of the optimum methods for monitoring this vital component of each city is multi-temporal satellite images acquisition and using change detection techniques. In this research, the vegetation and urban changes of Mashhad, Iran, were monitored using an object-oriented (marker-based watershed algorithm) post classification comparison (PCC) method. A Bi-temporal multi-spectral Landsat satellite image was used from the study area to detect the changes of urban and vegetation areas and to find a relation between these changes. The results of this research demonstrate that during 1987-2017, Mashhad urban area has increased about 22525 hectares and the vegetation area has decreased approximately 4903 hectares. These statistics substantiate the close relationship between urban development and vegetation reduction. Moreover, the overall accuracies of 85.5% and 91.2% were achieved for the first and the second image classification, respectively. In addition, the overall accuracy and kappa coefficient of change detection were assessed 84.1% and 70.3%, respectively.
* Corresponding author
1. INTRODUCTION
Vegetation has long been recognized as an important and valuable resource for humankind and many existing species. It is well known that vegetation provides many vital ecosystem services (Costanza et al., 1998) which directly and indirectly benefit humans globally, including food production, cultural benefits, and environmental regulation and support services (Yapp et al., 2010). Vegetation also provides habitat for many threatened and endangered species. In fact, native vegetation around the world is under threat from historical and on-going clearance, overgrazing, logging, invasive species, increasing soil and water salinity, poor land management and other factors, resulting in a degradation of natural ecosystem (Lawley et al. 2016). On the other hand, considering the unprecedented urban population and development growth trend, a plethora of valuable trees are cut annually, which will cause several negative consequences for the environment and ecosystem.
The reduction of farmlands in suburbs and vegetation destruction in urban areas are the negative consequences of urban development, building constructions, road and highway constructions, and other destructive activities within and around the urban areas, which will be ended in environment destruction. Therefore, appropriate methods for vegetation monitoring must be undertaken to prevent numerous probable negative consequences related to environment. The existence of
vegetation in urban areas is of great importance since it can control the environmental conditions and energy exchanges using the absorption of sun radiances (Goward et al., 1985). In addition, it is considered as a vital resource of urban area that is capable to reduce air pollution and soil erosion and to improve human health (Wagrowski and Hites, 1996).
area is inevitable. In addition, most of environments and ecosystems are dynamic and undergo rapid or gradual changes (Liu and Deng, 2010; Haarman et al. 2003). From development and management perspectives, acquiring current information about land use development, policy formulation, and managing resources are critical in these changing environments (Clark & Jantz, 1995; Sanchez, 2004; Wright, 1996).
So far, numerous researches have been undertaken in the fields of urban development and vegetation monitoring. Lawrence et al. (2006) mapped invasive plant (leafy spurge and spotted knapweed) using 128-band hyper-spectral imagery with 3 to 5 meters spatial resolution using Breiman Cutler Classifications (BCC) method. BCC builds multiple classification trees by repeatedly taking random subsets of the observational data and using random subsets of the spectral bands to determine each split in the classification trees. The acquired resulting classification trees vote on the correct classification in this research. The overall accuracy of 84% for the spotted knapweed classification was obtained, with class accuracies ranging from 60% to 93%. However, the change of this plant was not monitored over time.
Adam et al. (2010) provided an overview on the status of remote sensing applications in discriminating and mapping wetland vegetation, and estimating some of the biochemical and biophysical parameters of wetland vegetation. Torres-Sanchez et al. (2015) developed an innovative thresholding object-based image analysis algorithm based on the Otsu’s method, and studied how the results of their proposed algorithm were affected by different segmentation parameters (scale, shape, and compactness). The proposed procedure specifically was applied for vegetation detection in remotely sensed images captured with two sensors (a conventional visible camera and a multi-spectral camera) mounted on a drone. Lawley et al. (2016) reviewed the attributes of vegetation identification as important features for monitoring vegetation. Those indicators that can be monitored using site-based, RS-based and a conflation of both methods were found. It was found that remote sensing methods have the advantage of offering broad scale automated and repeatable methods for monitoring indicators of vegetation condition, but when combined with the detailed ecological site-based data in a GIS system, they can improve monitoring for answering ecological questions across a range of scales.
In this research, bi-temporal satellite image of Landsat from Mashhad, Iran, and its suburbs were used with the aim of detecting the urban and vegetation changes over 30 years period using an object-oriented PCC method. The hypothesis of this research is that it is possible to detect the changes related to vegetation and urban development with acceptable accuracy. In addition, the assumption of this research is that the sensor error corrections of satellite images were precisely undertaken by the provider of these images (USGS website).
In Section 2, the methodology of the research is presented. Section 3 illustrates a case study undertaken in Mashhad mega city and its suburbs using a bi-temporal Landsat satellite image. Finally, Section 4 concludes the paper.
2. METHODOLOGY
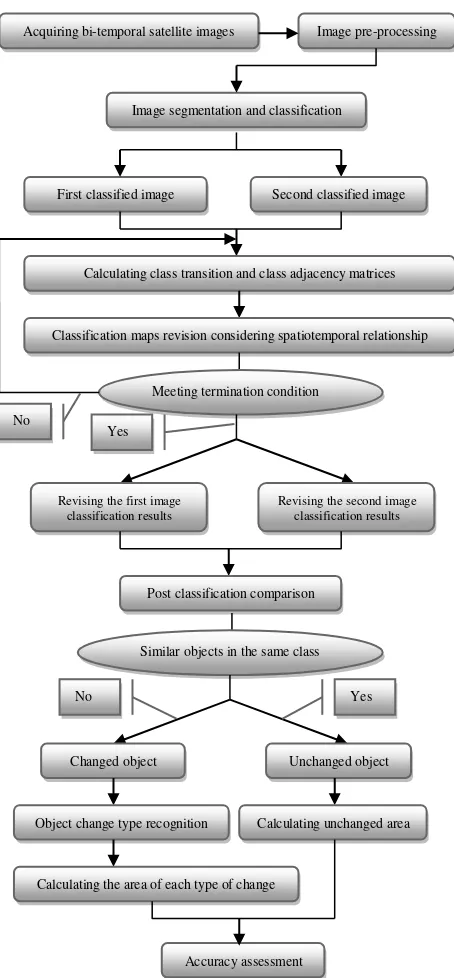
In this paper the process of change detection in addition to detecting the types of changes, based on an object-oriented PCC technique is proposed. Figure 1 represents the flowchart of
object-oriented PCC method considering spatiotemporal relationships, which is used in this research.
Figure 1. Object-oriented change detection process
The whole process of this research is implemented and coded in MATLAB software. Based on the flowchart of this research shown in Figure 1, firstly a bi-temporal satellite image from the study area should be acquired. Then, the radiometric and geometric image corrections should be undertaken in the pre-processing step. In the next step, both satellite images will segmented in two different processes and the whole objects in both satellite images will be segmented in an object oriented process (marker based watershed algorithm). Then the training samples from all classes in the study area will be uploaded to the software. Consequently, both of the images will be classified into different classes. In the next step, the transition and class adjacency matrices will be calculated and consequently, the classified image maps will be revised considering the spatiotemporal relationships in an iterative
Acquiring bi-temporal satellite images Image pre-processing
Image segmentation and classification
First classified image Second classified image
Calculating class transition and class adjacency matrices
Classification maps revision considering spatiotemporal relationship
Meeting termination condition
No
Yes
Revising the first image classification results
Revising the second image classification results
Post classification comparison
Similar objects in the same class
No
Changed object Unchanged object Yes
Calculating unchanged area Object change type recognition
Calculating the area of each type of change
process. If the revised classified image does not meet the requirements of termination of the process, the previous steps will be repeated. Otherwise, the final revised classified image maps will be produced and the process will go to the next step.
In PCC step, each pair of objects will be compared in both final classified images. If the class of the intended object is the same in both classified images, that object will be considered as unchanged object. However, if the class of the object is different in bi-temporal classified images, that object will receive the changed label. Therefore, the change image map will be produced. In the next step, the From-To change matrix will be produced in which all types of changes in addition to their total area in the images will be determined. In the final step, the overall accuracies of both classified images in addition to their kappa coefficients will be calculated using ground truth data. Then, some accuracy assessment parameters like overall accuracy, kappa coefficient, producer’s accuracy and user’s accuracy will be calculated for the produced change image map to assess the accuracy of change detection.
There are a number of change detection techniques that can be applied in order to produce change image map. Various change detection reviews based on pixel-based analysis of remote sensing data have been published (see e.g. Coppin et al., 2004; Deer, 1995; Jianyaa et al., 2008; Lu et al., 2004; Mouat et al., 1993; Singh, 1989; Otukei and Blaschke, 2010). Although pixel-based change detection techniques have been widely used for producing change image maps, the object-based image analysis and change detection techniques are considered more reliable and accurate and are used more than pixel-based methods. Some discussion can be found in (see e.g. Blaschke, 2010; Chen et al., 2012; Jianyaa et al., 2008; Lang, 2008; Gao et al., 2001; Haris et al., 1998). Considering the point that this research aim is to detect the vegetation and urban changes of the study area, high accuracies of results and detecting the types of changes (using From-To change matrix) is of great importance. Therefore, in order to detect the types of changes with acceptable accuracy, a conflation of object-oriented and post classification comparison methods is used in this research. For the images segmentation section, the object-oriented marker-based watershed algorithm is used. The reason for opting marker-based watershed image segmentation technique is that this method prevent over segmentation in comparison with other proposed methods (Liang et al., 2015). In addition, for the classification section, the maximum likelihood classification is used. Then, for producing change image map and From-To change matrix, the PCC method is implemented.
The marker-based image segmentation technique is consisting of three main steps (Gao et al., 2006). The first step is marker image extraction in which all marks (each mark denotes the existence of an object) are set to one and others are set to zero. This produces a marked binary image. A mark is a group of pixels whose gradient values are less than a threshold. In the second step, the false markers (like salt and pepper error), which can result in over-segmentation, will be eliminated with defining size constraint. The final step is segmentation by marker-based watershed algorithm in which the higher priority of a pixel is, the lower is the gradient value (Meyer, 1992; Gao et al., 2006). This algorithm can be summarized as: (a) labelling the markers and initialization of the priority queues and (b) region growing.
After the image segmentation process, the two images are divided into disjoint objects. Let us consider a bi-temporal
co-registered satellite image, acquired at two different times, t1 and t2 from the same area that are segmented using the marker-based watershed algorithm. Let X1 and X2 be d-dimensional feature each image can be regarded as a random experiment. Let the set C={Cp, 1 ≤ p ≤ L} with L=mN be composed of all the possible 1≤i≤N}. Based on the Bayesian formulation, the optimal sets of classification results Ct and Th that minimize the classification error, can be derived using decision rule in Equation (1) (Liang et al, 2015). density function of the feature vectors in the images X1 and X2, given the classes Cp and Tq, and can be discarded independence, are assumed as follow (Liang et al, 2015):
(6) (7)
where is the transition probability from land-cover class at t1 to at time t2. and
are the conditional probabilities at the two times. It is a fact that the effectiveness of assumption in Equation (2) is difficult to deduce in theory. Equations (5) to (7) are approximate formulas and more critical than others. However, Equations (6) and (7) have been applied in many researches to change detection applications (Bruzzone and Prieto, 2002; Bruzzone and Serpico, 1997). By substituting (4)-(7) into (3), Equation (8) is obtained (Liang et al, 2015).
(8)
In fact, is a prior probability of the classification results for all objects in the image acquired at time t1. The objects involved in the image at t1 are spatially dependent. The object is likely to be surrounded by objects with the same class, for example, the vegetation class prefers to be adjacent to other vegetation classes rather than the urban class. Markov random field technique is used to model the spatial-contextual information between objects (Gao et al., 2006). can be equal to Equation (9) (Liang et al, 2015).
(9)
where is the Gibbs energy function and Z is a normalized
constant. is defined as Equation (10)
(Liang et al, 2015).
(10)
where is potential function and is the weight of spatial-contextual information in the process. The higher is the adjacent probability of the two objects, the smaller is the function value. is defined as Equation (11) (Liang et al, 2015).
(11)
where is a conditional probability of land-cover class , given the adjacent class . By discarding the constant parameter from Equation (8) and applying Equations (9) and (11) to it, and then using logarithm function, Equation (12) will be obtained.
(12)
According to Equation (12), it is required to estimate the
conditional probabilities of and
at the two times, and land-cover transition
probability , which represents the temporal
dependence information between two times, and the probability of land-cover adjacency, describes the spatial-contextual information at time t1. The conditional probabilities
of and can be estimated
from the training sets of the two images. The probabilities of land-cover class transitions which represent the temporal dependence information between the two times establish an m*n matrix which is shown using Equation (13).
(13)
where the element with row i and column j in the matrix represents the probability of an object belongs to land-cover class at time t2, on the condition that it belongs to land-cover class at time t1. The conditional probabilities of the land-cover class adjacency which represent the spatial-contextual information at the time t1 compose an m*m matrix which is represented using Equation (14).
(14)
where the element with row i and column j in the matrix denotes the probability of an object belongs to land-cover class at time t1, on the condition that it is adjacent to the land-cover class at the same time. For the estimation of all the probabilities in matrix T and A, training sets are required. Consequently, the probabilities in matrix T and A from the whole images can be estimated using Equations (15) and (16) (Liang et al, 2015).
(15) (16)
where is the number of objects with land-cover class at time t1, and at time t2, is the number of object pairs with land-cover class and at t1, is the number of objects with land-cover class at t1, and is the number of objects adjacent to the object with land-cover class
at t1.
and are the classification results of k-th object at the two times. Change detection and change type recognition are implemented by comparing with . If is not the same land-cover class as , the object has changed from to . Otherwise, the object is unchanged.
3. CASE STUDY
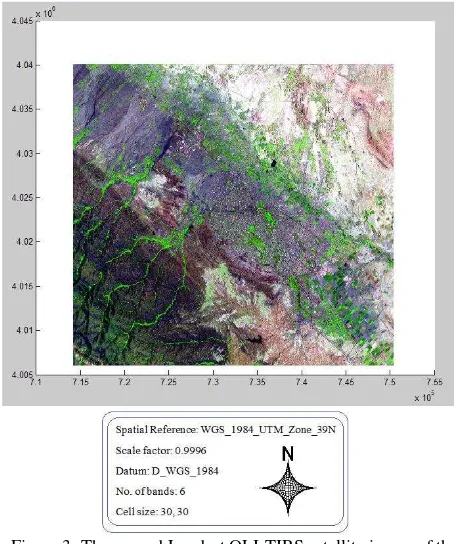
In this research, bi-temporal satellite image of Landsat TM and Landsat OLI-TIRS with the spatial resolution of 30 Meters acquired at April 22, 1987 and March 24, 2017, respectively, from Mashhad and its suburbs were used for the vegetation and urban change detection during the 30 years period. The study area of this research covers approximately 122774 hectares and is located between 53°22’53” E, 53°47’36” E and 36°10’34” N, 36°28’25” N, universal transvers Mercator (UTM) Zone 39. The bi-temporal satellite images are shown in Figures 2 and 3.
Figure 2. The first Landsat TM satellite image of the study area acquired at April 22, 1987
The reason that Mashhad was selected in this research is that an unprecedented urban development has occurred in this mega city. This remarkable urban development may cause vegetation reduction in fringes and in the city even though vegetation in each city is considered as a vital resource for human and environmental health. Therefore, the existence of sufficient vegetation in Mashhad and its suburbs has long been a subject of controversy between municipality and Ministry of Road and Urban Development. Consequently, a research in this city will reveal the changes related to this crucial land-cover class.
In the pre-processing step, the images were radiometrically corrected in two steps. Firstly, atmospheric corrections were applied, followed by topographic normalization. To eliminate the effects of the atmosphere such as scattering, haze, and to define the extent of clouds and cloud shades, the ENVI software
package was used (even though the satellite images were covered approximately with less than 10% cloud). On the other hand, for the topographic normalization, the developed method by Zaksek et al. (2015) was used. Therefore, the pseudo-geomorphological errors (which occur due to the shape of the terrain and the angle and time of the observation) were removed with a digital elevation model with grid resolution of 10 meters (Zaksek et al., 2015).
Figure 3. The second Landsat OLI-TIRS satellite image of the study area acquired at March 24, 2017
In order to correct the images geometrically using the empirical method, the second satellite image was registered to the first satellite image with RMS=0.27 using 24 Ground Control Points (GCPs) and undertaking a nearest neighbour resampling method. It should be noted that a generic approach was applied to extract the best set of GCPs from the set of original GCPs to improve the accuracy of geometric correction model (Nguyen, 2015).
Figure 4. The first classified image related to April 22, 1987
Figure 5. The second classified image related to March 24, 2017
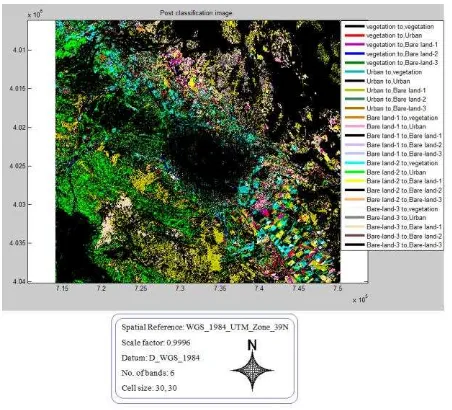
In the next step, the changed and unchanged objects were detected using PCC method and the change image map was produced. The produced change image map is represented in Figure 6. In Figure 6, the black colour illustrates unchanged areas and all other colours represent all other types of change according to the image legend.
Furthermore, the From-To change matrix was created and the areas of all types of the changed objects in addition to the area of unchanged objects were computed, separately. Finally, the accuracies of the classified images and the change image map were assessed using ground truth data. The results of satellite images classification and From-To change matrix is represented in Tables 7 and 8, respectively.
The overall accuracy is the mean of classification accuracy (Congalton, 1991). It is the ratio of correctly classified elements to total number of elements. Whereas, the kappa coefficient calculates the clustering accuracy compared to a totally random clustering (Congalton, 1991). The results of the proposed method in this research were compared with the ground truth data and accordingly the overall accuracies and kappa coefficients were calculated for images classification. In addition, the overall accuracy, kappa coefficient, user’s
accuracy and producer’s accuracy (for the changed and the unchanged objects) were calculated for the accuracy assessment of the produced changed image map. The accuracy assessment of the image classification and the change detection are represented in Tables 9 and 10, respectively.
Figure 6. The produced change image map using PCC method
Land cover \ year of Image acquisition 1987 2017
Vegetation area (hectares) 10062 5159
Urban area (hectares) 20976 43501.5
Bare land with soil coverage (hectares) 45833 33625 Bare land with sand coverage (hectares) 31943.6 25885
Cliff (hectares) 13959.4 14603.5
Sum (hectares) 122774 122774
Table 7. Satellite image classification results
From-To Area (hectares)
Unchanged vegetation 3050.1
Vegetation to urban 4174.4
Vegetation to bare land with soil 1655.4
Vegetation to bare land with sand 107.2
Vegetation to cliff 1075
Urban to vegetation 289
Unchanged urban 18860.1
Urban to bare land with soil 513.7
Urban to bare land with sand 201.2
Urban to cliff 1112
Bare land with soil to vegetation 1181.1
Bare land with soil to urban 10519.6
Unchanged bare land with soil 30443
Bare land with soil to bare land with sand 2101
Bare land with soil to cliff 1588.3
Bare land with sand to vegetation 272.3
Bare land with sand to urban 8886
Bare land with sand to bare land with soil 819.5
Unchanged bare land with sand 21748.7
Bare land with sand to cliff 216.4
Cliff to vegetation 366.5
Cliff to urban 1061.4
Cliff to bare land with soil 193.3
Cliff to bare land with sand 361
Unchanged cliff 11977.2
Accuracy / year of Image acquisition 1987 2017
Producer’s accuracy for unchanged objects (%) 73.8 Producer’s accuracy for changed objects (%) 89.5 User’s accuracy for unchanged objects (%) 92.7 User’s accuracy for changed objects (%) 85.9
Table 10. Change detection accuracy assessment
4. CONCLUSION
In this research, the areas of all types of changes in Mashhad were detected using bi-temporal Landsat satellite image and an object-oriented PCC method based on spatio-temporal relationship. Therefore, it is viable to detect the changes related to vegetation and urban development with acceptable accuracy according to the represented results in Tables 9 and 10 since the overall accuracy in satellite images classification is above 85% and in change detection is more than 84%.
According to Table 7, it is obvious that the urban area has dramatically increased during 30 years (1987 to 2017) about 22525.5 hectares. This considerable statistic proves the reported urban development of Mashhad during recent years, which might be the result of over population and poor urban planning and infrastructures of this mega city. On the other hand, the statistics related to vegetation (Table 7) verifies that this land-cover class has decreased about 4903 hectares in the last 30 years, which may be the cause of unprecedented air pollution in this city in recent years and destruction of the habitat for many floral and faunal species. Consequently, a relationship between the urban development and vegetation reduction in this research is observable. Although vegetation play a prominent role in controlling air pollution and soil erosion, this land-cover class was dwindled harshly, which was not taken into consideration in recent years in Mashhad.
Furthermore, the sum of bare land with soil coverage, bare land with sand coverage, and cliffs was 91736 hectares in 1987. However, this amount decreased to 74113.5 hectares in 2017 (equal to 17662.5 hectares reduction during 30 years). This means that not only some areas of vegetation class were added to urban class, but also some areas from three afore-mentioned classes (bare lands and cliff) were added to urban class demonstrating the fact that all land-cover classes were sacrificed for urban development.
Moreover, according to Table 8, although a great amount of vegetation is unchanged during 30 years (3050.1 hectares), the conversion of vegetation to other classes especially to urban class is critical. Approximately 4774.4 hectares of vegetation class was converted to urban class that can be infered as a result of land use change, deforestation, logging, destroying farmlands for construction purposes, and converting parks to sky scrapers (like business centres). The conversion of vegetation class to urban class is undoubtedly warning as it shows the construction has more priorities rather than vegetation and environmental
conservation that may be ended in several environmental problems such as global warning, air pollution, soil erosion, and changes in existing ecosystems. In addition, the represented statistics in Table 8 shows that 1762.6 hectares of vegetation class were converted to bare lands that increase the threat of soil erosion and flood hazard in the near future that may bring copious negative consequences for the Mashhad environment such as soil fertility reduction.
The analysis of urban class changes shows that 289 hectares of this class was converted to vegetation that might be the result of land use change with the purposes of vegetation retaining, new parks creation, and cultivation in some land parcels. This change is considered as constructive and beneficial change and if the trend and speed of this change accelerates, the Mashhad environment will be preserved and retained in future years.
The marvellous point in the analysis of bare land with soil coverage class changes is that 1181.1 hectares of this land-cover class was converted to vegetation that is a really good news for environmental conservationists since it might be the result of planting new trees for retaining vegetation class in Mashhad or growing new plants due to increase in precipitation. The analyses show that about 10519.6, 8886, and 1061.4 hectares of bare land with soil, bare land with sand, and cliff classes were converted to urban class substantiating the fact that urban development in the fringe and suburbs of Mashhad is clearly observable.
Taking this warning urban development and vegetation reduction into consideration, it is undeniably clear to assume that proposing novel practical solutions to prevent this destructive event is of great importance and necessity. Therefore, new urban plans and strategies to control and monitor vegetation in all over of this city is required more than ever to prevent an immense disaster from happening.
REFERENCES
Adam, E., Mutanga, O. and Rugege, D., 2010. Multispectral and hyperspectral remote sensing for identification and mapping of wetland vegetation: a review. Wetlands Ecology and sensing. ISPRS journal of photogrammetry and remote sensing, 65(1), pp.2-16.
Bruzzone, L. and Prieto, D.F., 2002. An adaptive semi parametric and context-based approach to unsupervised change detection in multitemporal remote-sensing images. IEEE Transactions on image processing, 11(4), pp.452-466.
Bruzzone, L. and Serpico, S.B., 1997. An iterative technique for the detection of land-cover transitions in multi temporal remote-sensing images. IEEE Transactions on Geoscience and Remote Sensing, 35(4), pp.858-867.
Chen, G., Hay, G.J., Carvalho, L.M. and Wulder, M.A., 2012. Object-based change detection. International Journal of Remote Sensing, 33(14), pp.4434-4457.
Congalton, R.G., 1991. A review of assessing the accuracy of classifications of remotely sensed data. Remote sensing of environment, 37(1), pp.35-46.
Coppin, P., Jonckheere, I., Nackaerts, K., Muys, B. and Lambin, E., 2004. Review ArticleDigital change detection methods in ecosystem monitoring: a review. International journal of remote sensing, 25(9), pp.1565-1596.
Costanza, R., d'Arge, R., De Groot, R., Farber, S., Grasso, M., Hannon, B., Limburg, K., Naeem, S., O'neill, R.V., Paruelo, J. and Raskin, R.G., 1998. The value of the world's ecosystem services and natural capital. Ecological economics, 25(1), pp.3-16.
Deer, P., 1995. Digital change detection techniques in remote sensing.
Gao, H., Lin, W., Xue, P. and Siu, W.C., 2006. Marker-based image segmentation relying on disjoint set union. Signal Processing: Image Communication, 21(2), pp.100-112.
Gao, H., Siu, W.C. and Hou, C.H., 2001. Improved techniques for automatic image segmentation. IEEE transactions on Circuits and Systems for Video Technology, 11(12), pp.1273-1280.
Gibbons, P. and Freudenberger, D., 2006. An overview of methods used to assess vegetation condition at the scale of the site. Ecological Management & Restoration, 7(s1), pp.S10-S17. Goward, S.N., Cruickshanks, G.D. and Hope, A.S., 1985. Observed relation between thermal emission and reflected spectral radiance of a complex vegetated landscape. Remote Sensing of Environment, 18(2), pp.137-146.
Haarman, H.J.T.M., Verhagen, J. and Rovers, C.A. eds., review of multi-temporal remote sensing data change detection algorithms. The International Archives of the Photogrammetry, Remote Sensing and Spatial Information Sciences, 37(B7), pp.757-762.
Khalili Moghadam, N., Delavar, M.R. and Hanachee, P., 2015. Automatic Urban Illegal Building Detection Using Multi-Temporal Satellite Images and Geospatial Information Systems. The International Archives of Photogrammetry, Remote Sensing and Spatial Information Sciences, 40(1), p.387.
Lang, S., 2008. Object-based image analysis for remote sensing applications: modeling reality–dealing with complexity. Object-based image analysis, pp.3-27.
Lawley, V., Lewis, M., Clarke, K. and Ostendorf, B., 2016. Site-based and remote sensing methods for monitoring indicators of vegetation condition: An Australian review. Ecological Indicators, 60, pp.1273-1283.
Lawrence, R.L., Wood, S.D. and Sheley, R.L., 2006. Mapping invasive plants using hyperspectral imagery and Breiman Cutler classifications (RandomForest). Remote Sensing of Environment, 100(3), pp.356-362.
Liang, L., Ying, G., Wen, X. and Zhang, Y., 2015. Object-Oriented Change Detection Based on Spatiotemporal Relationship in Multitemporal Remote-Sensing Images. The International Archives of Photogrammetry, Remote Sensing and Spatial Information Sciences, 40(7), p.1241.
Liu, J. and Deng, X., 2010. Progress of the research methodologies on the temporal and spatial process of LUCC. Chinese Science Bulletin, 55(14), pp.1354-1362.
Lu, D., Mausel, P., Brondizio, E. and Moran, E., 2004. Change detection techniques. International journal of remote sensing, 25(12), pp.2365-2401.
Meyer, F., 1992. Color image segmentation. In Image Processing and its Applications, 1992., International Conference on (pp. 303-306). IET.
Mouat, D.A., Mahin, G.G. and Lancaster, J., 1993. Remote sensing techniques in the analysis of change detection. Geocarto International, 8(2), pp.39-50.
Newell, G.R., White, M.D., Griffioen, P. and Conroy, M., 2006. Vegetation condition mapping at a landscape‐scale across Victoria. Ecological Management & Restoration, 7(s1), pp.S65-S68.
Nguyen, T., 2015. Optimal ground control points for geometric correction using genetic algorithm with global accuracy. European Journal of Remote Sensing, 48(1), pp.101-120.
Otukei, J.R. and Blaschke, T., 2010. Land cover change assessment using decision trees, support vector machines and maximum likelihood classification algorithms. International Journal of Applied Earth Observation and Geoinformation, 12, pp.S27-S31.
Parkes, D., Newell, G. and Cheal, D., 2003. Assessing the quality of native vegetation: the ‘habitat hectares’ approach. Ecological Management & Restoration, 4(s1), pp.S29-S38.
Sanchez, T.W., 2004. Land use and growth impacts from highway capacity increases. Journal of urban planning and development, 130(2), pp.75-82.
Sheffield, K., 2006. Analysis of vegetation condition using remote sensing technologies. Ecological Management & Restoration, 7(s1), pp.S77-S77.
Singh, A., 1989. Digital change detection techniques using remotelyWsensed data. International Journal of Remote Sensing, 10(6), p.989L1003.
Torres-Sanchez, J., López-Granados, F. and Peña, J.M., 2015. An automatic object-based method for optimal thresholding in UAV images: Application for vegetation detection in herbaceous crops. Computers and Electronics in Agriculture, 114, pp.43-52.
Wagrowski, D.M. and Hites, R.A., 1996. Polycyclic aromatic hydrocarbon accumulation in urban, suburbs , and rural vegetation. Environmental Science & Technology, 31(1), pp.279-282.
Wallace, J., Behn, G. and Furby, S., 2006. Vegetation condition assessment and monitoring from sequences of satellite imagery. Ecological Management & Restoration, 7(s1), pp.S31-S36.
Wright, D.W., 1996. Infrastructure planning and sustainable development. Journal of Urban Planning and Development, 122(4), pp.111-117.
Yapp, G., Walker, J. and Thackway, R., 2010. Linking vegetation type and condition to ecosystem goods and services. Ecological Complexity, 7(3), pp.292-301.