FROM INTERNET OF THINGS TO SMART DATA
FOR SMART URBAN MONITORING
E. Gastaud
Digital Services Development Unit, Digital Innovation and IT Department Métropole de Lyon, France
KEY WORDS: Internet of Things, Smart City, Urban Monitoring. ABSTRACT:
Cities are facing some of the major challenges of our time: global warming, pollution, waste management, energy efficiency. The territory of the Metropolis of Lyon, France, which brings together 59 municipalities, for a total of 1.3 million inhabitants, has launched a smart city policy aimed, among other things, at finding solutions for these issues. The data platform set up in 2013 is one of the cornerstones of this policy. In this context, the Metropolis of Lyon is deploying solutions that will enable, through the collection of new data, to implement monitoring and action tools in several fields.
As part of a European innovation project called "bIoTope", focused on the development of new services based on the Internet of Things, a multidisciplinary team is implementing a system to mitigate the effects of global warming in the city. Thanks to various connected objects allowing a true monitoring of the trees, and by using different data sources, an automatic and intelligent irrigation system is developed. In the field of waste management, several hundred containers in which the inhabitants throw away their used glass for recycling will soon be equipped with fill rate sensors. The main objective is to have this network of sensors interact easily with the container collection trucks. Expected results are an optimization of the collection, thus less fuel consumed, less noise, less traffic jam. The Metropolis of Lyon also participates in the "Smarter Together" project, focused on the development of intelligent duplicable solutions for cities, in the field of energy. A digital tool for analysing consumption and energy production at the level of a neighbourhood is currently being developed. This requires both interfaces with multiple partners, the development of a data model reflecting the reality of the terrain, from the sensors to the buildings, and the implementation of a visualization tool.
1. INTRODUCTION 1.1 The context
The Metropolis of Lyon is a community of 59 municipalities with an area of 538 km2 and a total population of 1.3 million inhabitants. The services of the Metropolis, which employ about 8000 agents, work in both the urban and human fields: mobility and travel, cleanliness, water and sanitation, major projects and development, economic development, energy and environment, as well as knowledge and culture, childhood and family, solidarity, habitat and housing.
In 2050, 50% of the world's population will live in a city. The impact of this concentration on the environment, housing, economy, transport and the well-being of citizens raises many questions. The Metropolis of Lyon has chosen to transform these constraints into opportunities by developing its strategy "Smart Greater Lyon Metropolis", based on 4 pillars:
● New mobility, the Agile city: The Greater Lyon promotes multimodal modes of travel and develops shared mobility solutions and tools for the prediction of traffic, flow management and optimisation of urban logistics.
● Digital services: Data processing is the basis for the development of the digital and smart city. Greater Lyon provides a public data platform, Data.grandlyon.com, which offers several hundred data sets.
● Energy: the management and distribution of energy resources are among the major stakes of the metropolises for decades to come. Energy data, from meters and intelligent buildings allow the emergence of "smart grids" involving reflection on the new economic models of energy.
● The conditions of innovation: The Greater Lyon makes available to the actors of the territory the infrastructure and
conditions necessary for the conduct of projects with high potentialities
Since early 2015, the Metropolis has evolved its organization to better take into account the stakes of the digital and the data. The classic "Information Systems Directorate" has evolved into the "Directorate of Digital Innovation and Information Systems". In this directorate, a section focused on users and digital services was created.
The central role of the data for the development of digital services has been recognized by the appointment of a chief data officer, whose role is to promote, in the internal services as well as with the public and private partners of the territory, the sharing and re-use of data.
More recently, a data scientist has also joined the Metropolis teams. He will help make evolve the existing data platform to a big data system, and allow the emergence of new services through cross-analysis of heterogeneous data over long temporal periods.
1.2 Issues
1.2.1 Urban facts, figures for Lyon
Lyon and its agglomeration are in constant population growth. The population is expected to increase up to 1.45 million inhabitants by 2030. This implies a development of urbanization and questions about the city's capacity to support this growth, particularly with regard to mobility and energy management. This growth is accompanied by a rapid change in climatic conditions: the average temperature in Lyon increased by 1.9° C between 1959 and 2014 and this trend will increase in the future with global warming.
1.2.2 Example of urban heat islands
The Urban Heat Island (UHI) refers to the elevation of air temperature in the urban area compared to the rural periphery. The energy inputs to the UHI origin are 80% of the solar heat and 20% anthropogenic heat (APUR 2012). In large cities; the temperature difference due to this phenomenon is on average 3 to 4°C, but it can reach 8°C in a heatwave period.
This phenomenon has an obvious effect on the comfort of the populations, especially concerning the most vulnerable, and may even constitute a public health problem. The Metropolis, through its "Climate Plan" service, implements studies, experiments and devices that aim to ensure that the city adapts itself to the current climate change.
1.2.3 Field of optimization of urban
In the area of urban services, i.e. the day-to-day actions of the Metropolis on its territory, the most obvious of which are water and waste management: they imply many possibilities for optimisation. Digital, as will be illustrated in this paper, can allow, through a virtually instantaneous dissemination and processing of information collected throughout the territory, to reduce the nuisance of pollution and noise produced by urban services.
1.2.4 Energy: The emergence of a production at the local level
The topic of "smart grids" has been emerging for a few years. The first step in progress, before seeing the real appearance of real intelligent networks, is to collect and analyse the data of the various sources of energy production and consumption, in a multi-stakeholder approach involving local authorities, the suppliers and the energy producers, the public and private owners, the social landlords.
1.3 Monitoring in the city
1.3.1 Innovative initiatives already in operation The monitoring of the operation of the city in near real time has already been in place for several years in certain areas. As far as road traffic concerned, for example, the Metropolis has long established "CRITER", a centralized traffic management system of the Metropolis. It allows to manage in real time road traffic on the 2 400 km of roads of the agglomeration, by the management of green waves, and the introduction of the priority for public transport.
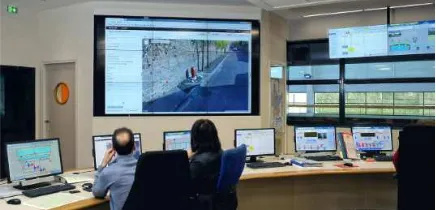
In the field of drinking water management, the delegate of the public water service has been deployed since 2014, at the request of the Metropolis, the HUBLO solution, a system of global monitoring of operations. It is a user interface of a large wall of images to manage, control, visualise everything that happens in real time (Figure 1).
Figure 1 The HUBLO control room, drinking water monitoring system.
1.3.2 Opportunities offered by the development of the Internet of Things
The technologies of the Internet of Things will allow to deploy, at modest costs and without large-scale civil engineering works, sensors and actuators in the whole territory.
It is already possible to think about new monitoring solutions for the management of the roads and the parking lots, for the management of the waste, for the optimization of the lighting or also for the monitoring of the pollution.
1.4 European projects to advance in this direction
1.4.1 The bIoTope Project for "Building an Internet of Things open innovation ecosystem for connected smart objects"
This project funded by the European Commission is a part of the Horizon 2020 programme and takes place over the period 2016-2018. It is coordinated by the Finnish University Aalto and brings together about twenty partners, including the Metropolis of Lyon. other partner cities, Brussels and Helsinki, deploy pilot-use cases in line with their smart city policy.
1.4.2 Smarter Together
Smarter Together is also a H2020 project funded by the European Commission which takes place over the period 2016-2020. The project is coordinated by the company SPL Lyon Confluence, which is in charge of the planning and development of the new Confluence district in Lyon. The cities of Vienna and Munich are also partners in this project, which aims to put in place intelligent and inclusive solutions in urban areas.
2. CONNECTED OBJECTS TO BETTER WITHSTAND HEAT WAVES
2.1 The context
2.1.1 A history of studies and initiatives in this field The Metropolis has been interested in adapting to climate change and studying urban heat islands for several years. Temperature-measuring campaigns are regularly organized. The studies carried out showed the influence of vegetation and streams on the temperature in the city. These studies also examined the thermal comfort index (UTCI: Universal Thermal Climate index). This index is calculated from 6 parameters: air temperature, humidity, wind, wall temperature, metabolism, and clothing. The quality of the shading and the flooring materials have a significant influence on this index.
The measurement campaigns have so far been carried out using temporary or mobile sensors. The partners of the territory, and in particular the researchers working on the modelling of the phenomenon of heat island to its impact on the populations, would like to benefit from a true network of permanent sensors, allowing a thorough study of the microclimates existing in the different parts of the agglomeration.
2.1.2 Why did we choose this case of use for the bIoTope project?
In the field of environment, it was initially envisaged to extend an experiment aimed at optimally triggering the snow removal of streets, also called winter viability.
It was finally decided that this emerging topic of a permanent network of temperature sensors and the devices for adapting to climate change was a very good case of application for a project centred on connected objects.
2.2 The pilot test area
2.2.1 The choice of Garibaldi Street
Garibaldi Street is located in the heart of the business district of the Part-Dieu (Figure 2). This area is the subject of a large-scale urban renewal project. Garibaldi Street was designed in the 60s as an "urban expressway" to facilitate car traffic in the city centre. The time of the Car is over and the requirements for development and quality of life have changed.
Figure 2. Garibaldi Street, deployment area of the tree monitoring sensors.
A first phase of requalification of this street was delivered in 2014, on a portion of a few hundred meters. The requalification aims to remove this urban break (i) by reducing motor traffic, by reducing the number of traffic lanes, (ii) by carrying out a landscaping along the way, adding plant strips to the alignment shafts already in place, and (iii) by giving all their place to the soft or collective modes of mobility.
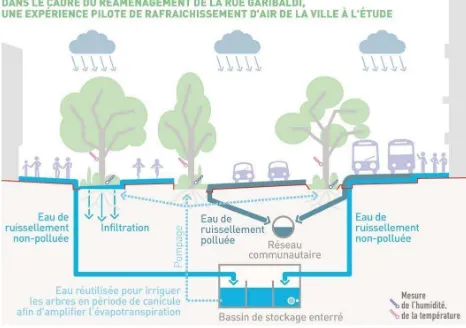
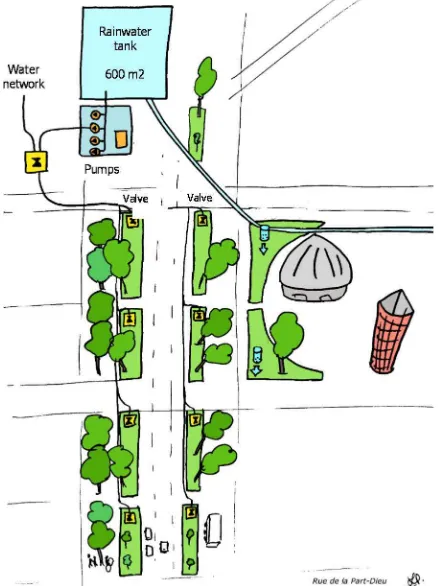
Figure 3. Garibaldi Street: Storm water recovery and watering of green spaces.
In addition, the Metropolis has benefited from the work to create a rainwater recovery basin under the pavement. The water stored in the basin can be used for the cleaning of the streets, by reloading on a distribution terminal the street sweepers, or for the watering of the plant areas of the street. The
street-planted strips have water inlet connections to the pumps in this basin (Figure 3).
2.2.2 About the first devices not connected in 2016 Measuring devices were deployed in the summer of 2016 on this street; on the one hand, air temperature sensors, in order to contribute to the studies on the urban heat island; and on the other hand, soil moisture and tree activity sensors, to monitor the health status and watering needs of plants.
These sensors were, however, not communicative for the most part: they required, for the recovery of their measurements, either a physical connection to a PC every 6 weeks, or a short distance radio communication at regular intervals.
2.3 Deployed sensors
The area of experimentation has four distinct vegetated zones on the east side of the street. Four "control" trees each belonging to one of these zones are equipped with all the sensors described thereafter (Figures 4 and 5).
Figure 4. Garibaldi Street, location of measuring points.
Figure 5. Garibaldi Street, overview of the sensor system
2.3.1 Air temperature
The network of air temperature sensors was deployed by the metropolis itself. A telecommunication engineering student from INSA, Smart City option, has devoted his Master thesis to the referencing of temperature sensors, to their installation protocol and to the implementation of the infrastructure of transmission, storage and visualization of data.
The sensors are available on the market from the sensing Labs brand. They have a precision of more or less 0.2°C. A LoRa communication module is embarked.
These sensors have been installed in eleven different locations. Four are dedicated to the control trees on Garibaldi Street, but seven other sensors are located in reference areas located on the outskirts of Garibaldi Street. These are areas that can have a
different wind exposure, within a non-wooded or very mineral environment.
The air temperature sensors take a measurement every 30 minutes.
2.3.2 Soil Moisture
Soil moisture sensors are deployed by a partner company of the Metropolis, Hydrasol, in charge of the creation and maintenance of the green spaces. These sensors were originally designed to monitor young plantations: a web portal is used to track the soil moisture status and alerts are triggered when watering is required.
These sensors measure the soil pressure, from which the soil moisture level can be inferred. Three sensors are embedded in the ground at a distance of 2.5 metres from the trunk of the tree, respectively at a depth of 30, 70 and 100 centimetres.
They are connected to an acquisition system including a Sigfox communication module.
The Soil moisture sensors take a measurement every hour.
2.3.3 Tree activity (variation in diameter of a branch) Tree activity sensors are also called dendrometric sensors (relative to trees or branches). They have been developed by INRA, the National Institute of Agronomic Research, and are deployed by our partner Hydrasol. The system developed by INRA was named PepiPiaf (Figure 6).
Figure 6. "PepiPiaf sensor: measurement of diameter variation of a branch.
This system measures and memorizes very precisely (micron sensitivity) the diameter variations of the branches of the tree, without disturbing its operation, and the air temperature at the measuring point.
During daytime, under the influence of solar energy, when absorption does not totally compensate for perspiration, the diameter of the branches decreases. At night, in the absence of perspiration, the rehydration of the tree allows a recovery of the diameter of the branches accompanied by an increase of it, when climatic conditions have been favourable to photosynthesis and thus to growth.
These sensors are deployed in the four control trees in the experiment area. They are connected similarly to an acquisition system including a Sigfox communication module.
These sensors take a measurement of branch diameter variation every hour.
2.4 Communication Networks 2.4.1 LPWAN networks
For certain uses the LPAWN networks, (for Low Power Wide Area Network), are a solution suitable for communication with connected objects. This technology makes it possible to send and receive messages of very small size, on very long scopes (from 5 to 40 kilometres), with a major advantage that the components used to emit these messages are very inexpensive and very low energy (it is therefore possible, with a simple battery, to emit a few messages per day during 10 years).
The principle of these networks is as follows: the objects communicate with low frequency radio (around 800 to 900 MHz) to antennas deployed in the territory. These antennas are gateways: they are connected to the Internet and transmit information to storage servers. Communication is two-way, but sending information to objects is limited in size and frequency.
2.4.2 Gateways
The Metropolis, in order to master all the technological components, has made the choice to deploy, for this pilot project, its own LoRa network. Two gateways have been put in place: one has already been acquired ready for use; the other was assembled and is based on a Raspberry Pi.
The deployed network gives full satisfaction. Nevertheless, several limits lead us to consider for the rest and in order not to lose measured data, the use of a private network operator LoRa: ● Antennas must be installed on high and secure points, also allowing connection to a wired network;
● The servers on which the various software components of the network are installed must offer a 24-hour service guarantee; ● Human resources must be dedicated to the monitoring and maintenance of such a network.
2.5 Data storage and formatting 2.5.1 Storing raw data
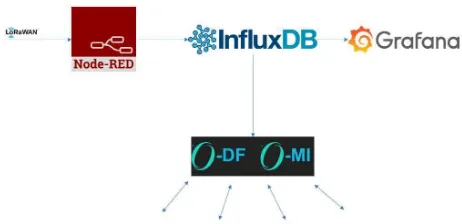
Coming from the LoRa server, the data are inserted into a database InfluxDB (Time series database specially designed for metrics and events), and the open source platform InfluxDB meets the needs of the IoT by collecting and storing the data with their timestamp (Figures 7 and 8).
The database insertion processing uses Node-RED. This solution, also open-source, allows the design of processing chains in a web environment.
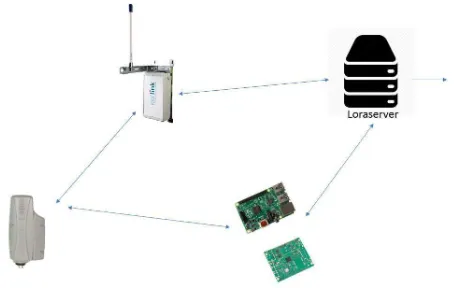
Figure 7. Temperature sensor network Architecture (Part 1).
Figure 8.Temperature sensor network Architecture (Part 2).
2.5.2 Work on semantics
One of the objectives of the bIoTope project being the interoperability of the connected objects, we have carried out the RDF (Resource Description Framework) modelling of the network of the temperature sensors. RDF is the basic language of the semantic Web. RDF, a graph model that allows to formally describe WEB resources and their metadata.
An RDF-structured document is a set of triplets. A triplet RDF is an association (subject, predicate, object). In the extract of the RDF modelling provided, in Turtle syntax, one finds for example the triplet:
<Tree/77a25daf-c501-4dcc-9c5e-74ccbaf7d8f2> a dbo:Plant,
lgdo:Tree;
geo:lat 4.576348e+0 ; geo:long 4.851277e+00.
The subject is the tree identified by its ID on our LoRa network. The first two lines specify that our subject (the tree) is (predicate a) a plant (dbo: plant) or a tree (Lgdo: tree), referring respectively to the vocabulary dbo (http://dbpedia.org/ontology/) or the Vocabulary Lgdo (http://linkedgeodata.org/ontology/).
The following lines apply to the subject "tree" the geo:Lat and geo:long predicates that are defined in the geo vocabulary (Http://www.w3.org/2003/01/geo) and are intended for the values of the latitude and longitude of the tree.
2.5.3 Storage in the standard of the bIoTope project: O-MI, O-DF
O-MI and O-DF, used in IoT interoperability, are the standards developed by Aalto University, the coordinator of the project, and have been done to apply interoperability to the real objects deployed in the pilots of the bIoTope project. They are published by The Open Group. O-MI stands for open messaging Interface and O-DF stands for open Data Format.
Following are the features of O-MI and O-DF:
• O-MI and O-DF are used similar to HTTP and HTML used in the web respectively.
• They can be used independent of each other.
• O-MI as the name suggests used for communication between IoT devices.
• O-DF as the name suggests used as data or payload format for communication between IoT devices.
• They are specified using XML schema.
• They can be transported by any underlying protocol such as HTTP, HTTPS, FTP, SMTP, XMPP etc.
• They help in publishing and discovering available information and services
• Read and Write of immediate information, historical information, alerts and events can be done using these.
O-DF is a generic format which represents "anything" in the IoT domain. Same structure is used to publish, discover, query and retrieve information.
An "O-MI node" was created on a server in the Lyon metropolitan area to store the data collected by the various sensors described above. This node can be queried from anywhere with queries in the O-MI format.
The data are stored in the O-DF format. O-DF allows to define the data in a hierarchical structure and not in a graph form. The initial RDF model was therefore best translated into a hierarchical structure and we retained the references to vocabularies and ontology (Figure 9).
Figure 9. O-DF data structure.
2.6 Visualisation and operation of data 2.6.1 Dashboard
Grafana is a free solution for making dashboards from measured data stored in time series-oriented databases, including the database used for our pilot system, InfluxDB (Figure 10).
The implemented dashboard offers several views on the same webpage:
● A mapping of the location of the sensors, ● The last values identified by each sensor,
● The curves of the measured values from the 11 sensors for the last 24 hours.
Figure 10. Dashboard of sensors and temperature readings (Grafana software).
2.6.2 The availability on the O-MI node
Each time a new measurement is inserted into the InfluxDB base, it is also inserted into the O-MI node by an O-mi "write" message.
2.6.3 And soon, the publication on IoTBnB
IoTBnB, a glance at the famous platform for linking in the field of accommodation, is a platform developed within the framework of the bIoTope project.
By querying the O-MI nodes deployed across the web, IoTBnB allows the publication of all connected objects available at the O-MI standard. This publication is made accessible by a cartographic interface and enables subscription to the objects services; with micro-payment mechanisms when needed.
2.7 The continuation 2.7.1 Other data sources
● Storm water basin data and remote management
The storm water basin located under the Garibaldi Street is managed by the water management of the Metropolis. This basin, along with all water purification equipment, is already monitored by a SCADA (Supervisory Control And Data Acquisition)-based computer solution.
In the rest of the project, the water level information will be recovered by file exchange with the system "STELLA". These data will come online to determine irrigation opportunities.
● Weather forecasts and readings
In order to know the context, and in particular to know whether in the hours and days to come the weather will be hot and dry or if in the contrary rains are planned, the local weather forecast data will be retrieved.
● Crowd-sourced Air temperature Data
The last source of data could be used to refine the study of air temperatures and humidity in the pilot's geographic perimeter. These are the temperatures and humidity levels identified by the sensors installed by individuals and by various organizations such as businesses, schools, public services.
2.7.2 Deploy connected valves
The manual irrigation of one of the control trees is already possible (Figure 11).
Several solutions have been considered in order to trigger remote irrigation. The easiest way is to control the opening and closing of valves at the entrance of each planted strip in the pilot perimeter. It is then the opening of the valve which, by the
detection of a variation of pressure, triggers the operation of the pump located in the basin.
Figure 11. Garibaldi Street, overview of planted strips and irrigation device.
It remains to study the technical feasibility of this type of valve, with a connection to the LoRa network already used.
2.7.3 Making the different sensors and actuators to collaborate to go towards intelligent irrigation
The final objective of this pilot project is to use the various sensors and actuators deployed to water the trees at the right time and with the right amount of water, so that they can continuously ensure their role in the moderation of the temperatures.
3. CONNECTED OBJECTS TO OPTIMISE URBAN SERVICES:THE CASE OF BOTTLE BANKS
3.1 History and background
3.1.1 Waste management and recycling, a jurisdiction competence of the Metropolis
The Metropolis of Lyon collects and treats household waste throughout its territory.
More than 2200 bottle banks (Figure 12) are located on its territory. The exact location (of these containers is available for any inhabitant on the website of the Metropolis
(https://www.grandlyon.com/services/carte-des-silos-a-verre.html).
The bottle banks are also the object of a dataset on the Metropolis data platform: this dataset allows to consult online the mapping of containers, but also to know the metadata associated with this dataset. Developers or users of geographic front-end can access data through a wide range of webservices
and formats: The standards of the Open Geospatial Consortium WMS (map-oriented) and WFS (geographic objects oriented), but also Shapefile, KML, GeoJSON, JSON (Figure 13).
Figure 12. Bottle banks, collection and overflow.
Figure 13. Map of the bottle banks on the data platform of the Metropolis.
3.1.2 An organization divided between public service and private actors
The bottle banks are manufactured in the context of a public market by a company chosen by the Metropolis following a competitive process. As part of this market, the Metropolis becomes the owner of the containers
This public market is regularly renewed and as time progresses, different models of bottle banks have been manufactured and installed: Most have an equivalent volume, from 1 to 2 m3, but they have shapes and a decoration that evolves as the time and the manufacturers are selected.
With regard to the collection of these containers, the Metropolis has made the choice of an outsourcing to private companies. In the current market the collecting companies have a result obligation and organizes as it wishes the collecting tours. It suffers a financial penalty in case of overflow of the container.
3.1.3 An experiment on 10 bottle banks in 2015 The technical architecture of this solution was based on the following components:
● Communicating objects are fixed inside the containers, by a magnetic device, and equipped with the following sensors and functions:
Fill rate sensor: Based on ultrasound, this sensor allows to know, hour by hour, the height of the stack of glass in the containers, and to deduce a filling rate
Temperature sensor: To be alerted in the event of a container fire
Accelerometer: To measure the force exerted on the container at the time of its dumping
GPS: Allows you to know the exact position of the container at all times
SIGFOX-compatible radio communication Module: Allows the transmission of data from the communicating object to a central server.
● The Sigfox proprietary network: The data of the bottle banks were uploaded several times a day, via the existing Sigfox antenna network, to the "backend" server of Sigfox
● A Microsoft Azure server: This cloud computing platform has been used to centralize and process all identified measures.
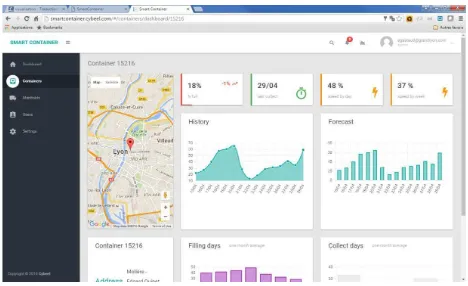
It appeared thanks to the data traced by the sensors, that many containers were emptied while their filling rate did not exceed 40%. Therefore an optimization of the collection based on the knowledge of the filling rate is possible (Figure 14).
Figure 14. Example of a bottle banks dashboard – Proof of concept of 2015.
3.2 The opportunity of a large-scale pilot with bIoTope
This case is complementary to the first case described earlier: indeed it concerns an area in which an activity has already been in place for many years, and it applies to a number of objects potentially much more important. The main characteristics are as follows:
● 200 to 300 containers equipped: it is necessary, in order to test the optimization features, to deploy the solution on a geographic area sufficiently wide and covering at least the area of a current collection tour.
● A collector: the selected geographic area will concern one and only one of the various private partners providing the collection.
3.3 The objectives 3.3.1 Normalizing data
As described above, the field of bottle banks management involves various public and private actors. As the public contracts are renewed, the players can change.
It is therefore particularly important, in order to develop a collection optimization solution, that data coming from the different systems must be standardized. A work will be undertaken to present the data from the various objects connected in an intelligible and perennial way: As it is already underway for trees, the static and dynamic information of the bottle banks and pickup trucks will be represented according to
the O-MI/O-DF standard, using public vocabularies and ontology.
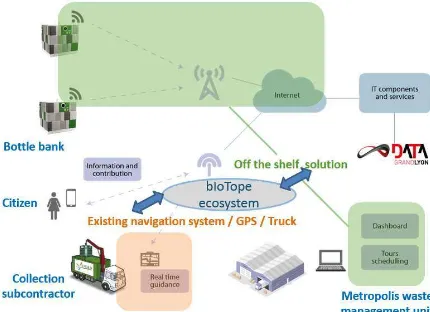
3.3.2 Advancing the interoperability between the connected container network and the pickup trucks Several collectors with trucks and computerized management systems of different tours already intervene in the territory of the metropolis. Tomorrow, several different filling-rate systems could be deployed, either as a function of geographic areas or as technological developments in sensors or transmission modes. The current pilot must provide, independently of the actors and technologies, a layer of information virtualization allowing a fluid and optimum interaction between the bottle banks and the collecting trucks (Figure 15).
Figure 15. Target solution structure for bottle banks.
4. CONNECTED OBJECTS AND DATA AT THE SERVICE OF THE
ENERGY ANALYSIS OF A DISTRICT
4.1 Background
4.1.1 The Confluence district
The Confluence district is a vast territory of 150 ha in the heart of Lyon, where the two rivers (Rhône and Saone) merge and which has long lived in the rhythm of industrial and port activities. The structural and geographic changes of these activities have let an urban space to be reconquered. Since 2003, a large urban project is underway. Eventually this project will double the size of the Lyon’s CBD.
The development of the Confluence aims at building the city intelligent and durable. The challenge is to reconcile environmental requirements with anticipation of the future needs of users. Far from a purely technical and regulatory approach, the Lyon Confluence management company has made quality of life a priority of its actions. Since the launch of this urban project, this issue aims to create a sober, innovative and creative city, encouraging soft mobility and limiting environmental impacts. A city accessible to all who know how to weave strong links between the existing and the new achievements.
It is in this perspective that the development society and the Metropolis have initiated the European Smarter Together Project presented in section 1. Within this framework, monitoring solutions are deployed at the scale of new buildings or refurbished buildings, and computerized piloting tools at the neighbourhood level.
4.1.2 The need for analysis of energy production and consumption
To meet the objective of a more sober neighbourhood in energy and limiting environmental impacts, a large place is given to renewable energies and local production of energy in the development: photovoltaic solar panels, rapeseed cogeneration plants, temporary storage of locally produced energy, and development of an urban heat network powered by a local power plant.
The emphasis is also placed on the energy sobriety of buildings: thermal renovation of old buildings, construction of new buildings with positive energy, involvement of inhabitants in the daily monitoring of their consumption.
In parallel to the realization of the infrastructure, it is necessary to develop digital tools to verify the achievement of the objectives set: annual energy balance of a building with positive energy, real consumption of an eco-renovated building, production of a local installation of renewable energy.
A consolidation of production data and energy consumption is also indispensable to consider a later stage: local consumption of locally produced energy, in order to actually implement the smart grid principle. This requires a fine analysis of the production and consumption of the different entities along with a time step.
4.2 Connected objects for big data
Many sensors are installed in buildings and energy production facilities. Two examples of sensors are described here to illustrate the possibility of obtaining sufficiently detailed data for the purpose of energy analysis.
4.2.1 Linky meters
Linky is the name of the communicating meter developed by Enedis, the main manager of the electricity distribution network in France, in application of European directives advocating the generalization of this type of meters. It is expected to be installed in thirty-five million French households on the 2021 horizon. Linky is part of the category of communicating meters (AMM for Advanced meter Management), i.e., they can be interrogated and operated remotely. To do this, Linky uses the PLC technology (powerline) on the low voltage network, as the first level of communication. A second level of communication is ensured via the mobile telephony network between the concentrator (installed in a transformer and distribution station) and the central system.
These meters will be deployed by the end of the year 2017 over the entire territory of the Confluence district.
A data exchange will be implemented between Enedis and the Metropolis of Lyon, based on the Common Information Model (CIM) standard. These data, although at a wide enough mesh for confidentiality reasons, will allow a detailed knowledge of the consumption curves at the neighbourhood level.
4.2.2 Data loggers for the monitoring of electrical consumption in buildings
For a very fine knowledge of electrical consumption, data loggers are deployed in some buildings. These recorders are small stand-alone modules that are installed on the electrical boards and connected to the Internet.
This type of module can be queried directly using different protocols (Modbus, HTML ...), and it is possible to store very detailed information about the power used and the energy consumed by different parts of a building.
Data loggers provide access to a higher level of accuracy than the Linky meter when required for extensive building-level analysis.
4.3 Data storage
4.3.1 The central role of the data platform
The Metropolis data platform provides the pivotal role in integrating and using energy data from the Confluence district. A convention has been passed with each data producer to frame the storage and availability of data on the platform. This convention specifies the data concerned, their time-step and the public or private nature. Indeed, the data platform is not only used to publish data to the public but it also serves to make data available to the internal services of the Metropolis or to privileged partners in the framework of projects such as Smarter Together. format. The SOS Standard is applicable to use cases in which sensor data need to be managed in an interoperable way. This standard defines a web service interface which allows querying observations, sensor metadata, as well as representations of observed features. Further, this standard defines means to register new sensors and to remove existing ones if necessary. Also, it defines operations to insert new sensor observations. (from http://www.opengeospatial.org/standards/sos)
This format is particularly suitable to provide, in an interoperable format, sensor data which are time series. It is an implementation written in Python and named IstSOS (http://istsos.org/) which was chosen to implement this standard for the Metropolis.
4.3.3 Structuring of information in the SOS standard The structuring of the data in the SOS standard has resulted in several iterations. The difficulty was to take into account the different data families of the project, and to be able to easily integrate new networks of sensors or data sources as the neighbourhood changes and the data releases by their different producers. In the SOS standard, the observed properties are linked to 3 levels: service, offering, procedure. As examples, here are the choices selected to date for the city-block Hikari positive Energy Island.
Service: Energy. It is in this global service that we will find all the measures related to the production or the consumption of energy. Those of Hikari but also those of other buildings or of photovoltaic production plants or of the urban heat network. Offering: Hikari. This level includes all sensor data from the city-block.
Procedure: We will find several procedures for Hikari. A procedure for the city-block as a whole, to store data observed at this level: for example the energy produced by the cogeneration plant which is common to the three buildings of the block. And a procedure for each of the buildings of the block, because some observed properties are linked to a building precisely, such as the electrical consumption of one of the floors of the building.
4.3.4 The Big Data
So far the data platform of the Metropolis contains practically no data set integrating historical data. Most datasets are available only for the current value of the data. For example, for
the availability of self-service biking system, the number of available bikes is refreshed every minute, and only the last known value is made available.
The new services being developed, especially in the field of energy, are asking for data analysis possibilities over a large period of time, one or even several years in the case of energy. The frequency of updating the data may be less than the hour. So the volume of data is increasing drastically.
In addition, the current data platform allows for very vertical increases. And it relies on open source software adapted to big data integration, storage and analysis.
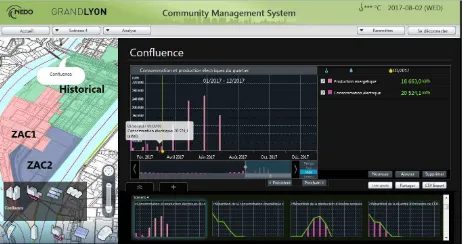
4.4 A transversal visualisation tool: The Community Management System
Most of the systems in Confluence that produce energy data offer their own data retrieval and consultation system: software for technical management of buildings, system of supervision of the urban heat network, software for monitoring of photovoltaic production, etc.; all these systems have their own data visualization interface.
The sharing of these data and their storage in a common format (SOS) allow the realization of a tool of visualization transverse to all the energy data of the district. This tool was named "Community Management System" (CMS).
After an initial version that used a dedicated database, a new version is being developed: it relies exclusively on data stored in standardized format, on the data platform of the Metropolis. It is developed only by using open source components.
This tool allows a cartographic visualization of the location of the data-producing entities. It allows to consult in graphical form the production and the energy consumption of positive energy buildings or renovated buildings, but also to view consolidated data on different areas of the neighbourhood or on the neighbourhood as a whole. The data platform stores raw data and the CMS applies data to the processing or aggregation rules.
The CMS also allows to verify the achievement of the objectives set for several scenarios of the Smarter Together project. As an example, eco-renovated buildings must see their energy consumption per square metre lower below a certain threshold ("guideline").
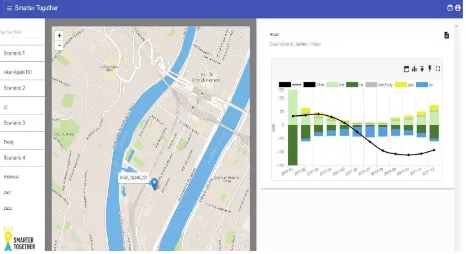
Figure 16. Version 1 of the Community Management System: Energy Visualisation and analysis tool at the Confluence of the neighbourhood.
Figure 17. Community Management System Version 2: Energy Visualisation and analysis tool at the Confluence of the neighbourhood.
5. CONCLUSION
Urban monitoring is not a novelty. As we have seen, the city has long been equipped with sensors or automata that allow to reduce traffic or else to oversee the systems of drinking water distribution.
What is new in contrast, and which is brought by the technologies around the Internet of Things, is the ease of deployment of new sensors and actuators in the city. Without major road works and the deployment of dedicated networks, cities can now consider monitoring solutions in a wide variety of areas.
The first steps of the Metropolis of Lyon in this field teach us that a uniform technological solution cannot meet all the needs. At the level of information transport, a structuring and broadband wired network is indispensable, but wireless and low-energy transmission networks must be used to deploy intelligent objects in mobile elements such as bottle banks or in difficult-to-access areas such as trees.
These technologies are evolving rapidly; it is likely that in a few months or years, GSM antennas will support a new radio-wave transmission standard, such as NarrowBand IOT (Https://en.wikipedia.org/wiki/NarrowBand_IOT) which will de facto represent a very dense and immediately usable network. It is therefore important in this area to remain cautious about investments and, like what is advised in finance to the good fathers of families, not to put all their eggs in the same basket.
As for the uses and therefore the dashboards or applications to be developed, we do not believe there is either a universal solution. It seems to us that the applications to be deployed, in order to respond correctly to use cases, must be specifically developed with the most appropriate technologies. In the end there is therefore not a global solution of monitoring but rather of specialized business applications, in the continuity of the existing.
But there is one element to be treated in a uniform way regardless of the business domain, namely data. With the pilot projects and experiences presented in this paper, we have been comforted in our policy of valuing and disseminating data. The Data platform is a privileged storage and publishing area, which forms a kind of pivot for all application services, and in particular for the new monitoring services.
As we have seen through several cases of use, the Internet of objects and its applications to urban monitoring are accelerating, two of the guidelines already identified in the road
map of our data platform: on the one hand the big data management, and on the other hand, the compatibility of the data published with the semantic web and more generally with standards and formats allowing reuse and sharing of the most easy as possible.
REFERENCES
APUR, 2012, Les îlots de chaleur urbains à Paris. Cahier 1, Published by APUR (Paris Urban Planning Agency). December 2012.
bIoTope Project, 2017, Presentation of the project. Website: http://www.biotope-project.eu
Grafana open source software, 2017 Presentation. Website: https://grafana.com/
LoRA, 2017, Presentation of the LoRa Alliance association. Website: https://www.lora-alliance.org/
Metropolis of Lyon Data Platform, 2017. Website: https://data.grandlyon.com/
SigFox, 2017, Presentation of the company. Website: https://www.sigfox.com/en
Smarter Together Project, 2017, Presentation of the project. Website: http://smarter-together.eu/